


Journal of Climate Change and Pollution
ISSN:
3108-2025 (Online)
DOI Prefix (Crossref): 10.67238
 Download PDF
ABSTRACT
This study examined long-term trends in temperature and precipitation in the Omo–Gibe Basin of Ethiopia and explored their implications for hydropower infrastructure. Climate data spanning 32 years (1987–2019) were obtained from 15 meteorological stations across the basin. To ensure reliable trend analysis, Levene’s test was applied using SPSS to identify and exclude stations with inhomogeneous data. Data consistency was further checked using the double mass curve method, which compares cumulative climate records to confirm uniformity among stations. Missing climate records were filled using the inverse distance weighting (IDW) interpolation method. Trends in temperature and precipitation were analyzed using the Mann–Kendall test and Sen’s slope estimator implemented in R, allowing both the direction and statistical significance of changes to be assessed. The results show a clear warming trend across the basin. Statistically significant increases in both minimum and maximum temperatures were detected at 11 of the 15 stations, while two stations showed decreasing trends and two exhibited no significant changes. In contrast, precipitation generally declined, with 11 stations recording significant downward trends. The remaining four stations showed no significant monotonic trends in either annual or seasonal rainfall. These changes in temperature and precipitation patterns have important implications for hydropower development and operation. Rising temperatures and declining rainfall can intensify soil erosion, leading to increased sedimentation in reservoirs. Higher sediment loads reduce reservoir storage capacity and can damage turbines and other mechanical components, increasing maintenance costs and lowering overall efficiency. Overall, the findings highlight a warming and drying trend in the Omo–Gibe Basin and emphasize the need to account for climate variability and change in hydropower planning, design, and management. Integrating climate-resilient strategies into hydropower infrastructure and operations is therefore essential to reduce risks and ensure long-term sustainability in the face of climate change.
Keywords: Temperature; Precipitation; Hydropower Infrastructure; Omo-Gibe River Basin; Ethiopia
INTRODUCTION
Since the onset of the industrial era, human activities have increasingly driven a rise in global mean surface temperatures, largely through the emission of greenhouse gases [1]. Multiple lines of evidence confirm the ongoing nature of climate change, including marked increases in precipitation totals accompanied by altered seasonal distributions, sustained upward trends in monthly and seasonal air temperatures, and significant changes in snow cover extent and depth [2-4]. Over the past century, global temperature and precipitation regimes have undergone substantial shifts, primarily as a result of anthropogenic greenhouse gas emissions from fossil fuel combustion such as coal, oil, and natural gas and large-scale land-use changes, including deforestation [5]. Projections by the Intergovernmental Panel on Climate Change (IPCC) indicate that global surface temperatures may increase by approximately 1.4–5.8 °C by the end of the twenty-first century, with carbon dioxide remaining the dominant contributor [1]. These projected changes underscore the far-reaching consequences of global warming, particularly for hydropower systems in developing countries that rely heavily on climate-sensitive water resources [6]. Moreover, increasing temperature variability is expected to amplify the frequency, intensity, and seasonal variability of extreme climate events [7].
Temperature and precipitation are among the most influential climatic variables governing human well-being, ecosystem stability, and biodiversity. Alterations in these variables disrupt complex environmental processes, increasing the likelihood of hydrological extremes such as floods and droughts, with cascading effects on water resources, infrastructure, economic systems, and natural ecosystems [8]. Such changes also pose growing challenges for hydropower infrastructure by modifying river flow regimes, reducing generation efficiency, and threatening structural integrity. Across the globe, river basins have exhibited pronounced climate-driven shifts in temperature and precipitation patterns [2-4]. In Ethiopia, the Omo–Gibe River Basin plays a critical role in national energy security, hosting three major cascading hydropower plants Gilgel Gibe I, Gibe II, and Gibe III which together contribute approximately 45% of the country’s total electricity generation. However, climate-related stresses have increasingly affected hydropower performance in the basin. For example, in May 2019, the Ethiopian government reported an energy shortfall of 476 MW at the Gibe III dam, attributed largely to climate-induced hydrological variability. Despite the strategic importance of the basin, comprehensive analyses of long-term temperature and precipitation trends and their implications for hydropower infrastructure remain limited. This knowledge gap highlights the need for a focused assessment of climatic trends in the Omo–Gibe River Basin and their potential impacts on the sustainability and resilience of hydropower systems. The findings of this study aim to inform policymakers and water– energy planners by providing scientific evidence to support the development of effective adaptation and mitigation strategies for hydropower infrastructure under changing climatic conditions.
MATERIALS AND METHODS
Study Area
The Omo–Gibe River Basin, Ethiopia’s second-largest river system, is a key hydropower source located in the country’s southwest, covering about 79,000 km² and draining into Lake Turkana. Shared mainly between the Oromia region and SNNPR, the basin supports approximately 14.6 million people, with rain-fed agriculture as the dominant livelihood. It exhibits strong climatic and topographic contrasts, with annual rainfall ranging from less than 400 mm in the southern lowlands to nearly 1,900 mm in the highlands, and temperatures averaging above 29°C in low-lying areas and around 17°C in upland regions. Rainfall seasonality varies spatially, while the basin’s diverse terrain includes high plateaus and low plains, with elevations ranging from about 400 m to over 3,300 m above sea level. The basin contributes an estimated 16.9 billion cubic meters of annual runoff, accounting for roughly 14% of Ethiopia’s surface water resources.
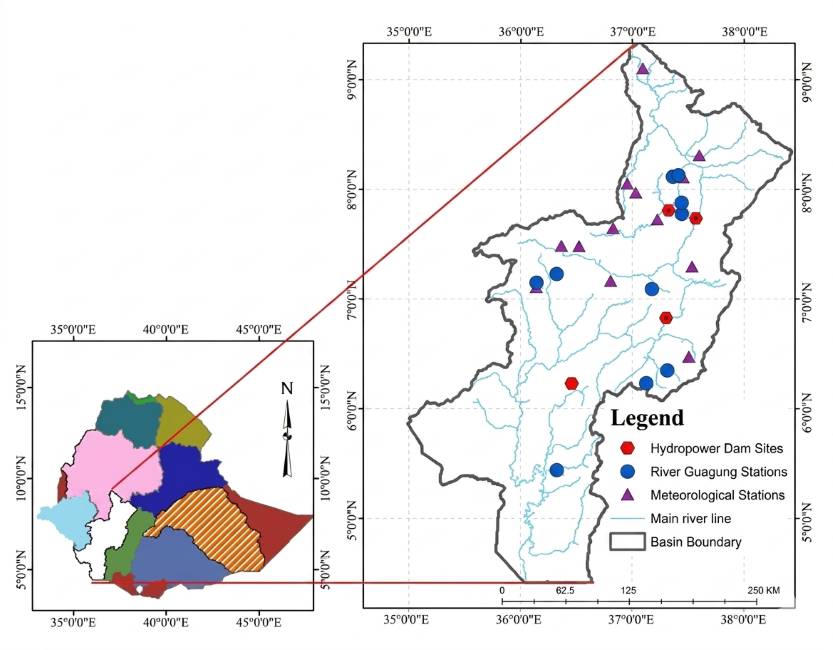
Figure 1: Location Map of the Study Area
Data
Daily climate data for the basin were obtained from the National Meteorological Agency (NMA) for the period 1980– 2019, including precipitation as well as minimum and maximum air temperatures. The dataset comprises records from over twenty-two rainfall stations and twenty temperature stations distributed across the study area (Table 1).
| Name of Gauge Station | Record Period | Latitude | Longitude | Elevation (m) |
|---|---|---|---|---|
| Agaro | 1995-2019 | 7°85' | 36° 56' | 1669 |
| Assandabo | 1986-2019 | 7° 76' | 37° 23' | 1764 |
| Bako | 1986-2019 | 9°12' | 37° 05' | 1650 |
| Bonga | 1986-2019 | 7°28' | 36° 24' | 1599 |
| Gidole | 1986-2019 | 5°65' | 37° 37' | 1431 |
| Hossana | 1980-2019 | 7°57' | 37° 86' | 2306 |
| Jimma | 1986-2019 | 7°67' | 36° 82' | 1710 |
| Jinka | 1980-2019 | 5°78' | 36° 56' | 1373 |
| Konso | 1986-2019 | 7°34' | 37° 44' | 2087 |
| Limugenet | 1986-2019 | 8° 07' | 36° 95' | 1767 |
| Seku | 1990-2019 | 7°68' | 40° 20' | 2471 |
| Shebe | 1986-2019 | 7° 51' | 36° 52' | 1921 |
| Wiliso | 1986-2019 | 8° 55' | 37° 98' | 2058 |
| Wolaita | 1986-2019 | 6° 82' | 37° 75' | 1854 |
| Wolikete | 1986-2019 | 8° 28' | 37° 77' | 1888 |
Table 1: Rainfall Gauging Stations and Locations in the Study Area
Source: National Meteorological Agency (NMA) of Ethiopia. (Collected, 2024)
Climate Data Preprocessing and Method of Data Analysis
Climate Data Homogeneity Test
Levene's test was applied using the Statistical Package for the Social Sciences (SPSS) to identify and exclude stations with inhomogeneous data for the trend analysis of climatic variables in this study.
Climate Data Consistency Test
Climatic data consistency implies that a time series is derived from a single, stable statistical population, whereas inconsistency or non-stationarity suggests shifts among different populations, often resulting from human-induced climate change or land-use alterations. Verifying data homogeneity is therefore a critical prerequisite for studies assessing climate change impacts, as reliable climate records are essential for effective present and future water resource management. In this study, climatic data consistency was evaluated using the double mass curve method. This method is based on the principle that a stable proportional relationship between two related variables produces a linear cumulative relationship over time, with the slope indicating their relative consistency. By comparing cumulative values from individual stations with those from neighboring reference stations, the method helps identify inconsistencies while minimizing random variability. Application of the double mass curve confirmed the homogeneity of all selected climate station records; consequently, all datasets were retained for subsequent analyses and climate change projections.
Climate Missing Data Filling
Handling missing values in climate datasets is crucial to ensure completeness and reliability. Data gaps are a frequent issue, especially in developing regions, and can compromise the accuracy of climate analyses and trend detection. Such gaps typically result from temporary absence of observers, equipment malfunctions, recording errors, extreme weather events, irregular sensor calibration, or difficulties accessing measurement sites [9]. Therefore, addressing missing data appropriately is a necessary step prior to any analysis. In this study, missing climate records were estimated using the inverse distance weighting (IDW) method, a commonly used and straightforward approach in climatology [10]. This technique predicts missing values by computing a distance-weighted average from neighboring stations, following the formula:
Where:
M0 is the estimated missing value,
Mi is the value of the same variable at the ith station and
di is the distance between the target station and the ith surrounding the station.
However, the accuracy of this method depends more on the radius of influence than the weighting function itself [11]. While none of the stations in this study were more than 100 km apart, previous research recommends using a 100 km influence radius for reliable estimates [11].
Climate parameter trend analysis
Trend analysis of climate variables, a common approach in previous studies, examines long-term datasets to detect patterns, shifts, and changes in various climate-related parameters [12]. Statistical methods are typically applied to quantify and visualize these trends, helping to determine whether significant changes such as increases or decreases in temperature, shifts in precipitation patterns, or variations in snowpack accumulation and melt have occurred. In research focusing on the Lombardy region, seasonal and annual temperature and precipitation data were analyzed, along with total monthly snow water equivalent (SWE) during the snow accumulation and melting period from December to June. In this study, statistical tools including the Mann–Kendall test and Sen’s slope estimator were employed to identify and evaluate trends, providing insights into the evolution of climate variables and detecting meaningful changes over time [13].
Mann-Kendall (MK) Trend Test
This study evaluates the statistical significance of precipitation and temperature trends across seasons from 1987 to 2019 using a two-tailed homogeneity test implemented in R. The null hypothesis (H₀) assumes no monotonic trend in the data series, whereas the alternative hypothesis (Hₐ) indicates the presence of a continuous monotonic trend [2-4]. Test statistics were compared against critical values to decide whether to reject H₀, with Type I error rates set at 5% or 10% (p-values of 0.05 or 0.1). The critical Z-value (Z₁/₂) corresponding to a 5% significance level was 1.96, as determined from the standard normal distribution table. Observed trends in temperature and precipitation were quantified using Z-scores expressed in standard deviations, alongside associated p-values and confidence levels. A 95% confidence interval was applied, corresponding to Z-values of -1.96, 0, and +1.96. The null hypothesis was rejected when p-values fell below 0.05. The Mann-Kendall (MK) test statistic, including Var[S], and the Z-test statistic were calculated according to standard formulas. Equation 2 provides the variance of corrected ranks, accounting for linked p-values in the dataset.
Where n is the number of data points, xi and xj are the data values in time series i and j (j > i), respectively, and sign (xj – xi) is the sign function as:
In these equations, Xi and Xj represent the time-series observations in chronological order, n represents the length of the time series, tp represents the number of ties for the pth value, and q represents the number of tied values.
Negative Z values in a series indicate a downward trend, whereas positive Z values in meteorological time series correspond to an upward trend. To assess changes in precipitation and temperature, the software packages Trend and the Kendall R libraries were utilized, which also allowed evaluation of the statistical significance of these changes. Using pattern analysis and recognition methods, meteorological time series data can be analyzed to determine whether variables increase, decrease, or remain stable over time [14]. The author’s approach, implemented through a GitHub project, was compared against existing methods for trend detection, historical time series analysis, and identification of reversal points [15-16]. These R packages are freely available through the Comprehensive R Archive Network (CRAN) and include detailed user manuals, while the GitHub repository provides access to version-controlled code. The software enabled the generation of numerical and graphical representations of trends. For trend analysis, a nonparametric approach—the Mann-Kendall (MK) trend test was applied [17]. This test was used to detect trends in climatic variables, assess their statistical significance, and determine the presence or absence of trends. The MK test is particularly advantageous due to its low sensitivity to outliers and its applicability to time series data without requiring assumptions about the underlying data distribution
Sen’s slope estimator test
Sen's slope estimator is a statistical technique for quantifying the rate of change in a linear relationship between two variables. It is commonly employed in fields such as hydrology and climatology to assess trends in time series data [18]. The resulting slope indicates the direction and magnitude of change: positive values suggest an increasing trend, negative values indicate a decreasing trend, and values near zero imply stability or the absence of a notable trend. In this study, Sen's slope estimator was implemented using the R programming environment to evaluate trend magnitude. The trend package offers a built-in function for Sen's slope calculation, facilitating straightforward application. Additionally, a custom function was created to compute the estimator by calculating all pairwise slopes between data points and selecting the median slope as the final estimate. This function was applied to the dataset to derive the trend values.
RESULTS AND DISCUSSION
Assessment of Annual and Seasonal Temperature Trends for Significant Statistical Changes
The study evaluated the statistical significance of changes in both observed and projected minimum and maximum temperatures, considering annual and seasonal patterns. Trend analyses indicated notable upward shifts in both minimum and maximum temperatures across most periods and seasons. Temperature records from fifteen meteorological stations within the Omo-Gibe River Basin, spanning 32 years (1987– 2019), were analyzed. The results showed statistically significant increasing trends at eleven stations, decreasing trends at two stations, and no significant monotonic trends at two stations (Figure 2). Overall, observations suggest a general rise in mean annual temperatures, with important implications for hydropower infrastructure. Elevated temperatures can accelerate reservoir evaporation, reducing water availability for electricity generation. They also increase thermal stress on infrastructure, potentially shortening the lifespan of key components and raising maintenance costs. The combined effects of higher evaporation and shifting precipitation patterns may lower reservoir levels, threatening the ability to meet energy demands, especially during dry periods. Moreover, warming trends can alter seasonal energy requirements, increasing dependence on hydropower during peak demand periods and emphasizing the need for adaptive energy management strategies. These findings highlight the critical importance of incorporating climate-resilient design and strategic planning into hydropower operations. Integrating temperature trend data into infrastructure planning and operational models is essential to optimize performance and mitigate risks posed by ongoing climatic changes in the Omo-Gibe River Basin.
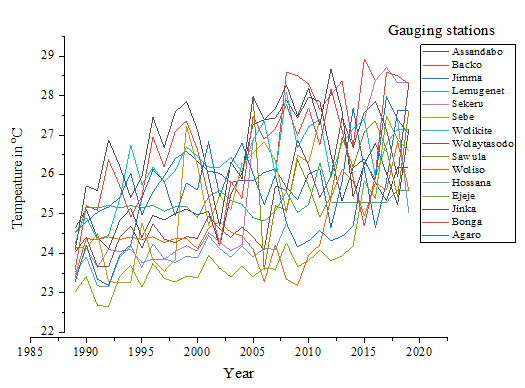
Figure 2: Annual Average Temperature Changes in Omo-Gibe River Basin (1989-2019).
Long-term climatic patterns in the Omo-Gibe River Basin are reflected in shifts in both monthly maximum and minimum temperatures. Over the years, maximum temperatures have shown a steady increase, with the hottest months—typically March through May—frequently surpassing 30°C in lowland areas. This upward trend has accelerated in recent decades, largely due to global warming. Minimum temperatures have also risen, particularly during the cooler months of November to January, leading to slightly higher lows in traditionally colder, high-altitude regions. The rise in minimum temperatures has been more pronounced than that of maximum temperatures, contributing to a narrowing of the diurnal temperature range. Spatial differences are evident, with lower-altitude areas experiencing more significant warming than mountainous regions, as illustrated in Figures 3 and 4.
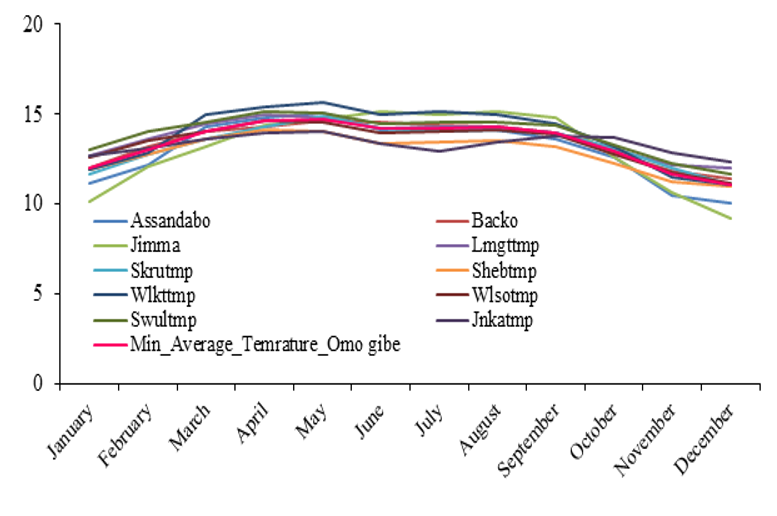
Figure 3: Observed Monthly Minimum Average Temperature (1987-2019)
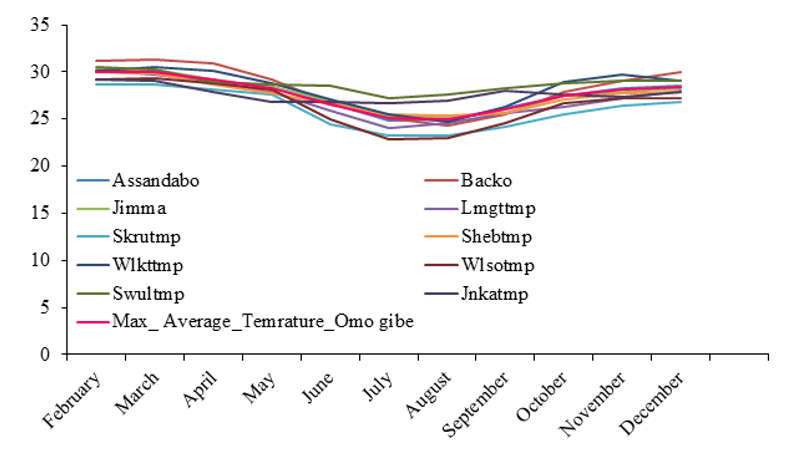
Figure 4: Observed Monthly Maximum Average Temperature
The results of the statistical monotonicity test for the seasonal average temperature trend are shown in (Figure 5), where it was found that two (2) stations had a significantly negative decreasing trend, eleven (11) had a significantly positive increasing trend, and two (2) had no statistically monotonic seasonal temperature change trend at all.
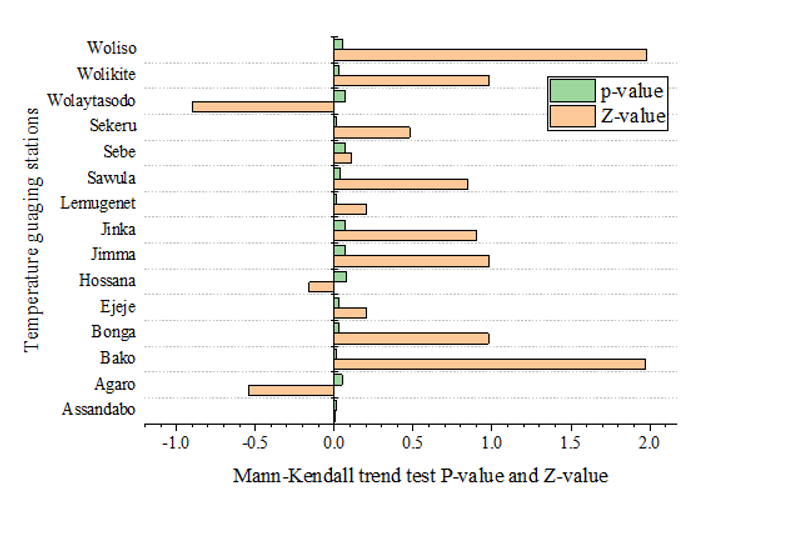
Figure 5: Changes in Seasonal Average Temperature in Omo-Gibe River Basin during 1987-2019
Assessment of Annual and Seasonal Precipitation Trends and Detection of Statistically Significant Changes
The analysis of annual and seasonal precipitation variations revealed statistically significant trends between 1987 and 2019. To assess changes in precipitation patterns within the Omo-Gibe Basin, data from fifteen precipitation measurement stations were considered. Among these, time series data from eleven stations over the study period (1987–2019) indicated a declining trend, while the remaining four stations exhibited no statistically significant change. Overall, the historical precipitation records, as depicted in Figure 6, suggest a general decrease in annual precipitation across the basin during this period.
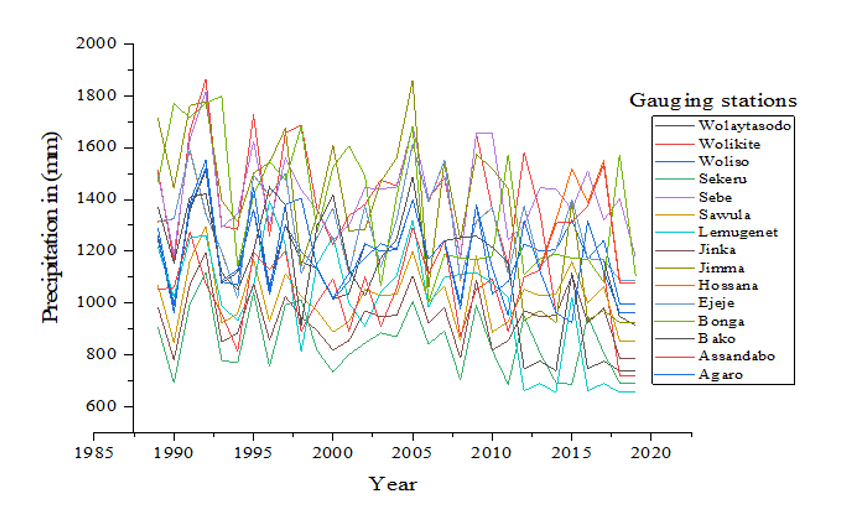
Figure 6: Changes in Observed Annual Percipttation Trends in the Omo-Gbe River Basin (1989-2019)
Monthly rainfall in the Omo-Gibe Basin shows clear seasonal patterns that reflect the region's climate. The wet season extends from June to September, with rainfall peaking in July and August, primarily under the influence of the Intertropical Convergence Zone (ITCZ). This season accounts for most of the basin's annual precipitation, with monthly totals generally ranging from 100 to 300 mm. In contrast, the dry season lasts from October to May, marked by very low rainfall, often below 50 mm per month, especially between November and February. A short pre-rainy period may occur in March and April, driven by localized climatic effects. Additionally, precipitation across the basin is influenced by variations in topography, as shown in Figure 7.
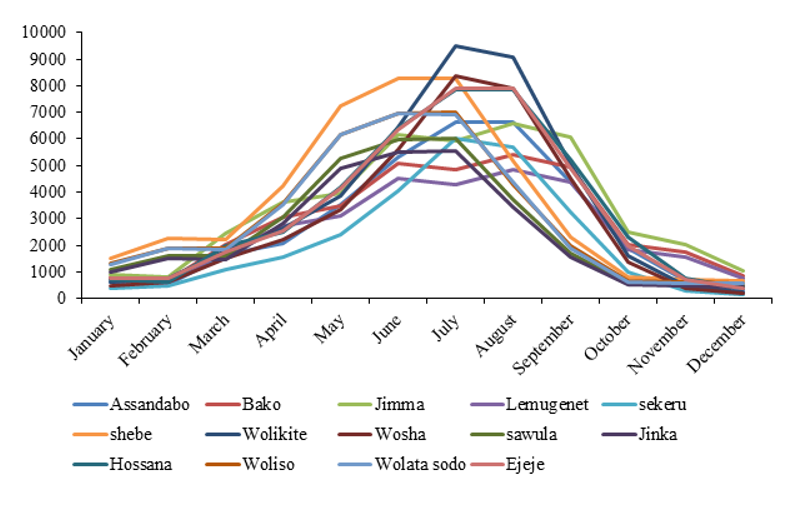
Figure 7: Monthly Observed Percipatation Trends (1987-2019)
A total of fifteen (15) precipitation measurement stations were used as the reference period to analyze seasonal changes in precipitation within the Omo-Gibe River Basin. Data from eleven (11) meteorological stations indicated a clear downward trend, suggesting an alteration in the seasonal precipitation patterns. However, none of the four (4) stations highlighted in the trend detection test results (Figure 8) exhibited statistically significant monotonic trends in seasonal precipitation.
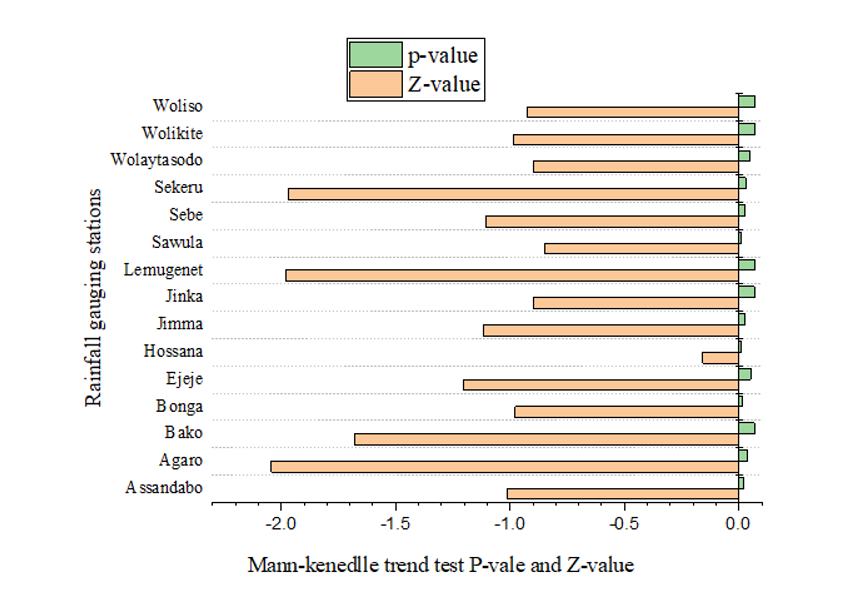
Figure 8: Mann-Kendall trend test results for Observed Seasonal Percipitation Changes in the Omo-Gibe River Basin over the period 1987-2019
The Implications of Temperature and Precipitation Change on Hydropower Infrastructures
Changes in temperature and precipitation significantly impact hydropower infrastructure, influencing its efficiency, reliability, and long-term sustainability. Rising global temperatures intensify the hydrological cycle, altering the timing and availability of water resources, while shifts in rainfall patterns create unpredictable water flows. Reduced inflows during dry periods can limit electricity generation, whereas extreme rainfall may overload reservoirs, threatening dam safety and downstream areas. Higher temperatures also increase evaporation, reduce storage efficiency, and exacerbate sedimentation, which can damage turbines and elevate maintenance costs. These interconnected climate and engineering challenges highlight the need for integrating climate resilience into hydropower design and operations to maintain sustainable and reliable energy production.
The following analysis quantifies the sensitivity of hydropower systems to climatic shifts. By applying fundamental thermodynamic and hydraulic principles, we evaluate how changes in temperature and precipitation translate into measurable operational losses and infrastructural stress.
Quantitative Impact of Precipitation on Power Generation
The fundamental relationship between precipitation which dictates flow rate (Q) and power output (P) is governed by the hydraulic power equation:
The fundamental relationship between precipitation which dictates flow rate (Q) and power output (P) is governed by the hydraulic power equation:
Where:
• 𝜂 = Efficiency (typically 0.85 to 0.90) • p = Water density (1000 kg/m³) • g = Gravity (9.81 m/s²) • Q = Flow rate (m³/s) • H = Hydraulic head (m)
A 10% decrease in annual precipitation does not merely result in a 10% loss in power. Due to the relationship between storage and head, a decrease in Q typically leads to a lower reservoir level, which simultaneously reduces H. This results in a compounded 12–15% drop in annual energy generation (GWh).
Thermal Sensitivity of Electrical Components
Infrastructure lifespan is critically sensitive to heat. For every 10 °C increase in operating temperature above the design limit, the chemical properties of transformer and generator insulation degrade twice as fast (the "10-degree rule").
Generator & Transformer Efficiency
As ambient temperatures rise, the electrical resistance (R) of copper windings increases according to:
The fundamental relationship between precipitation which dictates flow rate (Q) and power output (P) is governed by the hydraulic power equation:
With α ᵙ 0.00393/°C for copper, a 5°C increase in ambient temperature results in a 1.96% increase in resistive (I2R) losses within the generator, directly lowering net plant efficiency.
Transmission Line Derating
Higher temperatures increase conductor "sag," reducing safe current-carrying capacity (ampacity). Data indicates that for every 1°C rise in ambient temperature, the maximum power transfer capacity of a transmission line decreases by approximately 0.5% to 1.0%.
Evaporative Water Loss and Storage Efficiency
Higher temperatures increase the vapor pressure deficit, accelerating reservoir evaporation. Using the Penman equation for open-water evaporation, we can quantify the volumetric loss of "potential energy."
- Tropical Sensitivity: A 2°C increase in mean temperature can result in an additional 100–150 mm of annual evaporative loss.
- Volumetric Evidence: For a medium-sized reservoir (100 km2) this equates to a loss of 10–15 million m³ of water potential energy that is lost to the atmosphere before reaching the turbines.
| Component | Variable | Threshold/Sensitivity | Estimated Resulting Impact |
|---|---|---|---|
| Power Output | Discharge (Q) | -10% Flow | ~10% Reduction in GWh |
| Generators | Ambient Temp | +1°C | +0.4% Resistive Loss |
| Reservoirs | Temperature | +2°C | 5-12% Increase in Evaporative Loss |
| Transmission | Air Temp | +10°C | 7-10% Drop in Capacity |
Table 2: Summary of Quantified Implications
| Hydropower Infrastructures/Component | Implications of Changes in Temperature | Implications of Changes in Precipitation | References |
|---|---|---|---|
| Dams | Higher temperatures can affect water evaporation rates, reducing water volume. | Decreased precipitation can lead to reduced water inflow and lower dam capacity. | [19] |
| Warmer water may affect sediment transport and deposition in the dam | Increased precipitation may lead to higher inflows, requiring adjustments in spillway design. | [20] | |
| Reservoirs | Higher temperatures may result in increased evaporation, reducing water storage. | Variations in rainfall can significantly alter water levels, affecting storage capacity. | [21] |
| Water temperature changes can affect the stratification and mixing of water layers. | Increased rainfall may cause sedimentation, reducing storage efficiency. | [22] | |
| Powerhouses | Increased temperatures can affect cooling systems, reducing efficiency. | Reduced water flow can decrease turbine capacity, leading to lower power output. | [23-24] |
| Heat stress may cause mechanical issues with equipment and maintenance delays. | Excessive precipitation may cause flooding, damaging machinery or disrupting operations. | [25] | |
| Turbines | High water temperature can affect turbine efficiency and corrosion. | Lower water levels reduce the pressure and flow available to turbines, lowering output. | [26] |
| Potential increase in biofouling due to warmer water, impacting turbine function. | Higher precipitation may cause turbulence, increasing wear and tear on turbines. | [27] | |
| Generators | Higher ambient temperatures may lead to overheating, reducing efficiency and lifespan. | Lower water flow due to drought may reduce the capacity of generators. | [28] |
| Warmer water temperatures can impact cooling processes. | Excessive rainfall or floods can damage electrical components and infrastructure. | [29] | |
| Penstocks | Temperature changes may affect the material properties of penstocks, leading to deformation or wear | Reduced water availability reduces pressure in penstocks, limiting flow capacity. | [30] |
| Higher temperatures may lead to more frequent maintenance needs. | Increased rainfall can increase flow rates, potentially putting more stress on penstocks | [31] | |
| Spillways | Temperature fluctuations can cause changes in water density, affecting discharge behavior. | Excessive rainfall can lead to overflow, requiring spillway redesign for greater capacity | [24] |
| Reduced water volume due to higher temperatures may require more frequent adjustments to manage flow. | Lower precipitation leads to less water flow, which could impact flood management capabilities. | [32] | |
| Transmission Lines | High temperatures can increase resistance in transmission lines, causing power losses. | Reduced hydropower generation due to lower water levels may cause energy shortages, affecting grid stability. | [33] |
| Heat stress may result in line sagging and require more frequent maintenance. | Increased rainfall may lead to flooding, disrupting transmission infrastructure. | [34] | |
| Substations | Overheating can affect the functioning of electrical equipment within substations. | Increased storm events can damage substations through flooding or debris. | [35] |
| Changes in load due to altered generation may require additional equipment to handle fluctuations. | Higher precipitation may require more robust flood protection measures for substations | [36] |
Table 3: Implications of Temperature and Precipitation Changes for Various Hydropower Infrastructures from the literature
CONCLUSION
This study presents a comprehensive assessment of temperature and precipitation trends in the Omo-Gibe River Basin over a 32-year period (1987–2019), highlighting significant climatic changes with important implications for hydropower infrastructure. The analysis reveals statistically significant increases in both maximum and minimum temperatures, with a notably higher rise in minimum temperatures, resulting in a reduced diurnal temperature range. Seasonal and spatial variations in temperature and precipitation are evident, with the basin characterized by a distinct wet season influenced primarily by the Intertropical Convergence Zone and an extended dry season. While the majority of meteorological stations recorded declining precipitation trends, a few stations showed no statistically significant changes, reflecting considerable localized variability within the basin. These shifts in climatic patterns rising temperatures coupled with declining or variable precipitation pose substantial challenges to hydropower infrastructure, including reduced water availability, increased reservoir evaporation, higher sedimentation rates, and additional thermal and operational stress on dams and associated mechanical systems. The findings emphasize that without proactive adaptation measures, the reliability and efficiency of hydropower generation in the Omo-Gibe Basin may be compromised. Therefore, the study underscores the urgent need for incorporating climate-resilient strategies into hydropower planning, design, and operational management. Such strategies could include optimizing reservoir operations, enhancing catchment management, upgrading infrastructure to withstand extreme hydrological events, and integrating climate projections into long-term energy planning. By adopting these measures, hydropower infrastructure can be better prepared to maintain sustainable energy production and mitigate risks posed by the ongoing and future impacts of climate change.
AUTHOR’S CONTRIBUTIONS STATEMENT
1. Gemechu Fufa Arfasa: Acquisition of data, Methodology, using software analysis and/or interpretation of data, formal analysis, research, data maintenance, drafting - re-reading, editing, visualization and approval of the version of the manuscript to be published.
2. Alemayehu Regassa Tolossa: Acquisition of data, Methodology, using software analysis and/or interpretation of data, formal analysis, research, data maintenance, drafting - re-reading, editing, visualization and approval of the version of the manuscript to be published.
3. Zewde Alemayehu Tilahun: Acquisition of data, Methodology, using software analysis and/or interpretation of data, formal analysis, research, data maintenance, drafting - re-reading, editing, visualization and approval of the version of the manuscript to be published.
4. Mebratu Dengia Kejela: Methodology, software, Formal analysis, Research, Data maintenance, drafting - re-reading, editing, Visualization and revising the manuscript critically for important intellectual content.
DECLARATION OF COMPETING INTEREST
The authors declare that they have no known competing financial interests or personal relationships that could have appeared to influence the work reported in this paper.
DATA AVAILABILITY
The data that has been used is confidential. Most of the data used in this research article are received from (https:// glovis.usgs.gov/app), NMAE (National Meteorology Agency of Ethiopia), Ministry of Water and energy of Ethiopia).
FUNDING
There is no special funding for this research.
REFERENCES
- Pachauri RK, Gomez-Echeverri L, Riahi K. Synthesis report. Climate Change 2014: Mitigation of Climate Change. IPCC Working Group III Contribution to AR5. 2014. [Crossref] [Google Scholar]
- Arfasa GF, Owusu-Sekyere E, Doke DA. Climate change projections and impacts on future temperature, precipitation, and stream flow in the Vea Catchment, Ghana. Environmental Challenges. 2024;14:100813. [Crossref] [Google Scholar]
- Arfasa GF, Sekyere EO, Doke DA. Temperature and precipitation trend analysis using the CMIP6 model in the Upper East region of Ghana. All Earth. 2024;36(1):1-4. [Crossref] [Google Scholar]
- Arfasa GF, Owusu-Sekyere E, Doke DA, Aygei Ampofo J. Impacts of climate and land use/cover changes on the sustainability of irrigation water in West Africa: A systematic review. All Earth. 2024;36(1):1-3. [Crossref] [Google Scholar]
- Hayelom B, Chen Y, Marsie Z, Negash M. Temperature and precipitation trend analysis over the last 30 years in Southern Tigray Regional State, Ethiopia. [Crossref] [Google Scholar]
- Almazroui M, Saeed F, Saeed S, Nazrul Islam M, Ismail M, Klutse NA, et al. Projected Change in Temperature and Precipitation Over Africa from CMIP6. Earth Systems and Environment. 2020;4(3):455-75. [Crossref] [Google Scholar]
- Frimpong BF, Koranteng A, Molkenthin F. Analysis of temperature variability utilising Mann–Kendall and Sen's slope estimator tests in the Accra and Kumasi Metropolises in Ghana. Environmental Systems Research. 2022;11(1):24. [Crossref] [Google Scholar]
- Faquseh H, Grossi G. The effect of climate change on groundwater resources availability: a case study in the city of Brescia, northern Italy. Sustainable Water Resources Management. 2023;9(4):113. [Crossref] [Google Scholar]
- Egigu ML. Techniques of filling missing values of daily and monthly rain fall data: a review. SF J Environ Earth Sci. 2020;3(1):1036. [Crossref] [Google Scholar] [PubMed]
- Ozelkan E, Bagis S, Ozelkan EC, Ustundag BB, Yucel M, Ormeci C. Spatial interpolation of climatic variables using land surface temperature and modified inverse distance weighting. International Journal of Remote Sensing. 2015;36(4):1000-25. [Crossref] [Google Scholar]
- Tronci N, Molteni F, Bozzini M. A comparison of local approximation methods for the analysis of meteorological data. Archives for meteorology, geophysics, and bioclimatology, Series B. 1986;36(2):189-211. [Crossref] [Google Scholar]
- Mudelsee M. Trend analysis of climate time series: A review of methods. Earth-science reviews. 2019;190:310-22. [Crossref] [Google Scholar]
- Faquseh H, Grossi G. Trend analysis of precipitation, temperature and snow water equivalent in Lombardy region, northern Italy. Sustainable water resources management. 2024;10(1):18. [Crossref] [Google Scholar]
- Yozgatligil C, Aslan S, Iyigun C, Batmaz I. Comparison of missing value imputation methods in time series: the case of Turkish meteorological data. Theoretical and applied climatology. 2013;112(1):143-67. [Crossref] [Google Scholar]
- Patakamuri SK (2019). O’Brien. modifiedmk: Modified Mann-Kendall Trend Tests.
- Yang K. Patterns and trends of frontal activity in Australian marine hotspots. [Crossref] [Google Scholar]
- Hamed KH. Trend detection in hydrologic data: The Mann–Kendall trend test under the scaling hypothesis. Journal of hydrology. 2008;349(3-4):350-63. [Crossref] [Google Scholar]
- Jiqin H, Gelata FT, Chaka Gemeda S. Application of MK trend and test of Sen's slope estimator to measure impact of climate change on the adoption of conservation agriculture in Ethiopia. Journal of Water and Climate Change. 2023;14(3):977-88. [Crossref] [Google Scholar]
- Kędra M, Wiejaczka Ł. Climatic and dam-induced impacts on river water temperature: Assessment and management implications. Science of the Total Environment. 2018 ;626:1474-83. [Crossref] [Google Scholar]
- Mukheibir P. Potential consequences of projected climate change impacts on hydroelectricity generation. Climatic Change. 2013;121(1):67-78. [Crossref] [Google Scholar]
- Sathyamurthy R. Combined sensible heat and nano-enhanced latent heat energy storage for solar thermal evaporation: an experimental approach. Journal of Thermal Analysis and Calorimetry. 2024;149(16):8771-85. [Crossref] [Google Scholar]
- Yu PS, Yang TC, Kuo CM, Chou JC, Tseng HW. Climate change impacts on reservoir inflows and subsequent hydroelectric power generation for cascaded hydropower plants. Hydrological Sciences Journal. 2014;59(6):1196-212. [Crossref] [Google Scholar]
- Raymondi RR, Cuhaciyan JE, Glick P, Capalbo SM, Houston LL, Shafer SL, Grah O. Water resources: Implications of changes in temperature and precipitation. InClimate Change in the Northwest: implications for our landscapes, waters, and communities 2013. Washington, DC: Island Press/Center for Resource Economics. [Crossref] [Google Scholar]
- Vicuña S, Leonardson R, Hanemann MW, Dale LL, Dracup JA. Climate change impacts on high elevation hydropower generation in California’s Sierra Nevada: a case study in the Upper American River. Climatic Change. 2008;87(Suppl 1):123-37. [Crossref] [Google Scholar]
- Blackshear B, Crocker T, Drucker E, Filoon J, Knelman J, Skiles M. Hydropower vulnerability and climate change. InA Framework for Modeling the Future of Global Hydroelectric Resources, Middlebury College Environmental Studies Senior Seminar, Fall 2011. Middlebury, VT, USA: Middlebury College. [Google Scholar]
- Machina MB, Sharma S. Assessment of climate change impact on hydropower generation: a case study of Nigeria. Int J Eng Technol Sci Res. 2017 Aug 19;4(8). [Google Scholar]
- Wei L, Jiheng L, Junhong G, Zhe B, Lingbo F, Baodeng H. The effect of precipitation on hydropower generation capacity: a perspective of climate change. Frontiers in Earth Science. 2020;8:268. [Crossref] [Google Scholar]
- Kotrbáček P, Chabičovský M, Kominek J, Resl O, Bellerova H. Influence of water temperature on spray cooling at high surface temperatures. Applied Thermal Engineering. 2022;216:119074. [Crossref] [Google Scholar]
- Ibrahim NA, Alwi SR, Manan ZA, Mustaffa AA, Termizi SN, Kidam K. Potential impact of climate change on hydropower system in Malaysia. Chemical Engineering Transactions. 2023;106:169-74. [Google Scholar]
- Çalamak M. Investigation of waterhammer problems in the penstocks of small hydropower plants (Master's thesis, Middle East Technical University (Turkey)). [Google Scholar]
- Kopytkovskiy M, Geza M, McCray JE. Climate-change impacts on water resources and hydropower potential in the Upper Colorado River Basin. Journal of Hydrology: Regional Studies. 2015;3:473-93. [Crossref] [Google Scholar]
- Kabo-Bah AT, Diji CJ, Nokoe K, Mulugetta Y, Obeng-Ofori D, Akpoti K. Multiyear rainfall and temperature trends in the Volta river basin and their potential impact on hydropower generation in Ghana. Climate. 2016;4(4):49. [Crossref] [Google Scholar]
- Koch H, VöGELE ST, Hattermann FF, Huang S. The impact of climate change and variability on the generation of electrical power. [Crossref] [Google Scholar]
- Burillo D. Effects of Climate Change in. Power System Stability. 2019:7. [Crossref] [Google Scholar]
- Chowdhury AK, Dang TD, Bagchi A, Galelli S. Expected benefits of Laos’ hydropower development curbed by hydroclimatic variability and limited transmission capacity: Opportunities to reform. Journal of water resources planning and management. 2020 ;146(10):05020019. [Crossref] [Google Scholar]

Article Processing Timeline
| 2-5 Days | Initial Quality & Plagiarism Check |
| 25-35 Days |
Peer Review Feedback |
| 45-60 Days | Total article processing time |
EDITORIAL & PUBLICATION INFORMATION
| English | Publication Language |
| Single-Blind | Peer-Review Model |
| 17% | Acceptance Rate |
| <18% | Similarity Screening Guideline |
| Open Access | Access Model |
All manuscripts undergo editorial assessment and originality screening as part of the journal's evaluation process. The acceptance rate shown is based on journal-level editorial data and may change over time. Similarity reports are assessed editorially and are not interpreted solely on the basis of a numerical similarity score.
Why Publish with us?
Ethics & Policies
Editorial & Management
Useful Links
Journal Highlights
Open Access Journals
Journal Flyer