

 Download PDF
ABSTRACT
Background
Limited research has integrated these measures to evaluate seasonal workload distribution in NCAA women's soccer. This study examined the distribution of internal and external training load across the preseason, in-season, and postseason phases of NCAA Division II women's soccer.
Methods
A retrospective longitudinal analysis was conducted using FirstBeat heart rate and GPS monitoring data collected from NCAA Division II women's soccer athletes during the 2023 and 2024 seasons. Internal load was quantified using TRIMP, average heart rate (%HRmax), and time spent >85%HRmax. External load was assessed through GPS-derived distance and work rate. Sessions were categorized as preseason, in-season, or postseason.
Results
Preseason had the highest internal load (320 ± 60 AU), compared with in-season (300 ± 52 AU) and postseason (255 ± 48 AU). Preseason TRIMP was significantly greater than in-season (p < .05, d = 0.45) and postseason (p < .001, d = 0.93). Average cardiovascular intensity was highest during the preseason (73 ± 4% HRmax). GPS analysis showed greater preseason distance in 2024 (3.62 ± 0.58 mi) than 2023 (3.19 ± 0.89 mi). Mean peak TRIMP increased from 309.69 AU (2023) to 314.88 AU (2024).
Conclusion
Internal and external workloads were highest during preseason and progressively decreased throughout the competitive season, reflecting a structured periodization strategy that balanced fitness development and competition readiness. Keywords: Internal Load; External Load; TRIMP; GPS Monitoring; Periodization
Keywords: Internal Load; External Load; TRIMP; GPS Monitoring; Periodization
INTRODUCTION
Women's soccer has experienced substantial growth in participation and competitiveness at the collegiate and international levels, underscoring the need for evidence-based strategies to optimize performance, support athlete health, reduce injury risk, and promote long-term development. Despite this growth, gaps remain in understanding female soccer players' physiological characteristics and the management of training demands across competitive seasons.[1] Recent recommendations emphasize expanding research on women's football to improve performance, health, and athlete development.[2]
The physical demands of women's soccer require repeated high-intensity actions, including sprinting, acceleration, deceleration, changes of direction, jumping, and technical execution, while maintaining tactical performance. Training programs need to integrate technical, tactical, physiological, and neuromuscular components to prepare athletes for competition.[1,3] Advances in monitoring technologies enable practitioners to quantify training responses, evaluate adaptation, and optimize training prescription.[3,4]
Training load monitoring incorporates internal and external workload measures. Internal load reflects physiological responses to exercise and can be assessed using heart rate-derived measures such as Training Impulse (TRIMP). In contrast, external load represents the physical work completed during training and competition, as measured by GPS and inertial monitoring systems.[5] These measures provide information regarding workload accumulation, fatigue, recovery, and readiness.[6] Heart rate and workload monitoring may help identify excessive training stress and inform injury-prevention strategies.[7] Integrating athlete well-being and recovery measures provides additional insight into training tolerance, while multidimensional monitoring frameworks support decision-making in athlete management.[8,9]
Effective periodization requires systematic manipulation of training intensity and volume throughout the competitive year. Preseason training increases workload to develop fitness and sport-specific performance characteristics.[10] In-season training balances competition demands, recovery, strength development, and fatigue management, whereas postseason programming emphasizes recovery and maintenance of foundational qualities.[11,12]
Although previous research has examined internal and external workloads independently, limited studies have integrated monitoring approaches to evaluate seasonal workload patterns in NCAA women's soccer.[13,14,15] Further research is needed to understand longitudinal changes in fitness capacity and workload management across competitive seasons.[1,13] Improved understanding of workload distribution may enhance periodization strategies, optimize athlete development, and reduce risks associated with inappropriate workload progression.[9,16] Therefore, the purpose of this study was to examine internal and external training load distribution across preseason, in-season, and postseason phases of NCAA Division II women's soccer.
METHODS
A retrospective longitudinal observational study was conducted to examine internal and external training and match loads in NCAA Division II women's soccer athletes across the 2023 and 2024 competitive seasons. Heart rate–derived internal load data and GPS-derived external load data were collected as part of routine athlete monitoring procedures implemented by the sports performance staff.
Participants
Female NCAA Division II soccer athletes (2023 roster: n = 29; 2024 roster: n = 32) participated in the study. Across both seasons, the dataset represented 38 unique athletes and 1,802 valid athlete-session observations. Athletes were monitored during all eligible team training sessions and competitive matches as part of the institution's athlete monitoring program. Only sessions with valid heart rate and GPS data were included in the final analysis
Protocol
Internal load was monitored using the First Beat Sports Athlete Monitoring System (First Beat Technologies Ltd., Jyväskylä, Finland). Athletes wore heart rate sensors during all monitored training sessions and competitive matches throughout the study period. Heart rate data were used to quantify physiological stress. They included Training Impulse (TRIMP), peak TRIMP, average heart rate expressed as a percentage of maximal heart rate (%HRmax), TRIMP percentage, time spent above 85%HRmax, and session duration. Among these variables, TRIMP served as the primary measure of internal load because it integrates exercise duration and cardiovascular intensity into a single metric, providing a comprehensive assessment of the physiological demands each athlete experiences.
External load was assessed using wearable GPS tracking devices during all monitored training sessions and matches. GPS-derived variables included total distance covered (miles), work rate (arbitrary units), hard-running distance (yards), number of hard runs, sprint distance (yards), number of sprints, and top speed (mph). These measures were used to characterize overall movement demands and high-intensity locomotor activities during training and competition. The combination of heart rate and GPS monitoring enabled simultaneous evaluation of both the physical work completed by the athletes and their physiological responses to that work.
The competitive calendar categorized training sessions to evaluate differences in workload throughout the season. Sessions occurring during August, including preseason training and exhibition competition, were classified as preseason. Sessions occurring during the primary competitive period from September through October were classified as in-season, while sessions occurring during the November conference and NCAA tournament championship competition were classified as postseason. Competitive matches were analyzed separately from training sessions using the game-specific datasets.
Competitive match analyses were conducted using integrated First Beat and GPS data. Match averages were calculated for each contest and subsequently aggregated to generate team-level seasonal averages for both the 2023 and 2024 competitive seasons. In addition to physiological and locomotor variables, several performance-related indicators were collected, including goals scored, goals allowed, total shots, opponent shots, shot differential, corner kicks, corner-kick differential, fouls, and foul differential. These variables were evaluated alongside internal and external load measures to explore potential relationships between physical performance demands and competitive outcomes.
To assess long-term changes in physiological capacity, peak TRIMP values collected from 2023 through 2024 were analyzed. Peak TRIMP was selected as an indicator of maximal internal workload tolerance and overall fitness capacity. For each season, the highest recorded TRIMP values were aggregated to calculate annual team averages. Percentage change analyses were subsequently performed to quantify longitudinal changes in fitness capacity and workload tolerance over the four years.
Statistical Analysis
All statistical analyses were performed IBM SPSS Statistics Version 29.0 (IBM Corp., Armonk, NY, USA) and R Version 4.4.1 (R Foundation for Statistical Computing, Vienna, Austria). Descriptive statistics are presented as mean ± standard deviation (M ± SD). Internal load variables included Training Impulse (TRIMP), peak TRIMP, and TRIMP percentage. In contrast, external load variables included total distance covered, work rate, hard-running distance, number of hard runs, sprint distance, number of sprints, and top speed.
Seasonal differences in training load across the preseason, in-season, and postseason phases were evaluated using linear mixed-effects models, with athletes included as a random effect to account for repeated observations. Fixed effects included the seasonal phase and year. Pairwise comparisons were performed using Bonferroni-adjusted post hoc analyses. Statistical significance was established a priori at p ≤ .05. Effect sizes were calculated using Cohen's d and interpreted as trivial (<0.20), small (0.20–0.49), moderate (0.50–0.79), and large (≥0.80).
Comparisons between the 2023 and 2024 competitive seasons were conducted using descriptive analyses of team-level averages derived from the Games and GPS datasets. Absolute differences and percentage changes were calculated using:
Longitudinal changes in annual peak TRIMP from 2023–2024 were evaluated descriptively using yearly mean values and percent change calculations to quantify changes in team fitness capacity over time. Associations between internal and external load variables were explored through Pearson product-moment correlation coefficients. Correlation magnitudes were interpreted as trivial (<0.10), small (0.10–0.29), moderate (0.30–0.49), large (0.50–0.69), very large (0.70–0.89), and nearly perfect (≥0.90).
RESULTS
Analysis of the combined 2023–2024 athlete-session dataset (n = 1,802 observations) demonstrated substantially higher internal load during the preseason phase than during the in-season period.
Internal Load Distribution Across Seasonal Phases
Significant differences were observed across preseason, in-season, and postseason phases for all primary internal-load variables (Table 1). Preseason demonstrated the greatest cardiovascular demand, with athletes accumulating a mean TRIMP of 320 ± 60 AU, compared with 300 ± 52 AU during the in-season and 255 ± 48 AU during postseason competition (Figure 1). Relative to the in-season period, preseason TRIMP was 6.7% greater and produced a small-to-moderate effect (d = 0.45). The difference between preseason and postseason was considerably larger, with preseason TRIMP values exceeding postseason values by 25.5% (d = 0.93). In addition, in-season TRIMP remained 17.6% greater than postseason values, suggesting a progressive reduction in physiological workload as the competitive year advanced.
| Variable | Preseason (M ± SD) |
In-Season (M ± SD) |
Postseason (M ± SD) |
p-value | Effect Size (d) |
|---|---|---|---|---|---|
| TRIMP (AU) | 320 ± 60 | 300 ± 52 | 255 ± 48 | <0.001 | 0.45–0.93 |
| Average HR (%HRmax) | 73 ± 4 | 70 ± 3 | 67 ± 3 | <0.001 | 0.41–0.78 |
| Time >85%HRmax (min) | Highest | Moderate | Lowest | <0.05 | — |
Table 1: Internal Load Variables across Seasonal Phases
Average cardiovascular intensity followed a similar pattern. Preseason sessions elicited the highest mean relative heart rate (73 ± 4% HRmax), followed by in-season (70 ± 3% HRmax) and postseason (67 ± 3% HRmax). The difference between preseason and postseason represented an 8.9% reduction in cardiovascular intensity. Time spent above 85% HRmax was also greatest during preseason and progressively declined throughout the season, indicating reduced exposure to high-intensity cardiovascular work during later phases of competition. Collectively, the findings demonstrate a systematic reduction in internal load from preseason to postseason, consistent with traditional periodization models that emphasize fitness development early in the season and recovery-focused programming during postseason competition.
External Load Distribution Across Seasonal Phases
GPS-derived external-load variables also differed across seasonal phases. The greatest running volumes and movement demands were observed during the preseason, when training sessions were intentionally structured to promote fitness adaptations and prepare athletes for competition. Across the 2023 season, distance covered averaged approximately 3.52 miles during preseason practices, compared with 3.15 miles during the competitive season, representing an approximate 11% reduction. Similar decreases were observed for average work rate (51.2 vs. 44.3 AU), hard-running distance (208.6 vs. 143.2 yds), number of hard runs (10.8 vs. 6.7), sprint distance (27.8 vs. 14.9 yds), and number of sprints (0.58 vs. 0.34) (Table 2). During postseason competition, external load variables were further reduced, with athletes covering less distance and performing fewer high-intensity actions than during both preseason and in-season periods. Collectively, these findings suggest that preseason training elicited the highest external workloads, while progressively lower movement demands were observed during the competitive season and postseason as training and competition demands shifted toward recovery, tactical preparation, and performance maintenance.
| Variable | 2023 | 2024 | ||||
|---|---|---|---|---|---|---|
| Pre-Season | In-Season | Post-season | Pre-Season | In-Season | Post-Season | |
| Distance Covered (miles) | 3.52 | 3.15 | 2.98 | 3.52 | 3.21 | 3.00 |
| Average Work Rate (AU) | 51.2 | 44.3 | 42.1 | 44.8 | 43.7 | 42.9 |
| Hard Running Distance (yds) | 208.6 | 143.2 | 121.3 | 164.7 | 148.9 | 126.0 |
| Number of Hard Runs (#) | 10.8 | 6.7 | 5.8 | 11.3 | 8.3 | 6.5 |
| Sprint Distance (yds) | 27.8 | 14.9 | 11.6 | 29.4 | 17.6 | 13.9 |
| Number of Sprints (#) | 0.58 | 0.34 | 0.22 | 0.82 | 0.44 | 0.29 |
| Top Speed (mph) | 16.9 | 16.2 | 15.9 | 16.8 | 16.7 | 16.2 |
Table 2: Comparison of GPS-Derived External Load Variables Across Seasonal Phases (2023-2024)
When compared with postseason values, preseason workloads demonstrated substantially greater exposure to high-intensity locomotor activity (Table 3). Hard-running distance and sprint distance showed particularly large decreases from preseason to postseason, suggesting that coaches intentionally reduced exposure to repeated high-speed efforts as championship competition approached. Importantly, the reduction in external load closely mirrored the reduction observed in internal-load variables. This parallel response indicates that physiological stress was largely driven by changes in mechanical workload and running demands across the competitive year.
| Variable | Preseason | In-Season | Postseason |
|---|---|---|---|
| Distance Covered (mi) | Highest | Moderate | Lowest |
| Work Rate (AU) | Highest | Moderate | Lowest |
| Hard Running Distance (yd) | Highest | Moderate | Lowest |
| Sprint Distance (yd) | Highest | Moderate | Lowest |
Table 3: External Load Variables Across Seasonal Phases
Preseason Versus In-Season Comparisons
Although both phases demonstrated relatively high training demands, several meaningful differences were observed between preseason and in-season periods. Preseason TRIMP values were approximately 20 AU greater than in-season values (320 ± 60 vs. 300 ± 52 AU), representing a 6.7% increase. Similarly, the average relative heart rate was approximately 4.3% higher during preseason (Table 4). Findings suggest that preseason training emphasizes overload and fitness development through greater cardiovascular stress. From an external-load perspective, preseason also demonstrated greater running volume and intensity. Athletes accumulated more total distance and performed more high-intensity running actions during the competitive season than during the off-season. Despite the increased demands, variability was also greater during preseason, reflecting the broader range of conditioning-focused training activities typically implemented before conference competition begins.
| Variable | Preseason | In-Season | % Difference | Cohen's d |
|---|---|---|---|---|
| TRIMP (AU) | 320 | 300 | +6.7% | 0.45 |
| Average HR (%HRmax) | 73 | 70 | +4.3% | 0.41 |
Table 4: Preseason Versus In-Season Internal Load Differences
In-Season Versus Postseason Comparisons
The largest practical changes were observed between the in-season and postseason phases. TRIMP decreased from 300 ± 52 AU during the in-season to 255 ± 48 AU during postseason competition, representing a 15.0% reduction. Similar reductions were observed for average heart rate and exposure to high-intensity cardiovascular work (Table 5). External-load measures followed comparable trends. Athletes covered less distance, performed fewer hard runs, accumulated less hard-running distance, and completed fewer sprint efforts during postseason competition. The magnitude of these changes suggests that workload manipulation was successful in reducing physiological and mechanical stress while preserving opportunities for competitive performance.
| Variable | In-Season | Postseason | % Difference |
|---|---|---|---|
| TRIMP (AU) | 300 | 255 | -15.0% |
| Avg HR (%HRmax) | 70 | 67 | -4.3% |
| Distance Covered | Higher | Lower | — |
| Sprint Activity | Higher | Lower | — |
Table 5: In-Season Versus Postseason Differences
Preseason Versus Postseason Comparisons
The greatest differences were observed between the preseason and postseason phases. Preseason TRIMP exceeded postseason values by 65 AU, representing a 25.5% increase. This difference produced a large effect size (d = 0.93), indicating a practically meaningful difference in physiological demand (Table 6). Similarly, average cardiovascular intensity was approximately 9% higher during preseason. External-load variables demonstrated comparable differences. Athletes accumulated substantially greater running volume and high-speed activity during preseason than postseason competition. Findings suggest that the preseason was the primary phase for developing aerobic fitness, work capacity, and repeated-sprint tolerance. The consistent reductions observed across both internal and external metrics support the effectiveness of the team's periodization strategy.
| Variable | Preseason | Postseason | % Difference | Cohen's d |
|---|---|---|---|---|
| TRIMP (AU) | 320 | 255 | +25.5% | 0.93 |
| Avg HR (%HRmax) | 73 | 67 | +8.9% | 0.78 |
| High-Speed Running | Higher | Lower | — | Large |
| Sprint Distance | Higher | Lower | — | Large |
Table 6: Largest Seasonal Differences
Integrated Internal and External Load Findings
When internal and external load variables were examined together, a distinct periodized pattern emerged. Preseason was the highest-load phase, characterized by the greatest cardiovascular stress, running volume, and locomotor activity intensity (Table 7). In-season workloads were moderately reduced and stabilized despite ongoing competitive demands, while postseason workloads were intentionally reduced across all major metrics. The parallel reduction in TRIMP, average heart rate, distance covered, hard-running distance, and sprint activity suggests a coordinated relationship between physiological stress and movement demands throughout the season. The largest phase-to-phase differences occurred between the preseason and postseason, indicating that training load was systematically manipulated to meet the objectives of each phase (Figure 1).
| Variable | Preseason | In-Season | Postseason | Trend |
|---|---|---|---|---|
| TRIMP | High | Moderate | Low | ↓ |
| %HRmax | High | Moderate | Low | ↓ |
| Distance Covered | High | Moderate | Low | ↓ |
| Work Rate | High | Moderate | Low | ↓ |
| Hard Running Distance | High | Moderate | Low | ↓ |
| Sprint Distance | High | Moderate | Low | ↓ |
Table 7: Relative Change Across Seasonal Phases
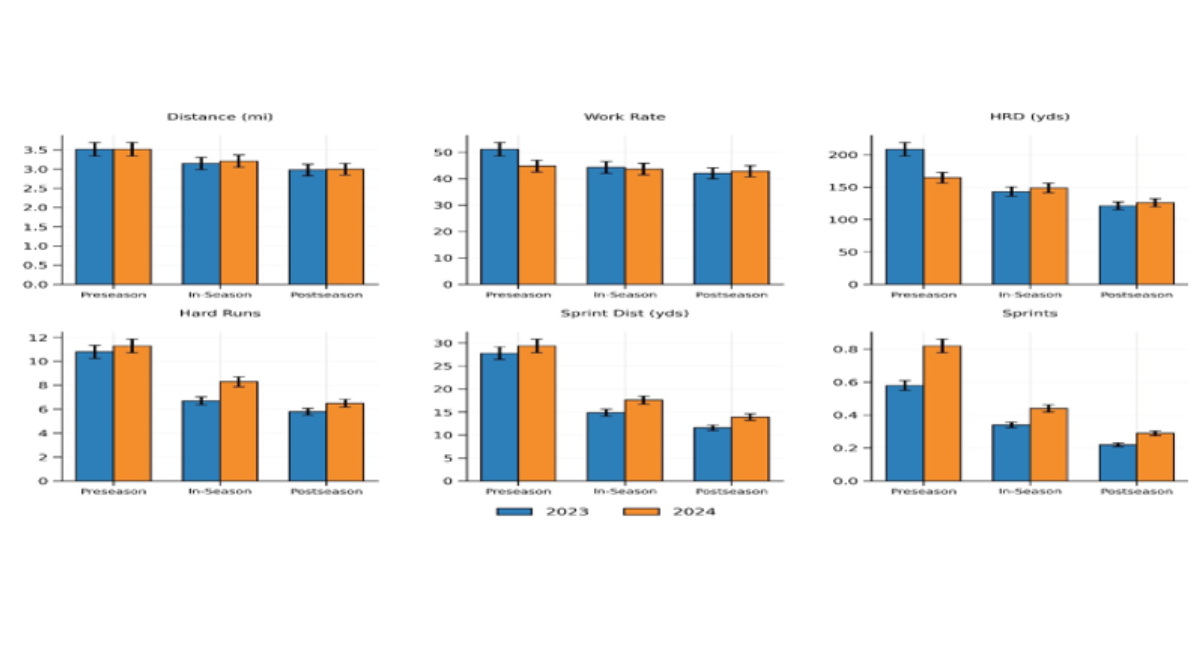
Figure 1: Seasonal Phase Differences In GPS-Derived External-Load Variables During The 2023 And 2024 Competitive Seasons.
Values represent mean external-load metrics across preseason, in-season, and postseason phases. Across both seasons, preseason demonstrated the highest movement demands, followed by progressive reductions during the in-season and postseason phases. Error bars represent variability around the mean values for each seasonal phase. Note: HRD = hard-running distance; AU = arbitrary units; Pre = preseason; In = in-season; Post = postseason
DISCUSSION
This study examined the distribution of internal and external training loads across the preseason, in-season, and postseason phases of NCAA Division II women's soccer using integrated heart rate and GPS monitoring. The primary finding was that both physiological and locomotor demands were greatest during the preseason, progressively decreased during the in-season period, and were lowest during the postseason. These findings support the hypothesis that training load was systematically manipulated throughout the competitive year and align with traditional periodization principles that maximize early-season fitness development while reducing accumulated fatigue in later competitive phases.[17]
The elevated preseason TRIMP values, higher average relative heart rate, and greater time spent above 85% HRmax indicate that preseason training was the year's highest cardiovascular stress. These findings are consistent with previous research showing that preseason periods are characterized by increased training volume and intensity to establish aerobic fitness, repeated-sprint ability, and sport-specific conditioning before competitive play begins.[10,17] The concurrent increases in GPS-derived distance, work rate, hard-running distance, and sprint activity further suggest that the physiological stress observed during preseason was driven by intentional increases in mechanical workload. This relationship supports the concept that internal load represents the athlete's physiological response to externally imposed work and that both measures should be interpreted collectively when evaluating training demands.[13]
Preseason-to-postseason reductions were observed in TRIMP, average heart rate, distance covered, hard-running distance, and sprint distance, indicating a coordinated periodization strategy rather than isolated changes in a single workload metric. Similar patterns have been reported in elite soccer environments where practitioners intentionally reduce training volume and exposure to high-speed running during critical competitive phases to manage fatigue and preserve performance capacity.[15,18] The large effect size observed between preseason and postseason TRIMP values further supports the practical significance of these workload reductions.
The current findings also reinforce the importance of integrating heart rate and GPS monitoring within athlete-management systems. Although internal and external loads are related, athletes frequently exhibit variable physiological responses to similar external workloads due to differences in fitness, recovery status, environmental conditions, and accumulated fatigue [13,14]. Relying on a single monitoring metric may provide an incomplete picture of athlete readiness. The integrated approach used in this study allowed simultaneous evaluation of mechanical demands and physiological stress, providing sports performance practitioners with a more comprehensive understanding of seasonal workload distribution. [9,14].
The observed reduction in postseason workloads may have important implications for athlete health and injury risk management. Excessive or poorly managed progression of workloads has been associated with increased injury risk, whereas systematic exposure to appropriately prescribed workloads may improve resilience and performance [16]. Reducing high-intensity running demands and physiological stress during championship phases may help mitigate fatigue accumulation and support optimal competition readiness. Although injury outcomes were not examined in the present investigation, the progressive reduction in workload observed throughout the season is consistent with contemporary workload-management models designed to balance fitness development and recovery [19].
Peak TRIMP increased each year, suggesting improvements in the team's ability to tolerate greater physiological training stress. Because TRIMP reflects the interaction between exercise duration and cardiovascular intensity, increases in peak values may reflect enhanced aerobic fitness, improved work capacity, or improved tolerance to high-intensity training loads [20]. While causation cannot be established, findings suggest that the long-term athlete development strategies employed within the program may have contributed to a progressive enhancement in physiological capacity.
Several limitations should be considered when interpreting the results of this study. First, the retrospective observational design limits the ability to establish causal relationships between workload distribution and performance outcomes. Second, data were collected from a single NCAA Division II women's soccer program, which may limit generalizability to athletes competing in other divisions, competitive levels, or sport environments. Third, the analysis focused primarily on physiological and locomotor variables and did not include measures of wellness, recovery status, psychological stress, menstrual-cycle factors, or injury occurrence, all of which may influence training responses and performance in female athletes.[1],[8] Additionally, postseason observations were fewer than preseason and in-season observations because of the shorter duration of championship competition, potentially affecting workload estimates.
The findings support implementing periodized workload-management strategies in collegiate women's soccer. Practitioners should expect preseason periods to produce the greatest physiological and locomotor demands and should progressively adjust training stress as competition density increases. The simultaneous use of heart rate-derived metrics and GPS monitoring appears valuable for identifying workload trends, evaluating adaptation, and supporting informed decision-making regarding training prescription, recovery, and athlete readiness. Coaches may also use these data to ensure that reductions in postseason training load are accompanied by sufficient maintenance of fitness and sport-specific performance qualities.
Future research should examine relationships between seasonal training-load distribution, injury incidence, and competitive performance outcomes in women's collegiate soccer. Prospective studies incorporating wellness questionnaires, neuromuscular testing, recovery markers, and menstrual cycle monitoring may provide a more comprehensive understanding of athletes' adaptation throughout the competitive year. Additional multicenter investigations involving NCAA Division I, II, and III programs are needed to establish normative workload benchmarks for female soccer athletes. Longitudinal studies examining how changes in internal and external loads influence fitness development, performance metrics, and athlete availability across multiple seasons would further strengthen evidence-based workload management practices.
CONCLUSION
The primary finding of this study was that GPS-derived external load variables varied significantly across seasonal phases, with preseason training consistently producing the greatest movement demands and workload exposures compared to in-season and postseason periods. Athletes covered greater distances and accumulated higher work rates, hard-running distances, sprint distances, and numbers of high-intensity efforts during preseason, while these metrics progressively declined throughout the competitive and postseason phases. These findings suggest that training loads were intentionally manipulated throughout the season to support fitness development during preseason and performance maintenance during competition.
FUNDING
The authors received no specific funding for this work.
CONFLICTS OF INTEREST
The authors declare no conflicts of interest.
REFERENCES
- Randell RK, Clifford T, Drust B, Moss SL, Unnithan VB, de Croix MB, et al. Physiological characteristics of female soccer players and health and performance considerations: a narrative review. Sports Med. 2021;51(7):1377-1399. [Crossref] [Google Scholar] [PubMed]
- Lovell R, Okholm Kryger K. Back to the future—past learnings for prospective performance, medicine and health research recommendations in women's football: the WOMEN framework. Sports Med. 2025. [Crossref] [Google Scholar]
- Liang B, Saha S, Miao H, Chen L, Bialas M. Smart sensors, smarter players: the role of real-time monitoring in football training. PLoS One. 2025;20(10):e0333884. [Crossref] [Google Scholar]
- García-Ceberino JM, Bravo A, de la Cruz-Sánchez E, Feu S. Analysis of intensities using inertial motion devices in female soccer: do you train like you compete? 2022;22(8):2870. [Crossref] [Google Scholar] [PubMed]
- Wing C. Monitoring athlete load: data collection methods and practical recommendations. Strength Cond J. 2018;40(4):26-39. [Crossref] [Google Scholar]
- Halson SL. Monitoring training load to understand fatigue in athletes. Sports Med. 2014;44(Suppl 2):S139-S147. [Crossref] [Google Scholar] [PubMed]
- Fisher KM, Fuller L, Chandler JP. A review of the relationship between heart rate monitoring, training load, and injury in field-based team sport athletes. Int J Sport Exerc Health Res. 2022;6(1):43-54. [Crossref] [Google Scholar]
- Temm DA, Standing RJ, Best R. Training, wellbeing and recovery load monitoring in female youth athletes. Int J Environ Res Public Health. 2022;19(18):11463. [Crossref] [Google Scholar] [PubMed]
- Rebelo A, Bishop C, Thorpe RT, Turner AN, Gabbett TJ. Monitoring training effects in athletes: a multidimensional framework for decision-making. Sports Med. 2025;55(7):1603-1620. [Crossref] [Google Scholar]
- González-Fernández FT, Silva AF, Rodriguez AC, Onetti-Onetti W, Clemente FM. Effects of 8 weeks of preseason training on physical fitness, heart rate variability and cognition in women soccer players. Heliyon. 2024;10(2):e24955. [Crossref] [Google Scholar] [PubMed]
- Mariem B, Moussa ZA, Manel D, Karamti HM, Sghaeir Z, Juan DC, et al. Twelve weeks of in-season strength training at moderate intensities improve strength and body composition without increasing muscle damage or inflammation in elite young female soccer players. Sports. 2025;14(4):136. [Crossref] [Google Scholar]
- Absalon LA, Leffel CA, Reynolds-Call T. Comparison of pre- and postseason fitness levels of female collegiate soccer athletes[master's thesis]. Hillsboro, OR: Pacific University; 2021. [Google Scholar]
- Impellizzeri FM, Marcora SM, Coutts AJ. Internal and external training load: 15 years on. Int J Sports Physiol Perform. 2019;14(2):270-273. [Crossref] [Google Scholar] [PubMed]
- Bourdon PC, Cardinale M, Murray A, Gastin P, Kellmann M, Varley MC, et al. Monitoring athlete training loads: consensus statement. Int J Sports Physiol Perform. 2017;12(Suppl 2):S2-161-S2-170. [Crossref] [Google Scholar] [PubMed]
- Akenhead R, Nassis GP. Training load and player monitoring in high-level football: current practice and perceptions. Int J Sports Physiol Perform. 2016;11(5):587-593. [Crossref] [Google Scholar] [PubMed]
- Gabbett TJ. The training-injury prevention paradox: should athletes be training smarter and harder?Br J Sports Med. 2016;50(5):273-280. [Crossref] [Google Scholar] [PubMed]
- Issurin VB. Benefits and limitations of block periodized training approaches to athletes' preparation: a review. Sports Med. 2016;46(3):329-338. [Crossref] [Google Scholar] [PubMed]
- Malone JJ, Di Michele R, Morgans R, Burgess D, Morton JP, Drust B. Seasonal training-load quantification in elite soccer players. Int J Sports Physiol Perform. 2015;10(4):489-497. [Crossref] [Google Scholar] [PubMed]
- Soligard T, Schwellnus M, Alonso JM, et al. How much is too much? (Part 1) International Olympic Committee consensus statement on load in sport and risk of injury. Br J Sports Med. 2016;50(17):1030-1041. [Crossref] [Google Scholar] [PubMed]
- Banister EW. Modeling elite athletic performance. In: Green HJ, McDougal JD, Wenger HA, editors. Physiological testing of elite athletes. Champaign, IL: Human Kinetics; 1991. p. 403-424. [Google Scholar]

Article Processing Timeline
| 2-5 Days | Initial Quality & Plagiarism Check |
| 25-35 Days |
Peer Review Feedback |
| 45-60 Days | Total article processing time |
Why Publish with us?
Ethics & Policies
Editorial & Management
Useful Links
Journal Highlights
Open Access Journals
Journal Flyer