


Journal of Artificial Intelligence and Digital Health
ISSN:
3139-6267 (Online)
DOI Prefix (Crossref): 10.67238
 Download PDF
ABSTRACT
Background
Malignant lymphoma is a cancer originating in the lymphatic system and affecting various lymphatic tissues. With its increasing incidence, accurate reporting and analysis are becoming increasingly critical. The integration of artificial intelligence, particularly deep learning, has revolutionized cancer detection and prognosis. Automated histopathology image analysis using deep learning minimizes observer variability and reveals previously unnoticed features.
Methods
This research aims to enhance malignant lymphoma classification by improving model accuracy and image quality through preprocessing, autoencoders, and data augmentation. A convolutional neural network (CNN) was optimized using hyperparameter tuning for superior performance. The model was trained on a Kaggle dataset consisting of 3,740 PNG images (224x224x3), employing techniques such as histogram equalization, median filtering, and Gaussian filtering to enhance image quality and feature visibility.
Results
Autoencoders were used to refine the encoding and decoding processes, significantly improving classification accuracy. The optimal CNN model was trained for 100 epochs with a batch size of 32 and a learning rate of 0.001, achieving a training loss of 0.1884 and an accuracy of 99.2%. During validation, the model attained a loss of 0.4271 and an accuracy of 97.7%. On test data, the model achieved a loss of 0.3820 and an accuracy of 98%. Additionally, a web-based tool developed using Flask and Python demonstrated a classification probability match of 98.81%.
Conclusion
This study highlights the potential of CNN-based approaches to enhance lymphoma diagnosis accuracy and efficiency, thereby alleviating the workload on radiologists.
Keywords: Malignant Lymphoma; Deep Learning; Convolutional Neural Network; Image Preprocessing; Autoencoders
INTRODUCTION
Malignant lymphoma is a cancer that originates in the lymphatic system and plays a crucial role in the body's immune response. This cancer affects various parts of the body where lymphatic tissue is present, such as the lymph nodes, bone marrow, spleen, and thymus. Its incidence and prevalence have been increasing globally, posing significant challenges to public health and healthcare systems [1-3]. Malignant lymphoma accounts for approximately 50% of all malignant blood diseases, as lymphocytes undergo malignant transformation and form tumors [4]. Malignant lymphoma comprises a group of blood cancers that include Hodgkin's lymphoma and non-Hodgkin's lymphoma. Accurate diagnosis is crucial, and doctors employ various methods to increase precision [3].
Chronic lymphocytic leukemia/small lymphocytic lymphoma (CLL/SLL) and mantle cell lymphoma (MCL) are specific types of lymphoid neoplasms with distinct clinical and molecular subtypes [5]. Malignant lymphoma is a complex disease with diverse pathological morphologies and numerous classifications identified by the World Health Organization (WHO). With nearly 100 known types, chronic lymphocytic leukemia (CLL), follicular lymphoma (FL), and mantle cell lymphoma (MCL) stand out as the most representative forms. The etiology of this disease is multifaceted, making its diagnosis and treatment challenging. In 2015, an analysis of the prevalence of malignant tumors in China at the National Cancer Center revealed that malignant lymphoma has a mortality rate of 2.39 per 100,000 people, making it the 10th leading cause of death among all malignant tumors [5]. The identification of lymphoma types is crucial for effective clinical treatment and prognosis. The incidence of non-Hodgkin lymphoma (NHL), the most common form of malignant lymphoma, has been increasing worldwide. In the United States, the number of NHL cases increased by 60% between 1975 and 2015 due to a combination of environmental, lifestyle, and genetic factors, as well as improved diagnosis and surveillance [1]. A study examined treatment patterns and outcomes in more than 12,000 patients with malignant lymphoma from 14 countries and revealed variations in treatment approaches but similar overall survival rates [2]. Advancements in AI have revolutionized healthcare research by enabling the development of applications that assist in cancer detection and prognosis [6]. AI-driven deep learning-based diagnostic systems have been utilized to analyze histopathology images, providing automated and objective analysis that can reduce variability in cancer diagnosis.
LITERATURE REVIEW
The combination of digital microscopy and deep learning approaches has the potential to identify new morphological features and enhance the performance of histopathological interpretation [7]. One study introduced the Faster R-CNN algorithm for classifying normal patients and those with malignant lymphoma into four categories: acute lymphoblastic leukemia, chronic lymphocytic leukemia, follicular lymphoma, and mantle cell lymphoma. The model utilized a region of interest (ROI) convolutional layer, a VGG-16 model, a region proposal network (RPN) layer, and a classifier layer. It achieved 87.57% accuracy after training, but its performance was relatively low compared with that of the VGG-16 model, and it lacked image filtering techniques [3]. This research study aimed to improve the classification accuracy of malignant lymphoma images by considering spatial relationships. Features were extracted using a CNN from original RGB color space histopathological images. Classification models were subsequently built using CNNs, support vector machines (SVMs), and random forest (RF) algorithms based on these features. The study used classical classifiers instead of deep learning approaches and excluded certain preprocessing steps [8]. A method for classifying cancer subtypes in patients with malignant lymphoma that automatically detects tumor-specific features in large histopathological images known as whole slide images (WSIs). Researchers have developed a convolutional neural network (CNN) called MS-DA-MIL, which combines multiple-instance learning, domain adversarial learning, and multiscale learning frameworks to address practical challenges.
Using a dataset of 196 patients from various hospitals, the researchers achieved a significantly improved classification accuracy for MS-DA-MIL (0.871±0.028%), similar to that of pathologists. However, the small dataset size presented challenges and may have contributed to a slightly lower accuracy [8]. Another group of researchers applied data preprocessing and deep learning methods to classify lymphoma using the ResNet-50 network model, and they achieved an impressive 98.63% accuracy in classifying CLL, FL, and MCL lymphoma types [9-12].
However, distinguishing lymphomas with similar morphologies but different treatment regimens and prognoses remains challenging. To increase the credibility of the results, future studies should focus on classifying and recognizing additional types of lymphoma pathology images [4]. Artificial intelligence has significantly contributed to the progress of healthcare research. The accessibility of open-source healthcare data has inspired researchers to develop applications that assist in cancer detection and prognosis [13]. Recent diagnostic systems based on deep learning offer automated techniques for analyzing histopathology images, potentially decreasing variations in cancer diagnosis between different observers.
Additionally, digital microscopy enables the identification of characteristics that were previously unnoticed by humans. When combined with deep learning methods, this approach has the potential to identify new morphological features and enhance performance in interpreting histopathological data [14]. This research aimed to address the critical gaps observed in existing studies related to the classification of malignant lymphomas. This study advances the field by significantly improving the performance of classification models through the implementation of an autoencoder. autoencoder not only enhances model accuracy but also improves image quality, thereby contributing to more reliable diagnostic outcomes. Furthermore, the research enhances the diversity of the dataset by employing strategic data augmentation techniques. This augmentation process increases the quantity of data and enriches the dataset, improving the ability of the model to generalize across a broader spectrum of lymphoma variations. Concurrently, the study meticulously explored and optimized hyperparameters within the proposed convolutional neural network (CNN) model. This includes strategic adjustments to elements such as the training-test data split, batch size, dropout rates, and other parameters. The iterative refinement of these parameters ensures the development of an optimized model that excels in the nuanced task of lymphoma classification. The model effectively implemented in a real-world application to classify different types of malignant lymphoma. Using a web-based tool developed with Flask and Python, which was deployed on a local computer. A diverse range of evaluation metrics is utilized to gauge the effectiveness of the enhancements made, offering a solid foundation for comparing the proposed methodology to current state-of-the-art models. The process involves preprocessing the lymphoma image dataset using an autoencoder to enhance image quality and extract pertinent features, followed by training with the proposed CNN model. To assess the model's classification performance, various evaluation metrics, such as accuracy, precision, recall, F1 score, and area under the curve (AUC), were utilized. The subsequent sections of this paper will present a detailed account of the methods employed in the study, encompassing dataset preparation, image dataset preprocessing, data augmentation, autoencoding, model training, experimental results, and a comprehensive discussion.
METHODS AND MATERIALS
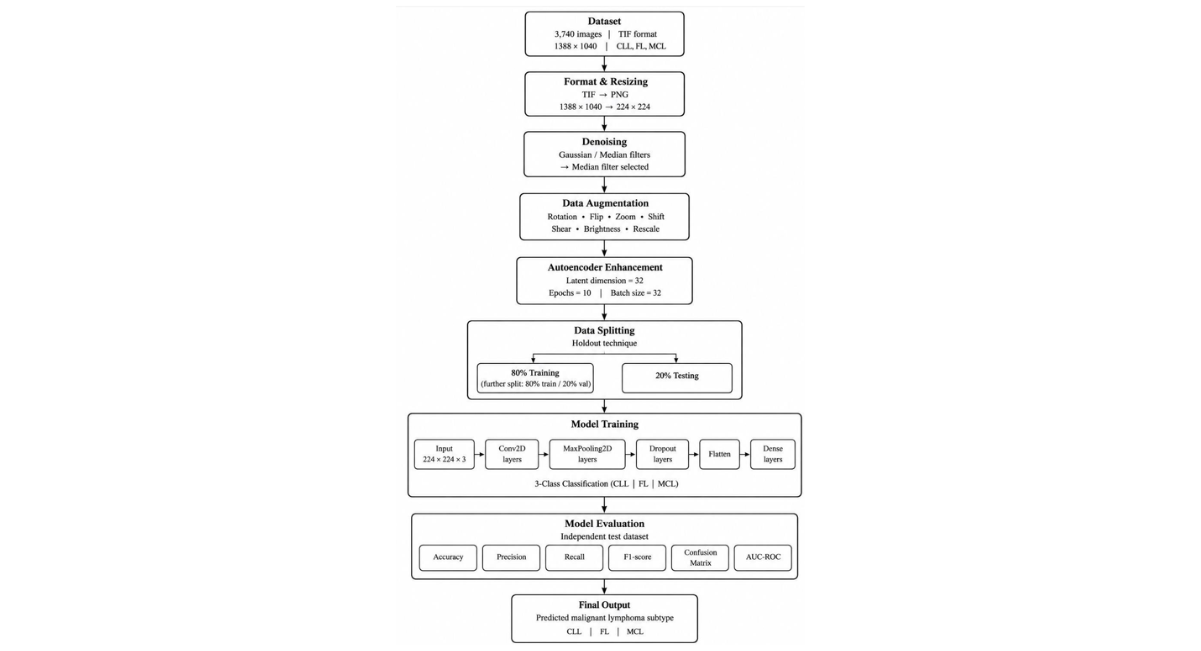
Figure 1: Workflow of The Proposed Methodology for Preprocessing, Enhancement, CNN-Based Classification, And Evaluation of Malignant Lymphoma Subtypes (CLL, FL, And MCL).
Dataset Preparation
The dataset comprises 3740 images of lymphatic cancer, initially in TIF format with a resolution of 1388× 1040 pixels. The dataset is available at here. After the images were converted to PNG format and resized to 224 × 224 pixels, data augmentation techniques were employed to expand the dataset to 3740 images. Subsequently, the data were divided into training, validation, and testing sets using the holdout technique, with 20% reserved for testing. The remaining data were further divided into an 80% training set and a 20% validation set within the training set. This process aims to enhance model generalizability and introduce diversity into the dataset.
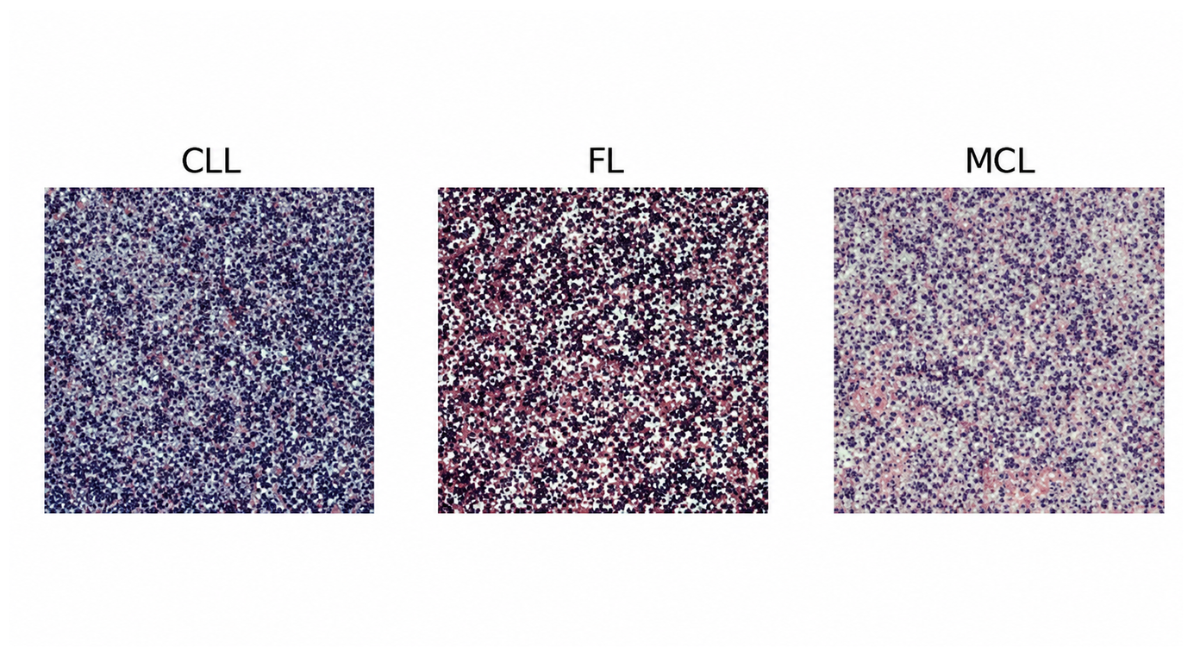
Figure 2: Sample of Data for Each Malignant Lymphatic Type, Source Dataset
Image Preprocessing
Denoising
Image denoising is a critical task in image processing, especially for medical images that are susceptible to noise [9]. Various denoising methods address different types of noise, including speckle, Gaussian, Rician, and salt and pepper noise. Gaussian filters and median filters are popular techniques for noise reduction, with the former blurring image regions and the latter removing impulse noise while preserving high-frequency details [10-11]. After the individual application of these filters, the overall system performance was assessed, as shown in TABLE1, and the median filter outperformed the others.
Data Augmentation
To address the limited training data and mitigate overfitting, utilized offline data augmentation techniques, including rotation, shifting, brightness adjustment, flipping, shearing, rescaling, flipping, filling, and zooming, using the Image Data Generator module. Samples of the augmented images are shown in Figure 3 below.
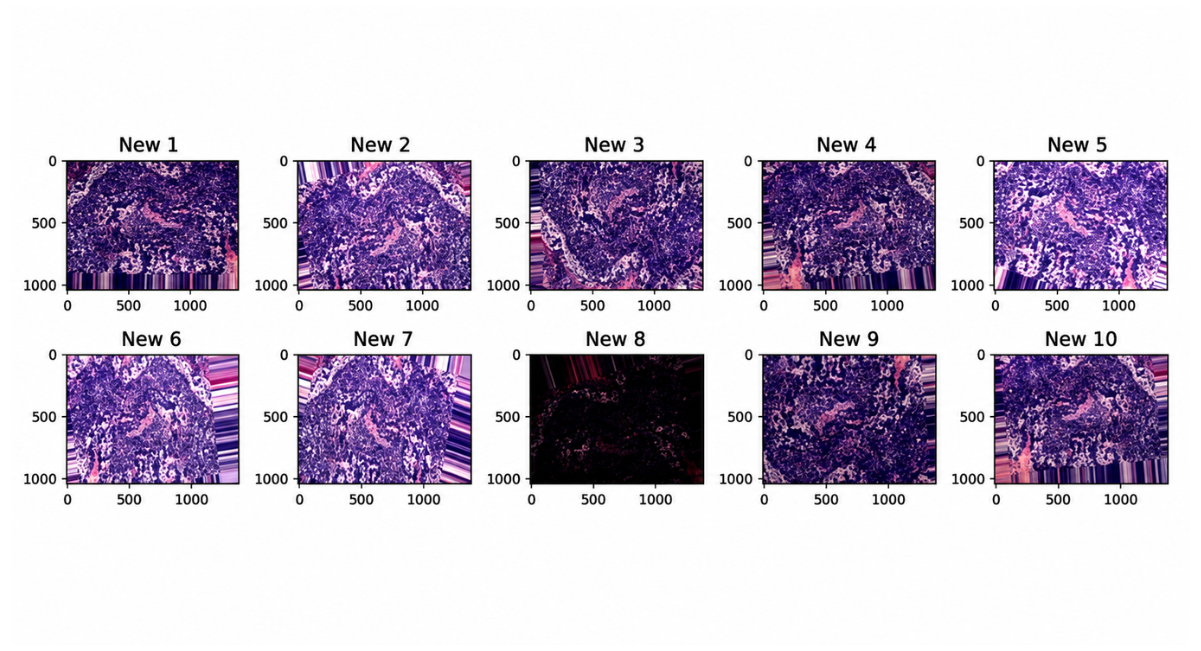
Figure 3: Sample Data from The FL Dataset Post Implementation of The Augmentation Techniques
Autoencoder
As filtering methods did not yield satisfactory improvements, the proposed more advanced image enhancement autoencoder techniques were applied by setting the dimensions of the latent space as latent dim = 32 with 10 epochs and a batch size of 32 for the encode-decode process. The process began by setting the image dimensions to 224 by 224 pixels. Following this, the images were reshaped into flat vectors. A latent dimension of 32 was then established. Subsequently, both an encoder and decoder were defined, leading to the creation of the autoencoder model. This model was compiled and trained appropriately. Upon completion of training, the images were reconstructed using the trained autoencoder. Finally, the reconstructed images were reshaped back to their original dimensions, thus bringing the process close.
Model training
After several attempts and experimental studies, the constructed an optimal model comprising multiple layers. FIGURE 4 illustrates the architecture of a study designed to train a model for classifying lymphoma from image data. The study begins with a dataset containing three classes of malignant lymphoma (CLL, FL, MCL). The images undergo preprocessing, including resizing, normalization, and filtering, to ensure they are suitable for model input. To address the limited dataset size, data augmentation techniques such as rotations, flips, zooms, and shifts are applied to increase the training dataset's diversity. The images are then encoded into a format compatible with the neural network for training. The model architecture consists of multiple layers: an input layer for 224x224x3 images, several Conv2D layers to detect relevant features, Max Pooling2D layers for down sampling, Dropout layers to prevent overfitting, a Flatten layer to convert 2D feature maps into a 1D vector, and Dense layers to produce the final classification into one of the three lymphoma types. After training, the model is evaluated using a separate test dataset, and the final output classifies the input images into the three categories of malignant lymphoma (CLL, FL, MCL). The model's performance was evaluated using various metrics, such as accuracy, precision, and recall, to assess its effectiveness in classifying malignant lymphoma.
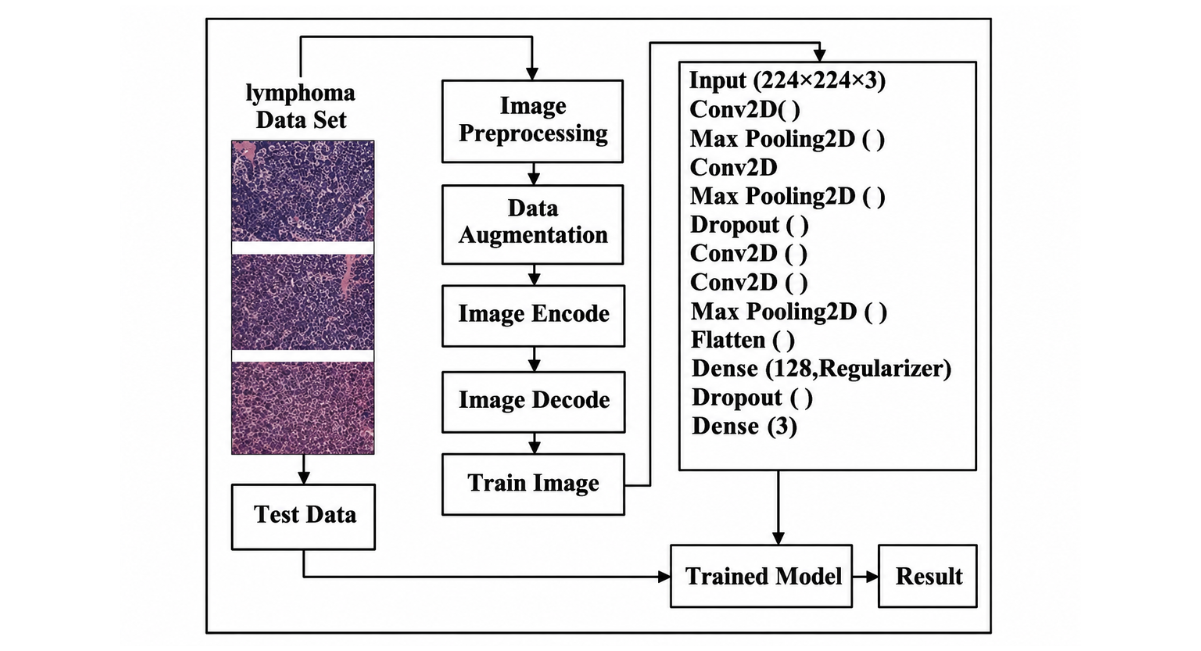
Figure 4:Illustrates the Architecture of The Study Design.
Performance Metrics
The performance assessment metrics for a model for predicting malignant lymphoma subtype can vary depending on the specific goals of the research. The following are some commonly used metrics [16-17].
Accuracy: Measures the overall correctness of the model, calculated as the ratio of correctly predicted instances to total instances.
Precision: Focuses on the accuracy of positive predictions, calculated as the ratio of correctly predicted positive observations to the total predicted positives.
Recall: Evaluates the model's ability to capture all relevant positive instances, calculated as the ratio of correctly predicted positives to all actual positives.
F1 Score: Provides a balance between precision and recall, calculated as the harmonic mean of both metrics.
Confusion Matrix: Offers a detailed performance breakdown, showing the counts of true positives, true negatives, false positives, and false negatives.
AUC-ROC Curve: Useful for binary classification, it plots the true positive rate against the false positive rate at various thresholds to assess model performance. These metrics, when combined, provide a comprehensive view of the model’s effectiveness in predicting malignant lymphoma subtype [16-17]. The formula given by:
where:
TP = True Positives, TN = True Negatives, FP= False Positives, FN= False Negatives
EXPERIMENTAL RESULTS AND DISCUSSION
Experimental Results for Filtering Methods
|
Name |
Filtering techniques |
Testing accuracy |
|
Experiment results after filtering preprocess |
Gaussian filter |
36% |
|
Histogram equalization |
40% |
|
|
Median filter |
45.33% |
Table 1: Performance of The Model After Using Various Filtering Methods
Experimental Results for Parameters
A comprehensive experiment was conducted to determine the optimal parameters. TABLE 2 presents an overview of comparisons for a select set of parameters.
|
Name |
Hyperparameters name |
Hyperparameters value |
Testing accuracy |
|
Experiment results for hyperparameters |
Train-test split |
80:20:00 |
61.95% |
|
70:30:00 |
52% |
||
|
Batch size |
28 |
48% |
|
|
32 |
61.95% |
Table 2: Proposed Model Accuracy Results for Various Parameters
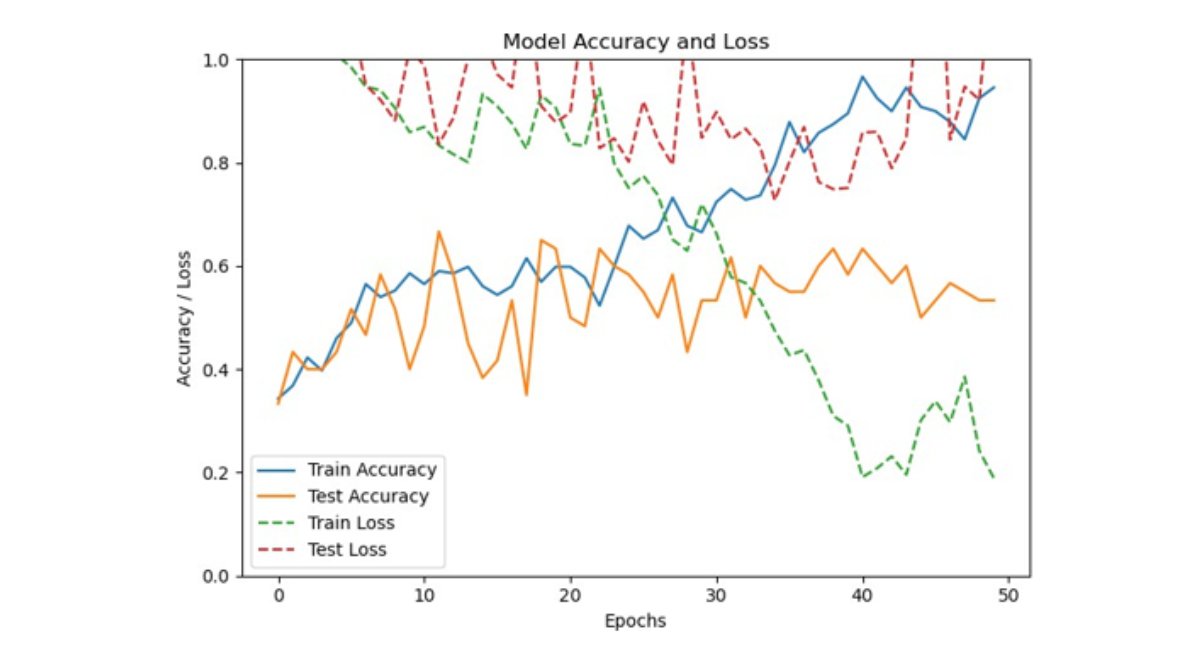
Figure 5: Graph Illustrating Model Accuracy and Loss After 50 Epochs and Before Preprocessing Techniques
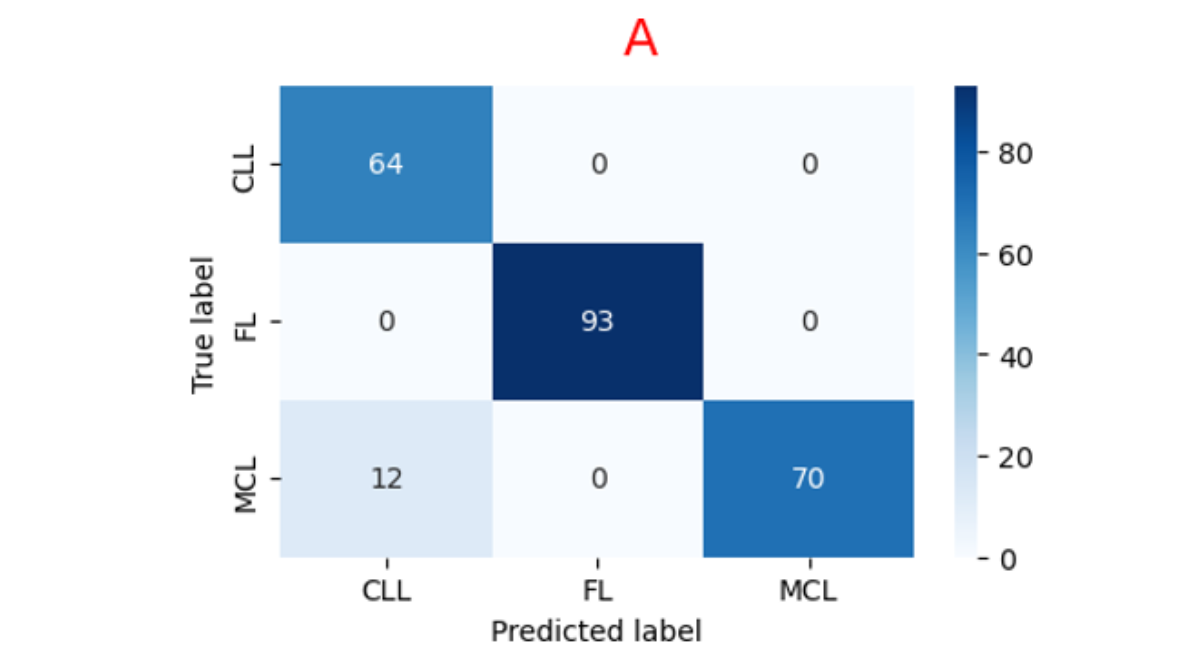
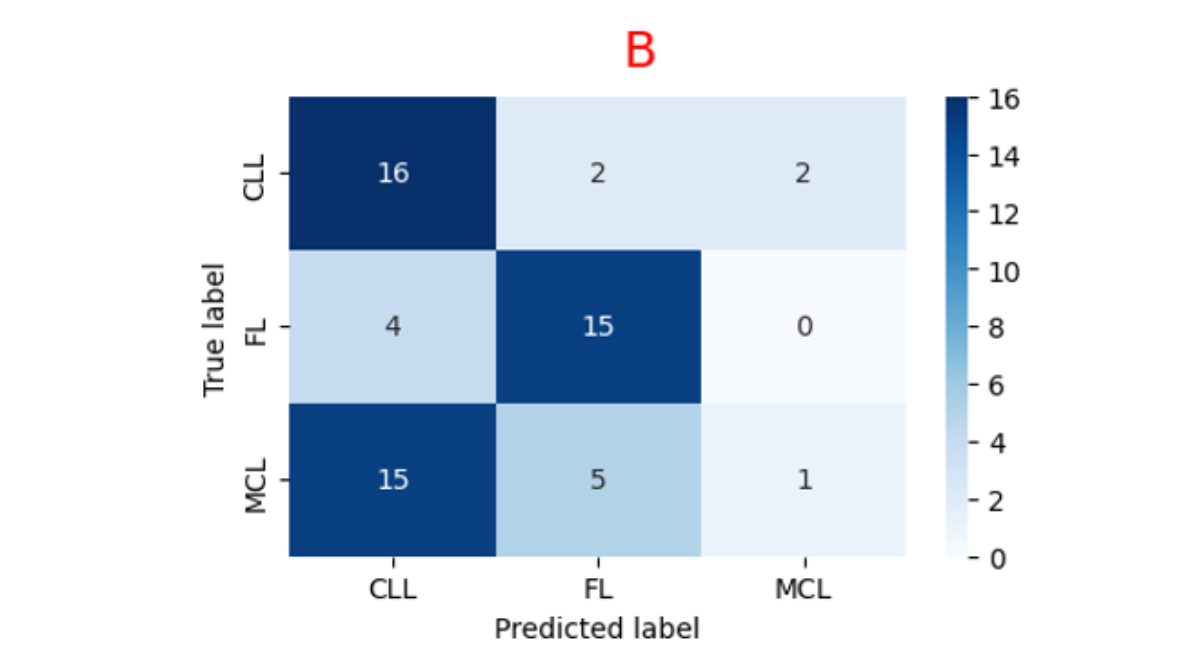
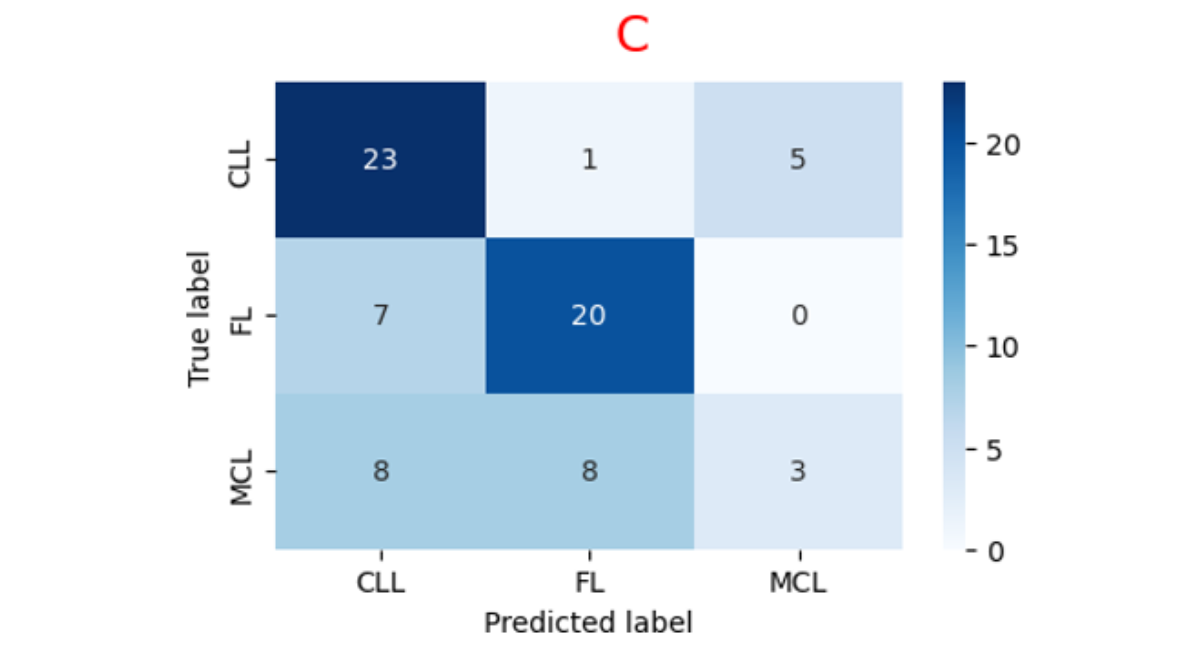
Figure 6: Illustrates the Confusion Matrices Corresponding to The Training Set (A), Validation Set (B), And Testing Set (C).
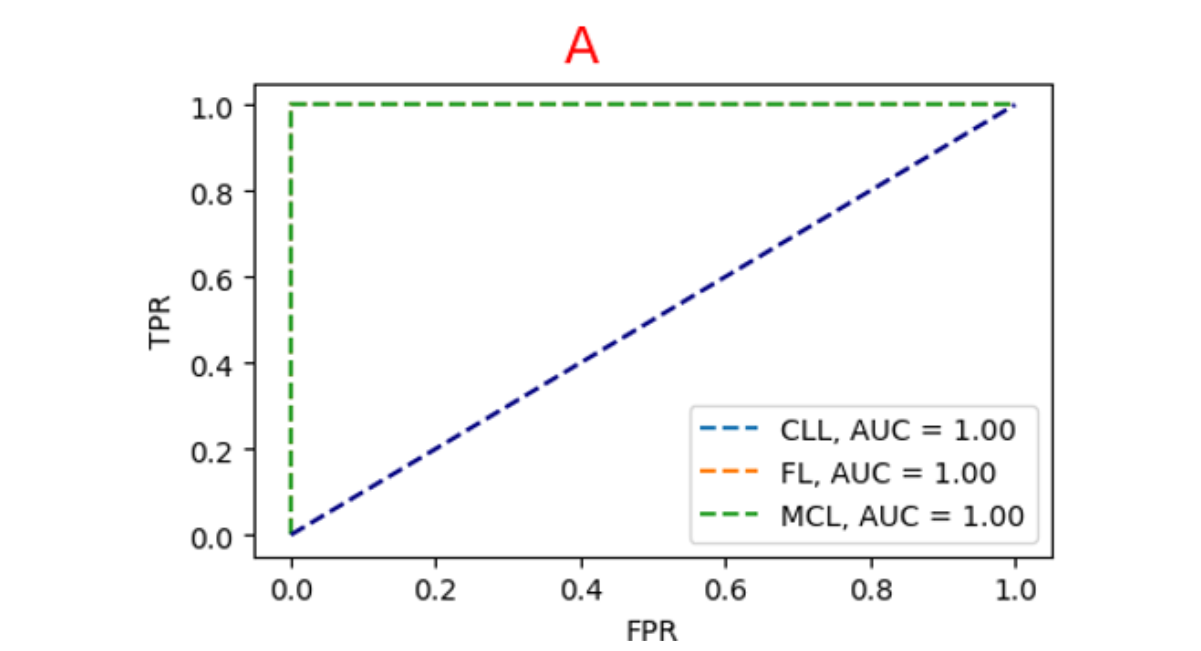
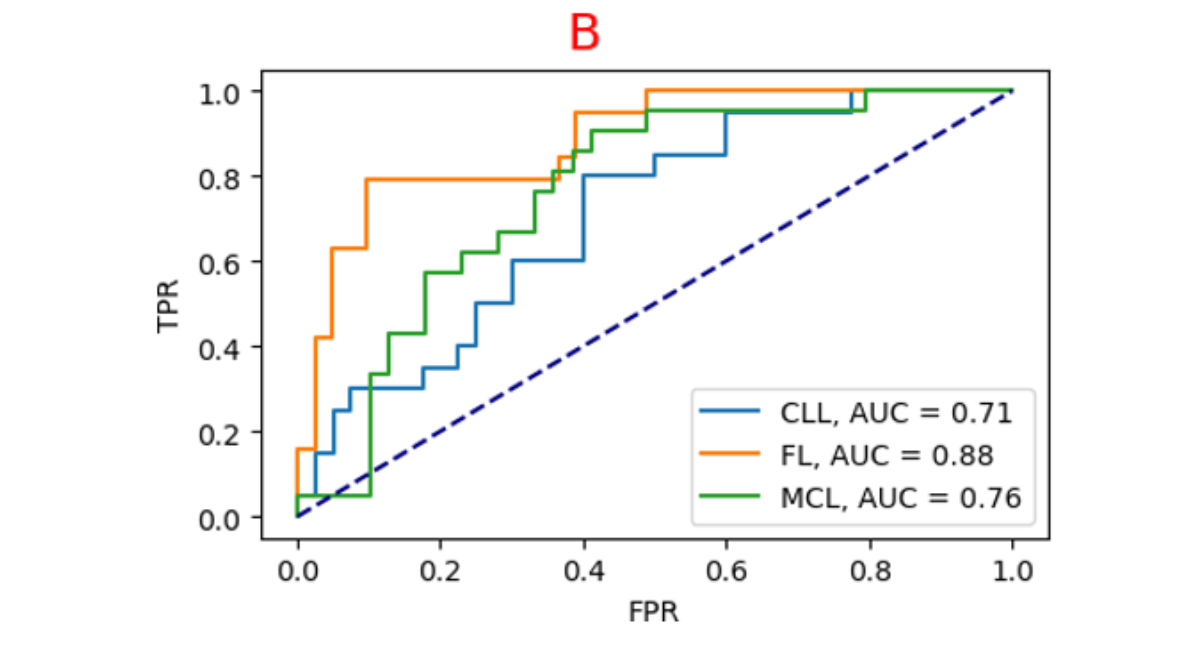
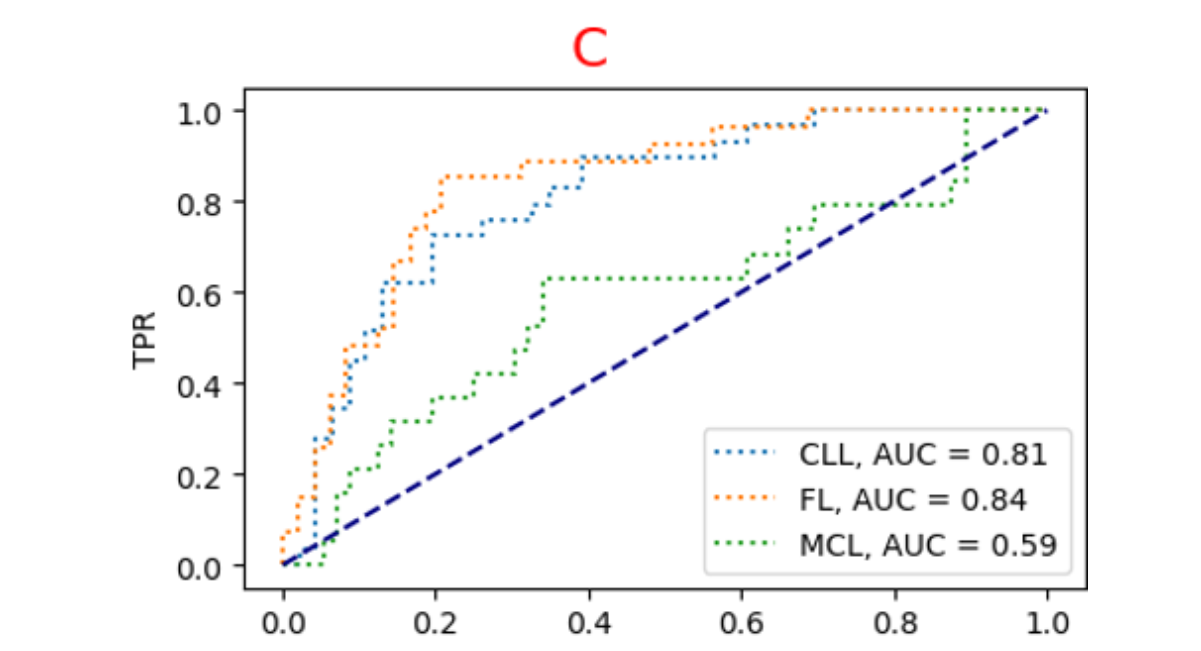
Figure 7: Illustrates The AUC-ROC Curves Across Different Sets: The Training Set (A), Validation Set (B), And Testing Set (C).
Model Detail Experimental Result after Preprocessing Techniques
The proposed model was determined to be the most ideal model after 100 epochs for the classification of lymphoma following the autoencoder, as illustrated in Table 3.
|
Proposed Model |
Loss |
Accuracy |
|
Training |
0.1884 |
99.20% |
|
Validation |
0.4271 |
97.70% |
|
Test |
0.382 |
98% |
Table 3: Experimental Results for The Model After Preprocessing Techniques
Accuracy and Loss Graph, Confusion Matrices and Auc Roc Curve of The Model After Preprocessing Techniques
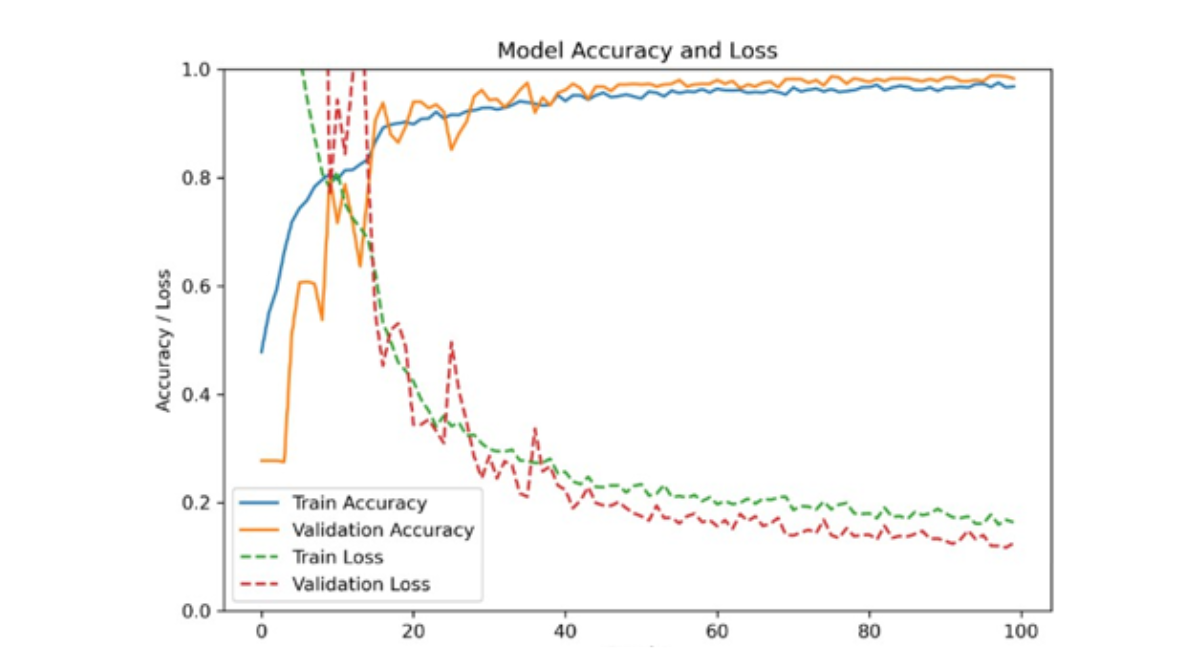
Figure 8: Graph Illustrating Model Accuracy and Loss After Image Preprocessing With 100 Epochs
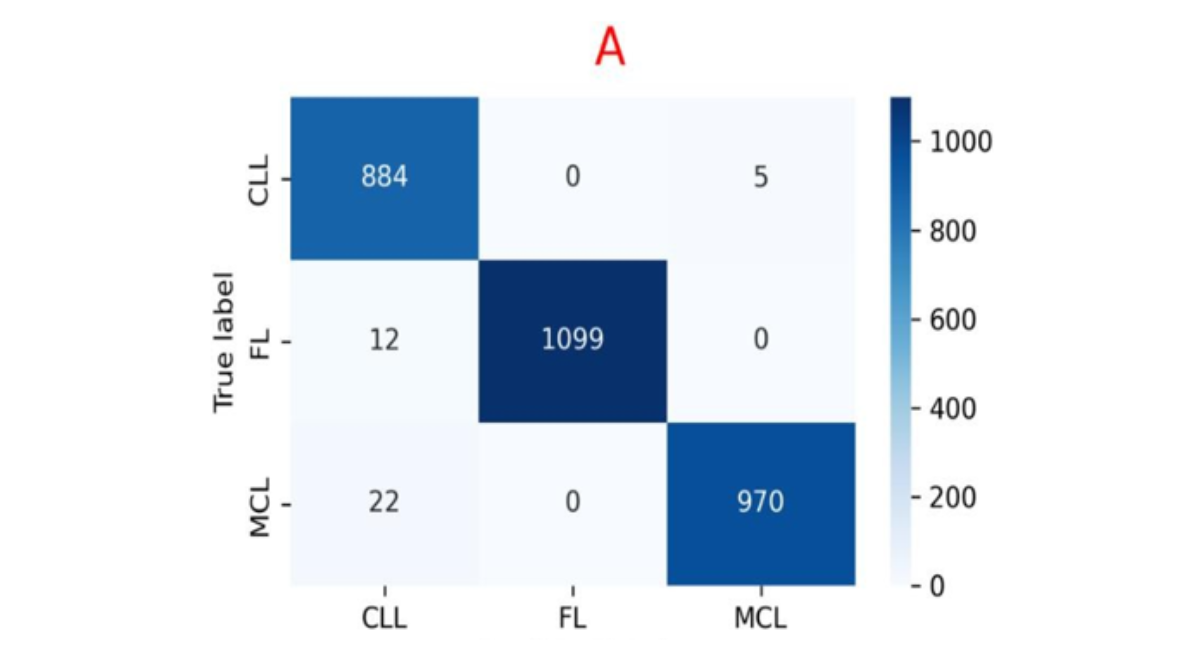
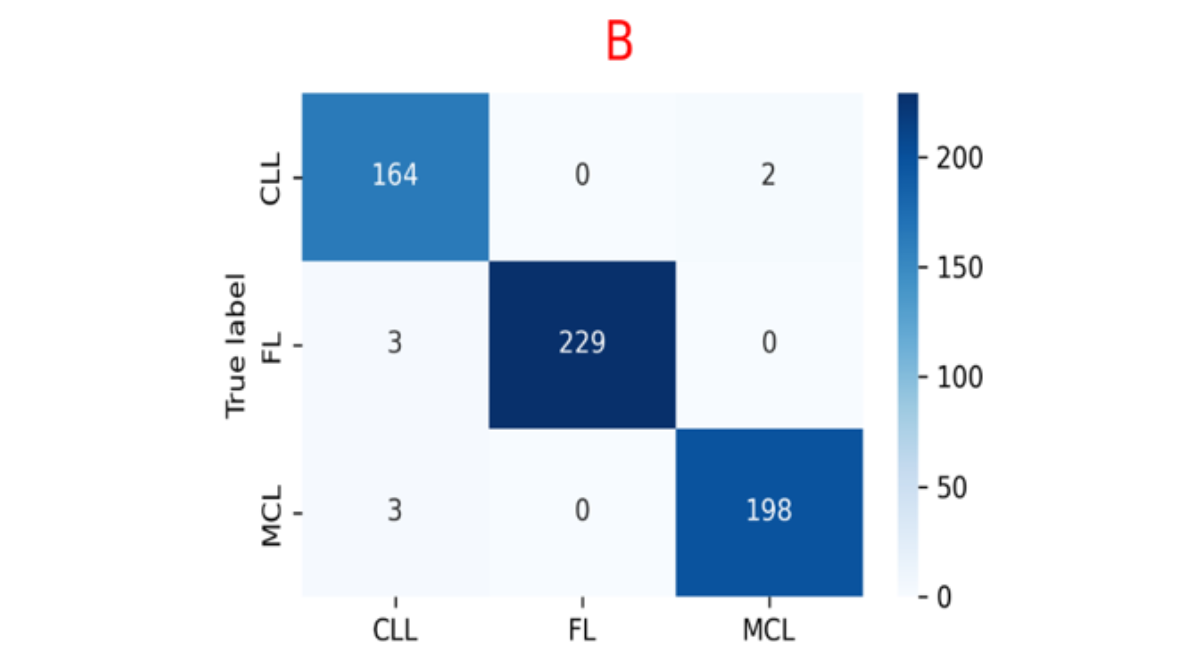
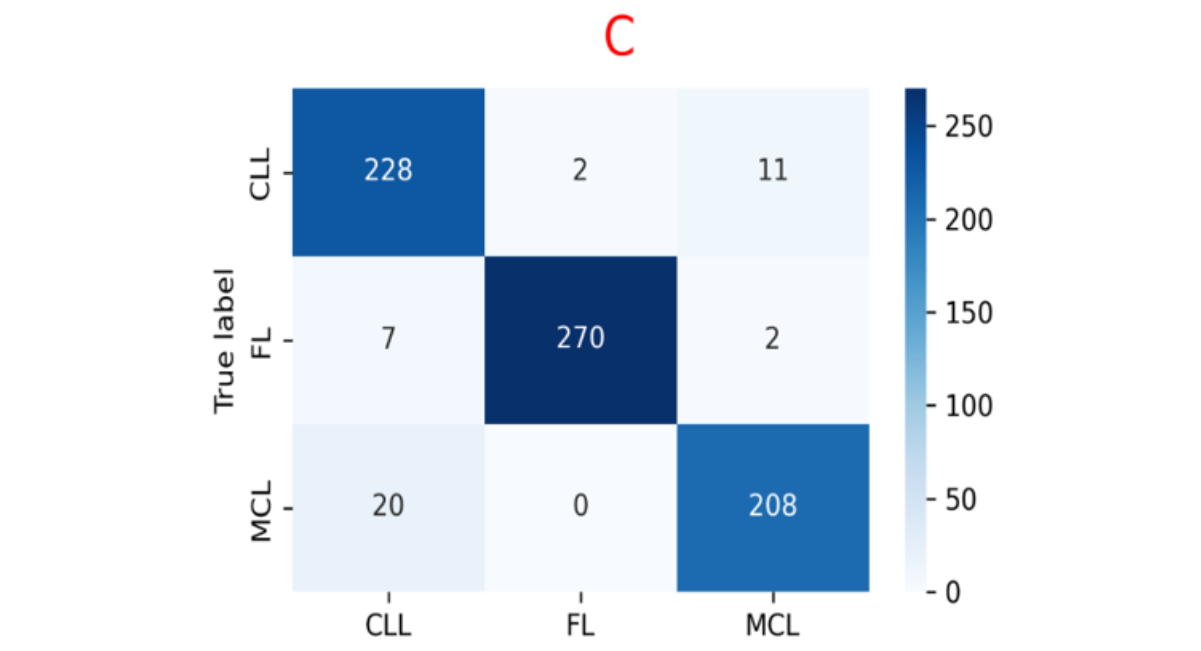
Figure 9: Illustrates the Confusion Matrices Corresponding to The Training Set (A), Validation Set (B), And Testing Set (C).
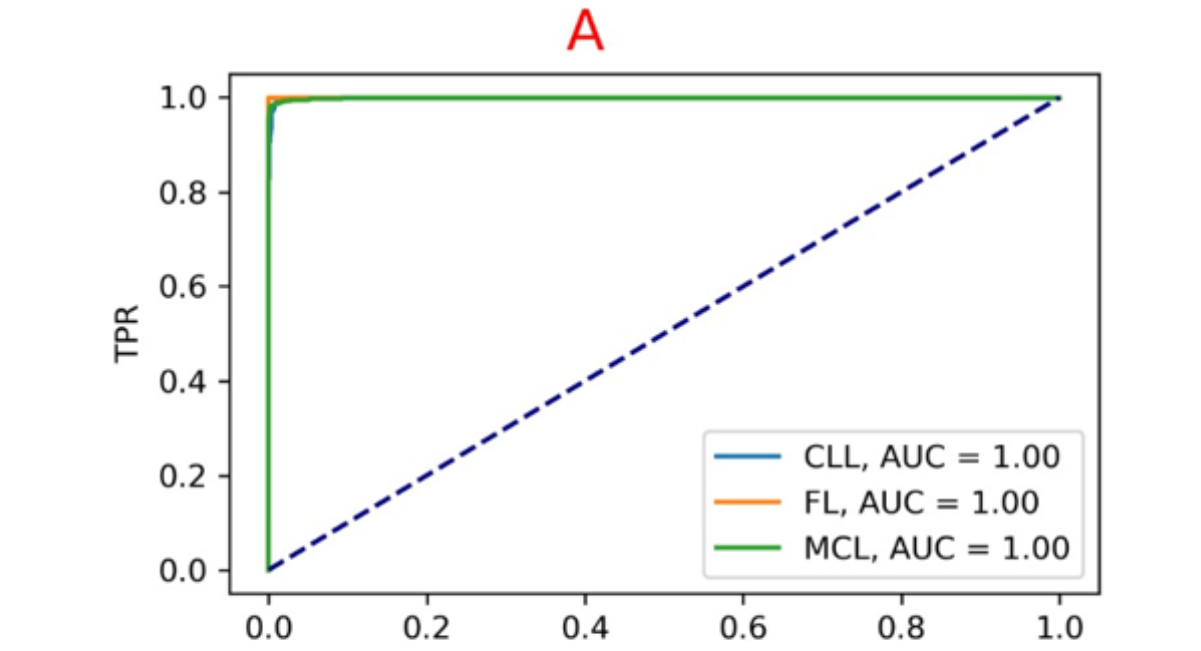
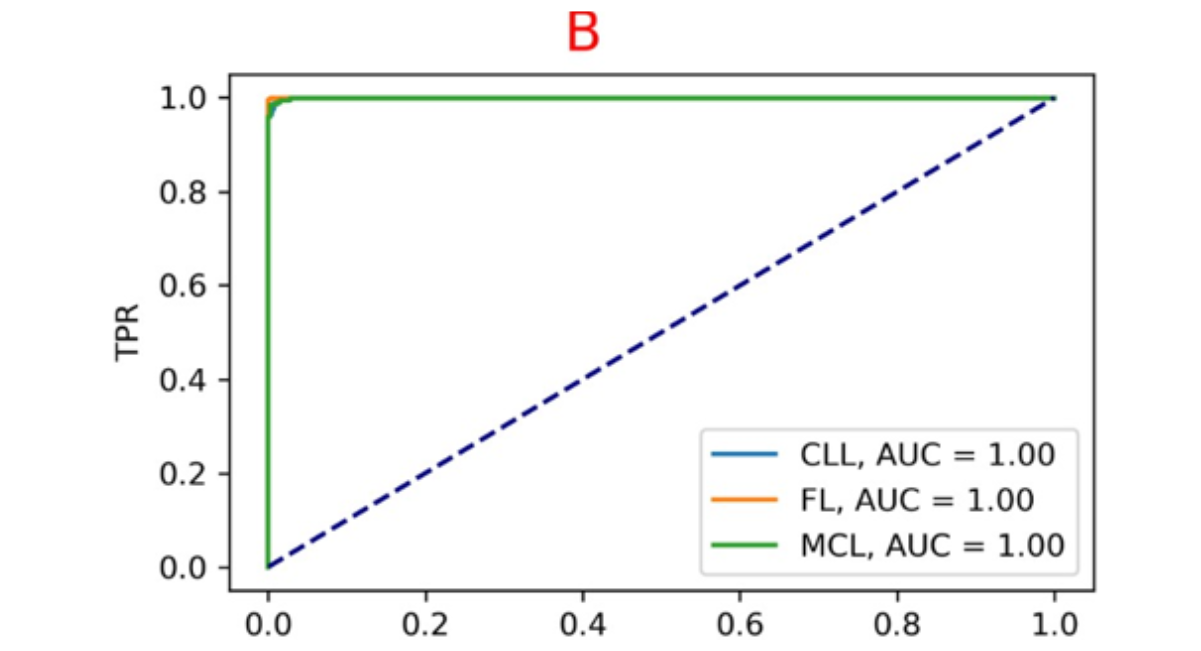
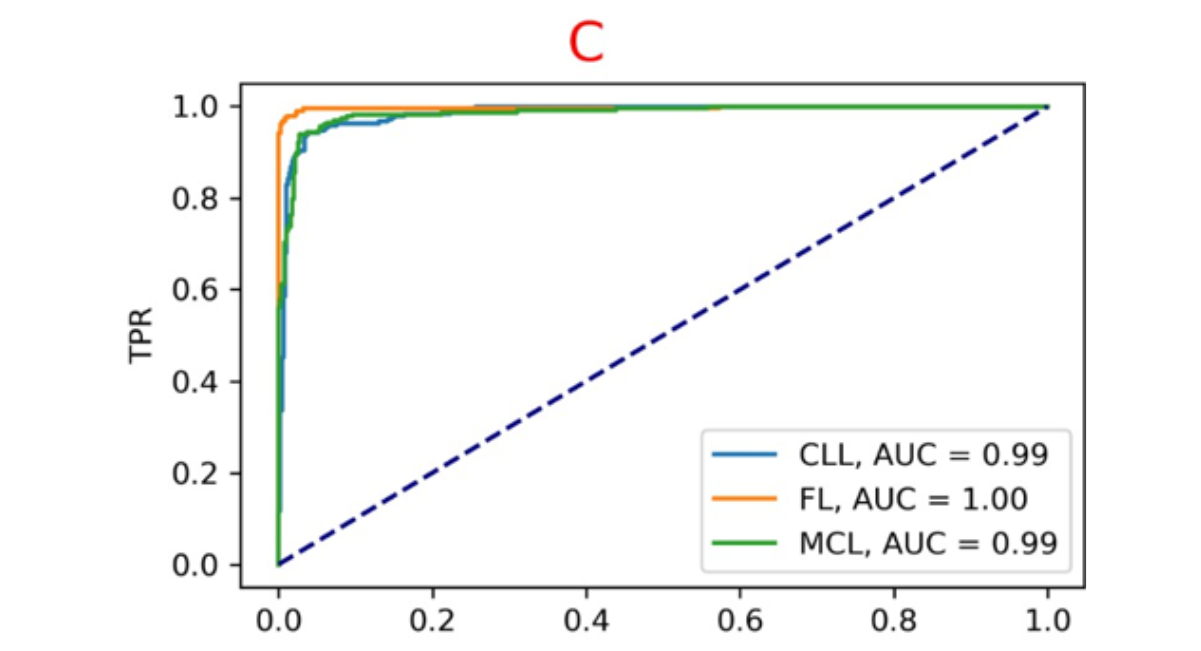
Figure 10: Illustrates The AUC-ROC Curves Across Different Sets: The Training Set (A), Validation Set (B), And Testing Set (C).
Experiment for the state-of-the-art model
The experiment, aim to compare the proposed model with several state-of-the-art models. The comparison is conducted at an epoch of 100 using a batch size of 32.
|
No. |
Name of model |
Testing accuracy |
|
1 |
ResNet 50 |
68.70% |
|
2 |
Alex Net |
35.16% |
|
3 |
Proposed AE-CNN |
98% |
Table 4: Test Accuracy Results for Various State-Of-The-Art Models
MODEL GUI
The proposed model was successfully implemented in a real-world application for classifying different malignant lymphoma types using a web-based tool built with Flask and Python, deployed on a local computer. The graphical user interface (GUI) includes features for user management shows at Figure 11, the main model interface shows at Figure 12, and a model report section shows at Figure 13. In a test example, the model achieved a 99.81% match probability between the predicted and actual class for a randomly selected follicular lymphoma (FL) case [16-20].

Figure 11: GUI For User Login
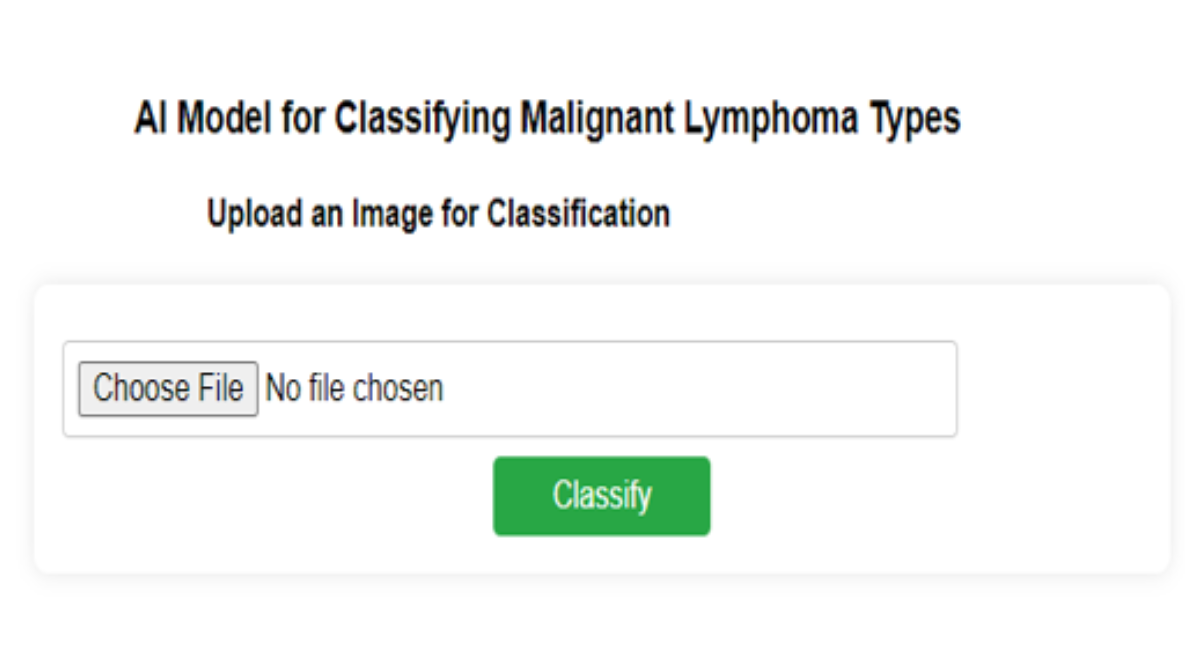
Figure 12: GUI for Image Upload & Classify
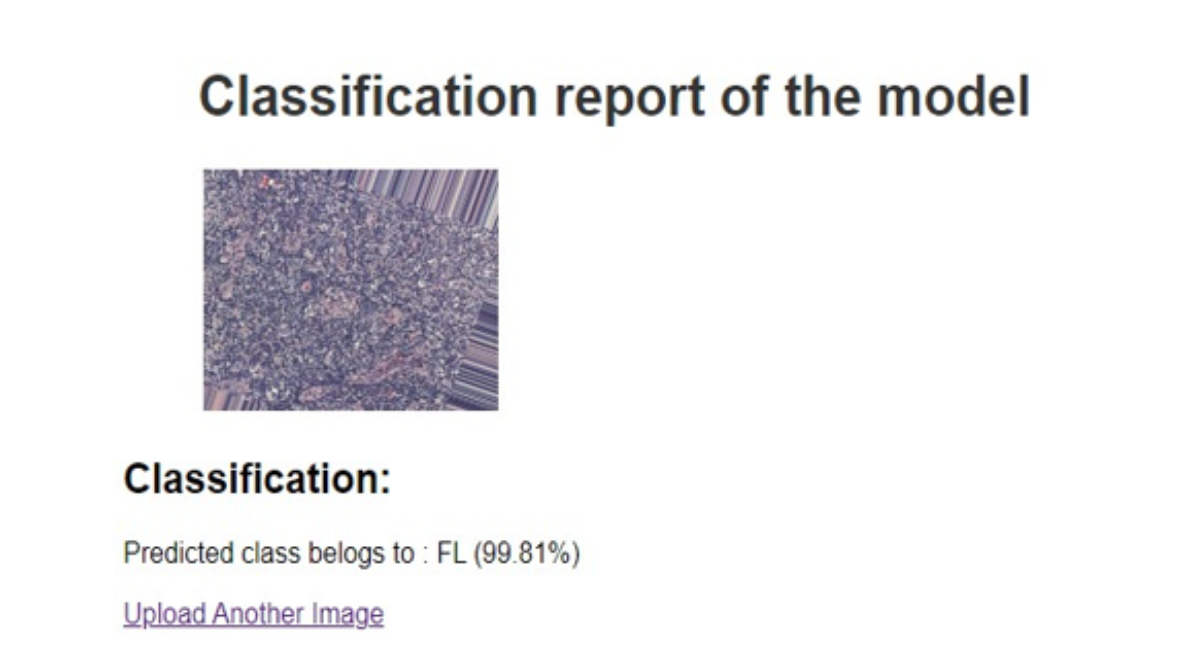
Figure 13: GUI for Classification Result
DISCUSSION
This study delved into extensive exploration of image filtering techniques and their profound influence on the performance of a classification model. Table 1 shows the results, revealing the consequential impact of various filters on testing accuracy. Within this analysis, the Gaussian filter revealed a modest enhancement, yielding a testing accuracy of 36%. A more substantial improvement was noted with histogram equalization, where the accuracy reached 40%. However, the most striking advancement surfaced with the implementation of the median filter, elevating the testing accuracy to 45.33%. This marked a notable improvement in the model's accuracy for classification. This study extended its investigation to determine the effects of diverse hyperparameters on testing accuracy, as detailed in Table 2. The model's performance varied significantly with changes in the training-test split ratios. It achieved a high accuracy of 61.95% with an 80:20 split but demonstrated a diminished accuracy of 52% when the split ratio was shifted to 70:30. The model's sensitivity to alterations in batch sizes was also evident; a batch size of 28 resulted in a testing accuracy of 48%, while a batch size of 32 mirrored the high accuracy of 61.95%. These findings underscore the pivotal role of hyperparameters in fine-tuning the model, emphasizing the necessity of meticulous parameter selection to optimize accuracy. Deep learning techniques, such as ResNet-50, backpropagation (BP), and the GA-BP neural network, have been employed for the classification of lymphoma pathological images. These methods demonstrate strong performance compared to other neural networks, achieving an accuracy of 98.63% and addressing the gap in different types of lymphoma pathological images [4]. Another research approach utilized FFNN, ResNet-50, PCA, DenseNet-121, and SVM to achieve a high training accuracy of 99.5%. However, this study relies on a handcrafted dataset, limiting its generalizability [12]. A lymphoma diagnostic model was created using the CNN algorithm due to its ability to handle multiple class labels effectively. However, this approach struggles with lower resolutions and requires preprocessing steps, which can affect its performance. Despite these limitations, the model achieved a significant 95% accuracy, demonstrating its effectiveness in diagnosing lymphoma [15]. For CLL, FL, and MCL classification, researchers used a convolutional autoencoder with PCA and stacked ensemble classifiers. Their suggested ensemble demonstrated the potential of learnt feature representations and ensemble learning, achieving 99.04% accuracy [18]. Precision Lympho Net by using a layered transfer-learning ensemble to integrate pretrained CNN models. The method demonstrated the efficacy of merging complementing CNN characteristics, achieving about 99% accuracy for multiclass lymphoma classification [19]. Several transfer-learning architectures, such as DenseNet161 and InceptionV3, were assessed for CLL and FL classification in a 2025 Scientific Reports study.InceptionV3's validation accuracy was roughly 95.6% in a simulated federated-learning environment and 97.5% in centralized learning [20].The implementation of an autoencoder-convolutional neural network (AE-CNN) yields outstanding performance, with a classification accuracy of 99.81% for identifying malignant lymphoma types; however, this approach is restricted to only three classes and does not address other pathologies. The experimental outcomes highlighted the exceptional performance of the proposed CNN model. The dataset was improved with an autoencoder (decode & encode) to enhance the model's performance, as shown in TABLE3, exhibiting strong performance across training, validation, and test phases after applying preprocessing techniques. It achieved a low training loss of 0.1884 with a high accuracy of 99.2%. In the validation phase, the model maintained a good performance with a loss of 0.4271 and an accuracy of 97.7%. Finally, on the test data, the model achieved a loss of 0.3820 and an accuracy of 98%, indicating its effectiveness and generalization ability. FIGURE 5. Depicts the model accuracy and loss before preprocessing techniques were applied, showing an initial increase in accuracy that plateaus, and a loss curve that decreases rapidly before stabilizing. This indicates that the model's performance was limited by the quality of the input data, leading to suboptimal training results. FIGURE 6. Presents the confusion matrices for the training, validation, and testing sets before preprocessing, highlighting strong performance on the training set, some generalization issues on the validation set, and difficulties distinguishing certain classes on the testing set. Figure 7. Illustrates the AUC-ROC curves for these sets, with the training set curve approaching 1, while the validation and testing set curves reveal the model's struggles with generalization and distinguishing between classes. Figure 8. Shows the model accuracy and loss after applying preprocessing techniques over 100 epochs, reflecting improved and more consistent accuracy, and a more pronounced decline in loss. FIGURE 9. Provides the updated confusion matrices, showing fewer misclassifications and improved performance across all sets, with noticeable enhancements in the testing set. Finally, Figure 10. Highlights the AUC-ROC curves after preprocessing, with improved curves across all sets, particularly a significant enhancement in the testing set, demonstrating the positive impact of preprocessing on the model’s ability to distinguish between classes effectively. Furthermore, the experimental results underscore the testing accuracy of various models, as indicated in TABLE4. ResNet 50 attained an accuracy of 68.7%, while Alex Net demonstrated a lower accuracy of 35.16%. Nevertheless, the proposed CNN model outperforms all the others, with a strikingly high accuracy of 98%, signifying its superior performance compared to the other models tested.
CONCLUSION
In our study, we demonstrated that the use of preprocessing techniques, data augmentation, and autoencoders effectively extracted more meaningful and distinctive features from the images, significantly improving classification accuracy. These features were then fed into a SoftMax classifier for the final classification. Impressively, the proposed model achieved a test accuracy of 98% with the SoftMax classifier. This study is particularly significant for its potential to provide valuable diagnostic support to radiologists in identifying malignant lymphoma. By automating part of the diagnostic process, this AI-based approach can help reduce the growing workload faced by radiologists while simultaneously enhancing the accuracy and efficiency of lymphoma diagnosis.
DECLARATIONS
ETHICS APPROVAL AND CONSENT TO PARTICIPATE
This retrospective study analyzes previously collected data in compliance with ethical standards and privacy regulations. All methods were conducted following these ethical guidelines.
CONSENT FOR PUBLICATION
This research did not involve humans, animals, or other subjects.
AVAILABILITY OF DATA AND MATERIAL
The dataset is available at Kaggle.
COMPETING INTERESTS
The authors declare no competing interests.
FUNDING
Not applicable
REFERENCES
- Thandra KC, Barsouk A, Saginala K, Padala SA, Barsouk A, Rawla P. Epidemiology of Non-Hodgkin’s Lymphoma. Med Sci (Basel). 2021;9(1):5. [Crossref] [Google Scholar] [PubMed]
- Gao H, Ji X, Liu X, Mi L, Liu W, Wang X, et al. Conditional survival and hazards of death for peripheral T-cell lymphomas. Aging (Albany NY). 2021;13(7):10225-10239. [Crossref] [Google Scholar] [PubMed]
- Zaouk SA, Matar T, Ali MA, Kassem A, Hamawy L. Classification of Leukemia and Lymphoma using Faster R-CNN. In: 2022 International Conference on Microelectronics (ICM). IEEE; 2022. p. 25-29. [Crossref] [Google Scholar]
- Zhang X, Zhang K, Jiang M, Yang L. Research on the classification of lymphoma pathological images based on deep residual neural network. Technol Health Care. 2021;29(S1):335-344. [Crossref] [Google Scholar] [PubMed]
- Sander B, Campo E, Hsi ED. Chronic lymphocytic leukaemia/small lymphocytic lymphoma and mantle cell lymphoma: from early lesions to transformation. Virchows Arch. 2023;482(1):131-145. [Crossref] [Google Scholar] [PubMed]
- Kumar Y, Gupta S, Singla R, Hu YC. A Systematic Review of Artificial Intelligence Techniques in Cancer Prediction and Diagnosis. Arch Comput Methods Eng. 2022;29(4):2043-2070. [Crossref] [Google Scholar] [PubMed]
- Syrykh C, Abreu A, Amara N, Siegfried A, Maisongrosse V, Frenois FX, et al. Accurate diagnosis of lymphoma on whole-slide histopathology images using deep learning. NPJ Digit Med. 2020;3:63. [Crossref] [Google Scholar] [PubMed]
- Hashimoto N, Fukushima D, Koga R, Takagi Y, Ko K, Kohno K, et al. Multi-scale Domain-adversarial Multiple-instance CNN for Cancer Subtype Classification with Unannotated Histopathological Images. In: Proceedings of the IEEE/CVF Conference on Computer Vision and Pattern Recognition (CVPR). 2020. p. 3852-3861. [Crossref] [Google Scholar]
- Patil R, Bhosale S. Medical Image Denoising Techniques: A Review. International Journal on Engineering, Science and Technology. 2022;4(1):21-33. [Crossref] [Google Scholar]
- Apply a Gauss filter to an image with Python. GeeksforGeeks [Internet].
- Draz HH, Elashker NE, Mahmoud MMA. Optimized Algorithms and Hardware Implementation of Median Filter for Image Processing. Circuits Syst Signal Process. 2023;42:5545-5558. [Crossref] [Google Scholar]
- Al-Mekhlafi ZG, Senan EM, Mohammed BA, Alazmi M, Alayba AM, Alreshidi A, et al. Diagnosis of Histopathological Images to Distinguish Types of Malignant Lymphomas Using Hybrid Techniques Based on Fusion Features. Electronics. 2022;11(18):2865. [Crossref] [Google Scholar]
- Kumar Y, Gupta S, Singla R, Hu YC. A Systematic Review of Artificial Intelligence Techniques in Cancer Prediction and Diagnosis. Arch Comput Methods Eng. 2022;29(4):2043-2070. [Crossref] [Google Scholar] [PubMed]
- Syrykh C, Abreu A, Amara N, Siegfried A, Maisongrosse V, Frenois FX, et al. Accurate diagnosis of lymphoma on whole-slide histopathology images using deep learning. NPJ Digit Med. 2020;3:63. [Crossref] [Google Scholar] [PubMed]
- El Achi H, Belousova T, Chen L, Wahed A, Wang I, Hu Z, et al. Automated Diagnosis of Lymphoma with Digital Pathology Images Using Deep Learning. Ann Clin Lab Sci. 2019;49(2):153-160. [Google Scholar] [PubMed]
- Dalianis H. Evaluation Metrics and Evaluation. In: Clinical Text Mining. Cham: Springer; 2018. p. 45-53. [Crossref] [Google Scholar]
- Hasnain M, Pasha MF, Ghani I, Imran M, Alzahrani MY, Budiarto R. Evaluating trust prediction and confusion matrix measures for web services ranking. IEEE Access. 2020;8:90847-90861. [Crossref] [Google Scholar]
- Ogundokun RO, Owolawi PA, Tu C, van Wyk E. Autoencoder-Assisted Stacked Ensemble Learning for Lymphoma Subtype Classification: A Hybrid Deep Learning and Machine Learning Approach. Tomography. 2025;11(8):91. [Crossref] [Google Scholar] [PubMed]
- Rajadurai S, Perumal K, Ijaz MF, Chowdhary CL. PrecisionLymphoNet: Advancing Malignant Lymphoma Diagnosis via Ensemble Transfer Learning with CNNs. Diagnostics (Basel). 2024;14(5):469. [Crossref] [Google Scholar] [PubMed]
- Uppal A, Kakkar B, Johri P, Kumar Y, Koul A. Enhancing lymphoma cancer detection using deep transfer learning on histopathological images. Sci Rep. 2025;15:38042. [Crossref] [Google Scholar] [PubMed]

Article Processing Timeline
| Stage 1 |
Initial Quality & Plagiarism Check The manuscript is reviewed for journal scope, basic submission requirements, ethical compliance, and similarity/plagiarism concerns. |
| Stage 2 |
Editorial Assessment & Peer Review Manuscripts that pass the initial screening undergo editorial assessment and independent peer review in accordance with the journal's peer-review policy. |
| Stage 3 |
Revision & Editorial Decision Authors may be requested to revise their manuscript based on reviewer and editor comments. A final editorial decision is made after the required review and revision stages are completed. |
| Stage 4 |
Production & Publication Accepted manuscripts proceed to production, author proofing, final quality checks, and online publication. |
EDITORIAL & PUBLICATION INFORMATION
| English | Publication Language |
| Single-Blind | Peer-Review Model |
| 17% | Acceptance Rate |
| <18% | Similarity Screening Guideline |
| Open Access | Access Model |
All manuscripts undergo editorial assessment and originality screening as part of the journal's evaluation process. The acceptance rate shown is based on journal-level editorial data and may change over time. Similarity reports are assessed editorially and are not interpreted solely on the basis of a numerical similarity score.
Why Publish with us?
Ethics & Policies
Editorial & Management
Useful Links
Journal Highlights
Open Access Journals
Journal Flyer