


 Download PDF
ABSTRACT
Background
Sportswear aerodynamics research has mainly examined surface roughness, seams, permeability, and stretch as design variables, while heat-treatment condition a step in the fabric manufacturing process has received comparatively little attention as an independent variable for drag comparison.
Objectives
This study aimed to compare the drag coefficient (Cd) of sprintwear fabric under different heat-treatment conditions using wind-tunnel testing, and to examine whether the observed differences depend on model geometry and flow velocity. This preliminary study used a cylinder model and an airfoil-type model rather than aiming to provide definitive evidence of aerodynamic drag reduction.
Methods
Six fabric specimens were tested: 140°C single-side heat treatment, 140°C double-side heat treatment, 160°C single-side heat treatment, 180°C single-side heat treatment, untreated (control) fabric, and 200°C single-side heat treatment. Wind-tunnel tests were conducted at flow velocities of 7, 8, 9, 10, and 11 m/s. One physical specimen represented each heat-treatment condition, and three technical measurements of the same specimen were performed at each velocity; thus, the study did not include independently manufactured replicate specimens. The reference area was 0.030 m² for the cylinder model and 0.050 m² for the airfoil-type model, reflecting the fabric-covered area on both sides of the model. Results were compared primarily using mean Cd values, with standard deviations presented as error bars.
Results
In the airfoil-type model, several heat-treated specimens showed lower Cd than the untreated fabric (No.5). No.4 (180°C single-side) showed the largest reduction relative to No.5 at 9 m/s, approximately −20.4%. No.3 (160°C single-side) showed consistently lower Cd at 10 and 11 m/s, with reductions of approximately −15.1%. In the cylinder model, differences were much smaller, with most Cd changes relative to No.5 remaining within approximately ±3%. At 11 m/s in the cylinder model, the untreated fabric showed the lowest mean Cd; however, this result should be interpreted cautiously because the mean value may have been influenced by one comparatively low repeated measurement.
Conclusion
No single heat-treatment condition consistently produced the lowest Cd across all model geometries and flow velocities. Nevertheless, No.3 and No.4 may be considered candidate conditions for further investigation, particularly in the airfoil-type model. This study contributes by introducing heat-treatment temperature and treated-surface condition as manufacturing-process variables for the aerodynamic comparison of sprintwear fabrics.
Keywords: Skinsuit Aerodynamics; Fabric Surface Treatment; Airfoil Model; Cylinder Model; Reynolds Number; Sprint Performance
INTRODUCTION
In high-speed sports, the aerodynamic characteristics of clothing have long been recognized as an important design variable that can influence athletic performance. In events such as speed skating, cycling, ski jumping, and sprint running, where athletes move at high speed and the body surface is directly exposed to the external flow, the garment surface can act not merely as a covering but as a boundary condition between the human body and the surrounding flow. Brownlie and Kyle reported that skin suits can have aerodynamic effects relevant to performance in long-track speed skating, and Brownlie demonstrated, through the development of the NIKE Swift sprint running suit and SwiftSkin speed skating suit, that drag reduction can be an important design goal in sportswear development [1,2]. Oggiano likewise reviewed aerodynamic research on skin suits and sportswear, concluding that fabric properties, panel placement, body posture, and exercise conditions act in combination to affect overall drag [3].
Both approaches that directly simulate actual wearing conditions and approaches using simplified geometric models have been used to evaluate the aerodynamic characteristics of sportswear. Experiments based on simplified models cannot fully reproduce the complex geometry of the human body, but they are useful for comparing the relative aerodynamic response associated with the fabric itself or its surface condition. Chowdhury presented an experimental design and methodology for evaluating the aerodynamic characteristics of sports textiles, and Chowdhury reported an approach for evaluating the drag and lift characteristics of sports fabrics [4,5]. Chowdhury, in a study on ski-jumping suits, further reported that garment fabric and shape can influence the aerodynamic response under competition conditions [6].
The aerodynamic characteristics of a fabric are related not only to the type of material but also to surface condition, air permeability, stretch, compression, seam or trip-strip structure, and micro-surface geometry. Moria examined the aerodynamic behavior of stretchable sports fabrics, and Moria reported that compression conditions can affect the aerodynamic characteristics of sports fabrics [7,8]. Kataoka suggested that the air permeability of ski-jumping-suit fabric can influence flow behavior, and Hsu examined the relationship between textile roughness and drag reduction using a cyclist model [9,10]. Jiang analyzed the flow field and aerodynamic characteristics of cycling apparel fabric with a grooved surface, and Esfahani showed that roughness and trips can affect the drag of a circular cylinder under subcritical flow conditions [11,12]. Messiry and Mohamed also analyzed the aerodynamic behavior of single-jersey knitted fabric containing slub yarn, reporting that knit structure and yarn characteristics can be linked to aerodynamic response [13].
Aerodynamic research related to running and sprinting has also been reported. Hirata precisely measured the aerodynamic drag of a track runner using a wind-tunnel moving-belt system, and Brownlie examined the potential for drag reduction by applying vortex generators to athletic apparel [14,15]. These prior studies suggest that surface geometry and fabric condition can also be considered design variables for drag reduction in sprint-running apparel. However, the focus of existing research has been mainly on surface and structural variables such as roughness, seams, weave structure, vortex generators, permeability, stretch, pressure, and grooves, whereas studies that set heat-treatment condition one of the fabric manufacturing processes itself as an independent variable and compared drag coefficients accordingly remain relatively limited.
In actual wear, sprintwear is applied to body regions with markedly different curvatures and shapes, such as the thigh, calf, upper arm, and trunk. Consequently, evaluating the aerodynamic effect of a given fabric or treatment condition on a single geometry alone may not provide sufficient information for the design of competition apparel. Boundary-layer development, separation location, and the influence of surface roughness can differ between regions that are closer to cylindrical and regions that are closer to streamlined. Accordingly, the present study used a cylinder model and an airfoil-type model together to compare how the drag coefficient of the same fabric under different heat-treatment conditions varies with model geometry.
The purpose of this study was to compare, through wind-tunnel testing, the drag coefficient (Cd) of sprintwear fabric under different heat-treatment conditions, and to examine whether the observed differences vary with model geometry and flow velocity. Rather than presenting a specific heat-treatment condition as an absolute optimum, this study focused on exploratorily evaluating whether heat-treatment temperature and the number of treated surfaces manufacturing-process variables are variables worth considering in the aerodynamic design of sportswear.
MATERIALS AND METHODS
Fabric Specimens
A total of six fabric specimens were used in this study, classified according to heat-treatment condition: No.1, 140°C single-side heat treatment; No.2, 140°C double-side heat treatment; No.3, 160°C single-side heat treatment; No.4, 180°C single-side heat treatment; No.5, untreated (control) fabric; and No.6, 200°C single-side heat treatment. In this study, heat treatment was defined as a process of applying heat directly to the fabric surface, with conditions distinguished by treatment temperature and the number of treated surfaces. The specimens and their heat-treatment conditions are summarized in Table 1.
|
Specimen No. |
Heat-Treatment Condition |
Treatment Temperature |
Treated Surface(s) |
Note |
|
No.1 |
140°C single-side |
140°C |
Single-side |
— |
|
No.2 |
140°C double-side |
140°C |
Double-side |
— |
|
No.3 |
160°C single-side |
160°C |
Single-side |
— |
|
No.4 |
180°C single-side |
180°C |
Single-side |
— |
|
No.5 |
Untreated fabric |
— |
— |
Reference (control) specimen |
|
No.6 |
200°C single-side |
200°C |
Single-side |
— |
Table 1: Fabric Specimens and Heat-Treatment Conditions
The specimens were fabrics applicable to actual sprintwear. However, detailed material properties such as fiber composition, weave structure, commercial name, thickness, mass, air permeability, surface roughness, and surface imaging were not separately reported in this study. Process-level details of the heat treatment duration, pressure, contact method, and cooling conditions were also not fully specified. Consequently, there are limitations in attributing all observed differences among specimens solely to heat-treatment temperature or the number of treated surfaces.
Accordingly, the scope of interpretation in this study was limited to relative comparisons of drag coefficient according to heat-treatment condition. That is, this study was not designed to directly demonstrate the mechanism by which heat treatment alters specific material properties, but was instead set up as an exploratory, preliminary experimental study comparing the aerodynamic responses observed under the given specimen conditions.
Wind-Tunnel Test Conditions
Aerodynamic measurements were performed in the closed-circuit, low-speed, low-turbulence sports wind tunnel (San Technologies Co., Ltd.) at the University of Tsukuba. The maximum wind speed of the tunnel is approximately 55 m/s, and the test-section outlet measures 1.5 m × 1.5 m. Flow-velocity distribution was maintained within ±0.5%, and turbulence intensity was kept at approximately 0.1% or lower. Ambient temperature during testing was controlled within 30–35°C, and relative humidity within 50–70%. The measurement environment for each specimen is summarized in Table 2. The airfoil-type and cylinder model tests were conducted on separate schedules, and temperature and relative humidity varied slightly according to specimen order (Table 2).
|
Specimen |
Airfoil-type Temperature (°C) |
Airfoil-type Humidity (%) |
Cylinder Temperature (°C) |
Cylinder Humidity (%) |
|
No.1 |
31.8 |
68.2 |
32.6 |
65.8 |
|
No.2 |
32.2 |
67.4 |
33.0 |
61.7 |
|
No.3 |
32.5 |
65.9 |
33.1 |
54.2 |
|
No.4 |
32.5 |
64.9 |
33.6 |
54.1 |
|
No.5 |
32.4 |
64.0 |
33.6 |
52.0 |
|
No.6 |
32.3 |
63.8 |
33.6 |
51.0 |
Table 2: Ambient Temperature and Relative Humidity During Wind-Tunnel Testing, by Specimen
Flow velocities were set at 7, 8, 9, 10, and 11 m/s. The drag coefficient (Cd) was measured at each velocity condition, with three repeated measurements per condition. Data were acquired at 100 Hz for 10 s. Measurements were obtained using a sting-type six-component force balance (LMC-61256, Nissho Electric Works, Osaka, Japan), with the model supported by a rear sting bar. The force balance was zeroed before each measurement, and the mean of the repeated measurements was used for comparison of results.
The velocity range used in this study was intended as supplementary context to represent the sprint-competition speed range. However, because the values measured directly in this study are drag coefficients of simplified models in a wind tunnel, they were not converted to actual 100 m race times or to drag changes under real wearing conditions. Interpretation of the results focused on relative comparison of Cd across flow velocities.
For non-dimensionalization of the test conditions, the Reynolds number (Re) was defined as in Equation (1):
Re = UL / ν
where U is the flow velocity (m/s), L is the characteristic length (m; diameter D = 0.10 m for the cylinder model and chord length c = 0.25 m for the airfoil-type model), and ν is the kinematic viscosity of air (m²/s).
Test Models and Reference Area
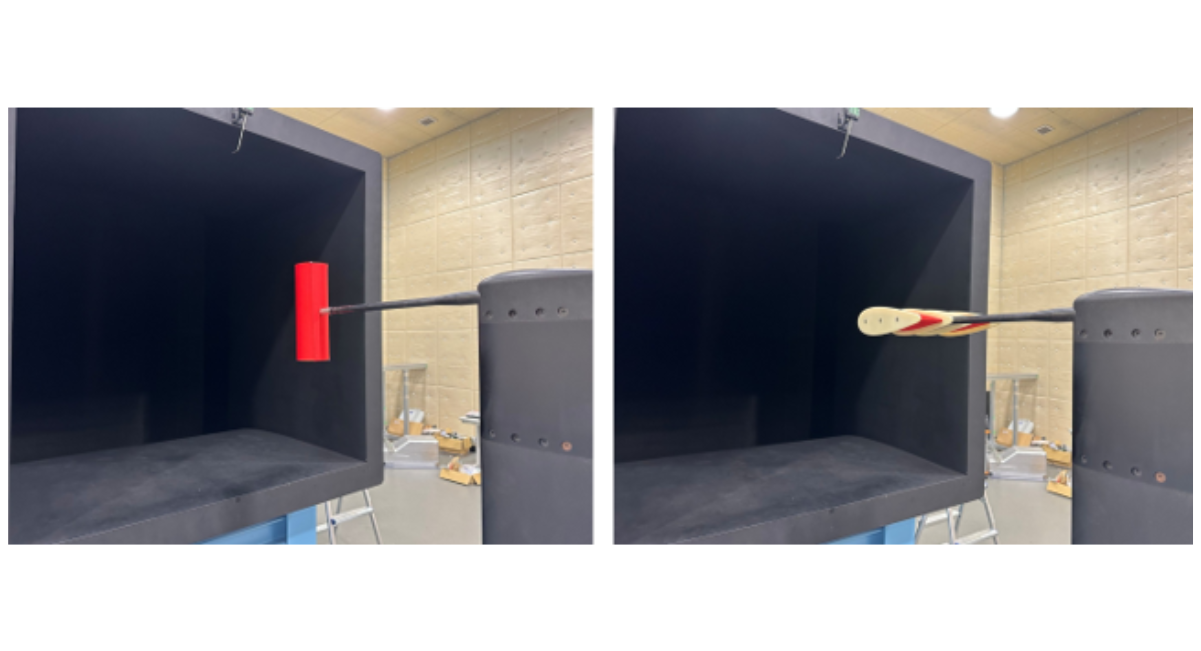
Figure 1: Wind-Tunnel Test Setup and Test Models
To simplify localized body geometry, a cylinder model and an airfoil-type model were used. The cylinder model was set as a comparative model representing body regions close to cylindrical, and the airfoil-type model represented regions with relatively more streamlined characteristics. The two models were intended to reflect different geometric sensitivities, and it was not assumed that either model's results were inherently superior to the other's.
The cylinder model was a plastic cylindrical model with a diameter of 10 cm and a height of 30 cm. The airfoil-type model was a symmetric streamlined model, 10 cm wide and 25 cm long. The airfoil-type model was aligned to face the incoming flow directly and was tested at an angle of attack of 0° (Figure 1).
The reference area for calculating the drag coefficient was set at 0.030 m² for the cylinder model and 0.050 m² for the airfoil-type model. The reference area of the cylinder model was defined as the frontal projected area (0.10 m × 0.30 m). The reference area of the airfoil-type model was defined as the combined area of both sides (2 × 0.10 m × 0.25 m), reflecting the fact that the fabric covered both sides of the model. This reference-area definition was used as the basis for relative comparison among specimens within the same airfoil-type model.
The drag coefficient (Cd) was calculated according to Equation (2):
Cd = FD / (½ ρ U² Aref)
where FD is the drag force (N), ρ is air density (kg/m³), U is flow velocity (m/s), and Aref is the reference area (m²). Air density (ρ) was not held constant during testing; it was calculated for each measurement condition using the corresponding ambient temperature and relative humidity recorded at the time of testing (Table 2).
The drag coefficient of a typical airfoil-type model can be defined using a reference area such as the planform area or width × length; however, this study used the combined two-side area as the reference in order to compare the effect of fabric-covered area. Accordingly, the Cd values reported for the airfoil-type model in this study should be interpreted as a relative comparison index among specimens applying an identical reference area, rather than as results for a standard streamlined model. Because the cylinder and airfoil-type models differ in geometry and reference-area definition, absolute Cd values between the two models were not directly compared; instead, relative differences among specimens were compared within each model. For reference, the corresponding Cd values recalculated using the conventional planform reference area (0.025 m²; width × length of one side) are provided in Supplementary Table S1 to facilitate comparison with prior published Cd values.
RESULTS
Drag Coefficient of the Airfoil-Type Model
Mean Cd values by flow velocity for the airfoil-type model are presented in Table 3 and Figure 3. Averaged across all flow velocities, the Cd of the untreated fabric (No.5) was 0.032. Among the heat-treated specimens, No.3 (160°C single-side) showed the lowest mean Cd at 0.029, approximately 9.8% lower than the untreated fabric. No.4 (180°C single-side) showed a mean Cd of 0.030, approximately 5.8% lower than the untreated fabric. These results indicate that, on average, No.3 and No.4 showed comparatively lower Cd in the airfoil-type model.
The specimen with the lowest Cd was not fixed across flow velocities. At 7 m/s, No.6 (200°C single-side) showed the lowest Cd at 0.030. At 8 and 9 m/s, No.4 (180°C single-side) showed the lowest values, 0.028 and 0.026, respectively. At 10 and 11 m/s, No.3 (160°C single-side) showed the lowest Cd, 0.024 and 0.025, respectively.
No.2 (140°C double-side) showed a Cd reduction of −12.6% at 9 m/s and −11.5% at 11 m/s relative to the untreated fabric — larger than the corresponding reductions for No.1, the single-side condition at the same temperature (−7.6% at 9 m/s and −8.1% at 11 m/s). At 8 m/s, however, No.2 (+5.1%) showed a higher Cd than No.1 (−5.6%), indicating that the effect of the number of treated surfaces varied with flow velocity. The velocity-wise ΔCd comparison between single-side (No.1) and double-side (No.2) treatment at the same treatment temperature (140°C) is presented in Figure 2.
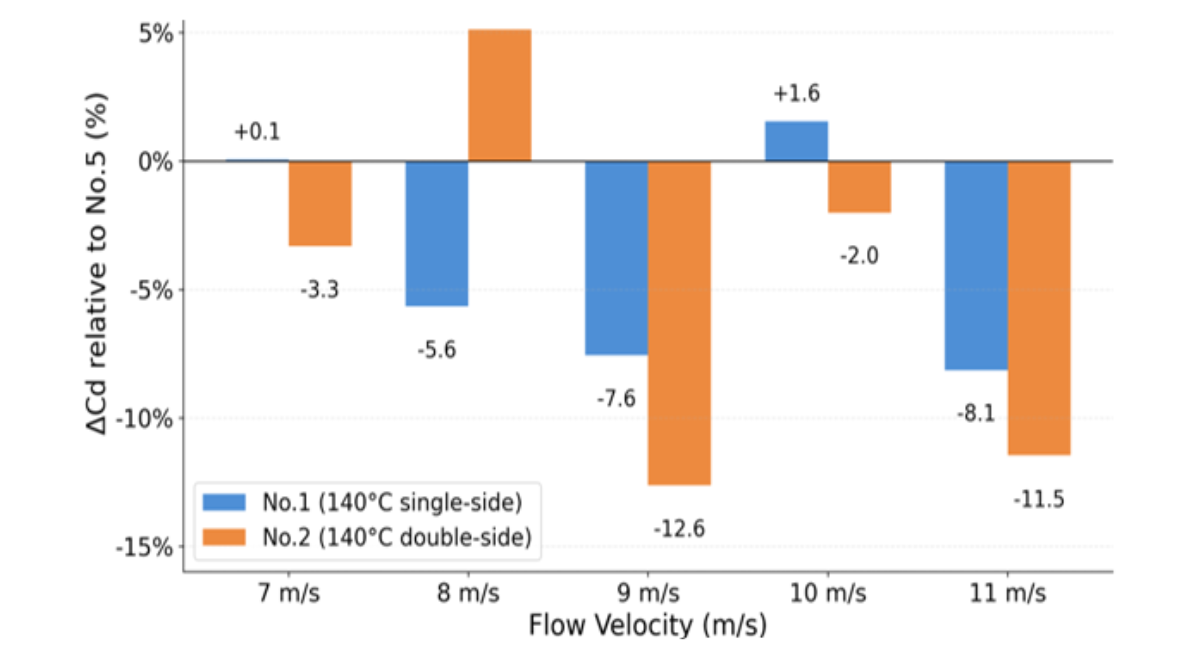
Figure 2: Comparison Of Δcd (%) Between Single-Side (No.1) and Double-Side (No.2) Heat Treatment At 140°C In the Airfoil-Type Model. Negative Values Indicate Lower Cd Relative to No.5
|
Velocity (m/s) |
No. 1 |
No. 2 |
No. 3 |
No. 4 |
No. 5 |
No. 6 |
|
7 |
0.0344 |
0.0333 |
0.0310 |
0.0333 |
0.0344 |
0.0308 |
|
8 |
0.0296 |
0.0330 |
0.0313 |
0.0284 |
0.0314 |
0.0326 |
|
9 |
0.0307 |
0.0291 |
0.0303 |
0.0265 |
0.0332 |
0.0314 |
|
10 |
0.0295 |
0.0285 |
0.0247 |
0.0303 |
0.0291 |
0.0283 |
|
11 |
0.0279 |
0.0268 |
0.0258 |
0.0308 |
0.0303 |
0.0316 |
Table 3: Mean Drag Coefficient (Cd) At Each Flow Velocity for the Airfoil-Type Model
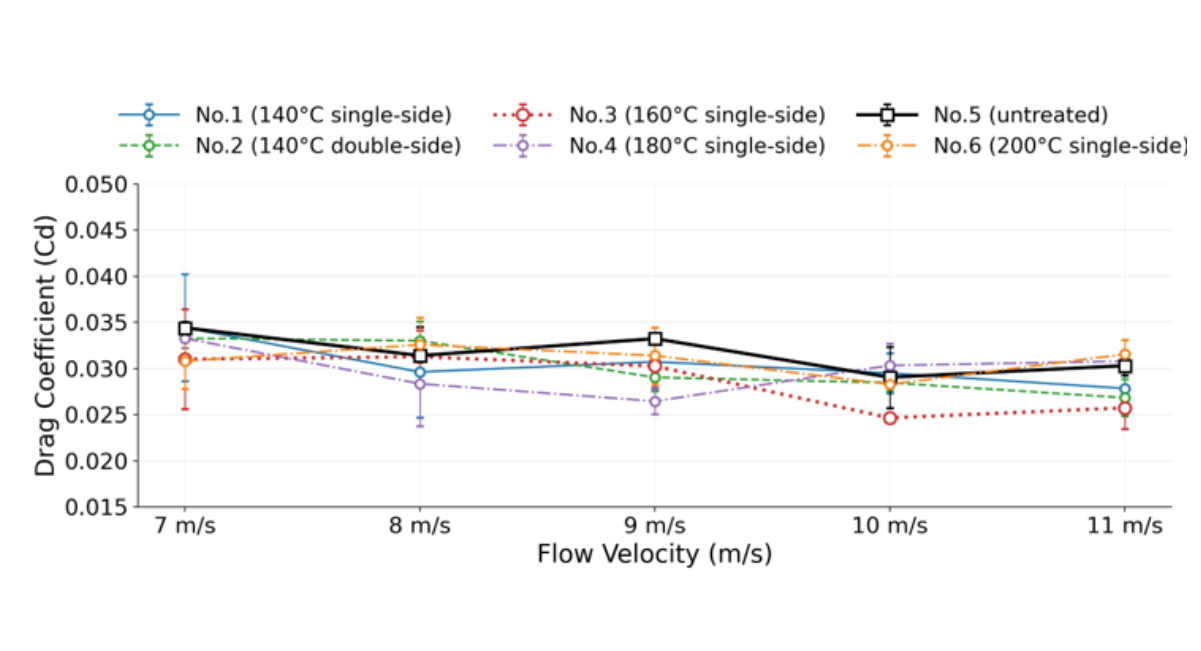
Figure 3: Drag Coefficient (Cd) As A Function of Flow Velocity for the Airfoil-Type Model. Error Bars Represent ±1 Standard Deviation (SD) From Three Repeated Measurements
Drag Coefficient of the Cylinder Model
Mean Cd values by flow velocity for the cylinder model are presented in Table 4 and Figure 4. Differences among specimens were smaller in the cylinder model than in the airfoil-type model. Averaged across all flow velocities, No.6 (200°C single-side) showed the lowest Cd at 0.768, followed by No.3 (160°C single-side) at 0.773 and No.5 (untreated) at 0.774. However, the difference between No.6 and the untreated fabric was only about −0.8%, considerably smaller than the differences observed in the airfoil-type model.
|
Velocity (m/s) |
No.1 |
No.2 |
No.3 |
No.4 |
No.5 |
No.6 |
|
7 |
0.787 |
0.777 |
0.783 |
0.783 |
0.780 |
0.782 |
|
8 |
0.787 |
0.781 |
0.778 |
0.783 |
0.785 |
0.765 |
|
9 |
0.773 |
0.777 |
0.772 |
0.781 |
0.778 |
0.769 |
|
10 |
0.760 |
0.765 |
0.767 |
0.771 |
0.769 |
0.761 |
|
11 |
0.764 |
0.769 |
0.763 |
0.767 |
0.757 |
0.762 |
Table 4: Mean Drag Coefficient (Cd) At Each Flow Velocity for the Cylinder Model
By flow velocity, the lowest Cd was observed for No.2 (140°C double-side, 0.777) at 7 m/s, No.6 (200°C single-side, 0.765) at 8 m/s, No.6 (200°C single-side, 0.769) at 9 m/s, No.1 (140°C single-side, 0.760) at 10 m/s, and No.5 (untreated, 0.757) at 11 m/s.
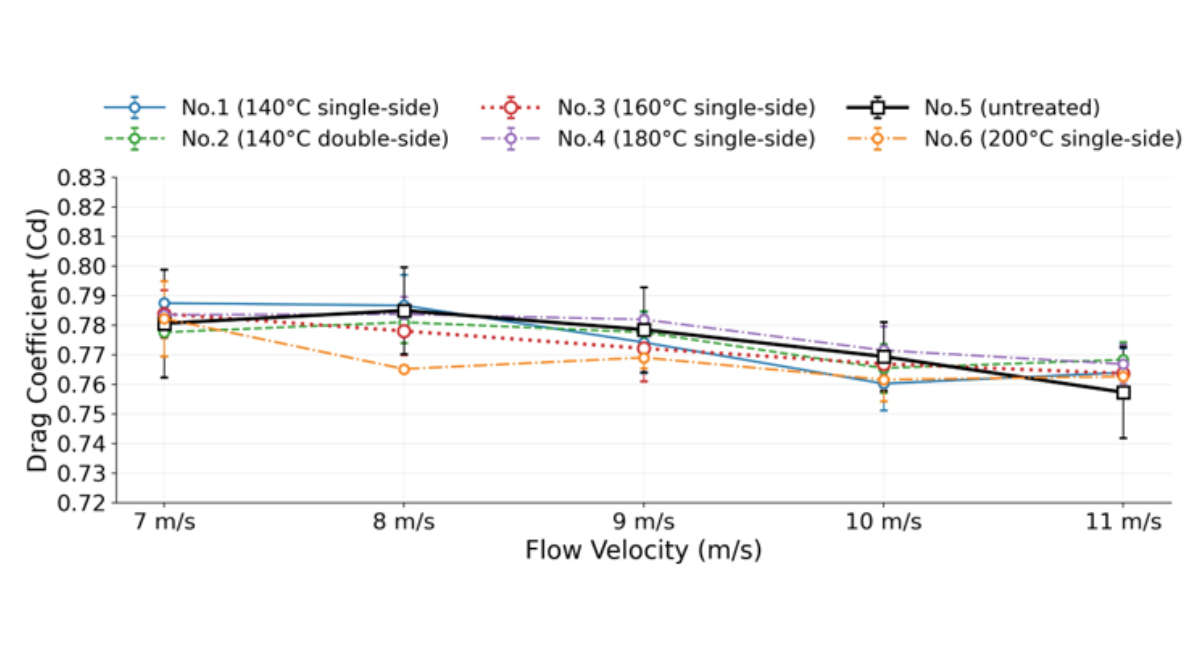
Figure 4: Drag Coefficient (Cd) As A Function of Flow Velocity for the Cylinder Model
Comparison by Model Geometry
Comparing the two models, the aerodynamic response to heat-treatment condition differed by model geometry. In the airfoil-type model, the tendency for heat-treated specimens to show lower Cd than the untreated fabric was comparatively clear on a mean-value basis, with No.3 (160°C single-side) showing the lowest overall mean Cd. In the cylinder model, by contrast, No.6 (200°C single-side) showed the lowest mean Cd, but the difference from the untreated fabric was only about −0.8% (Figure 5).
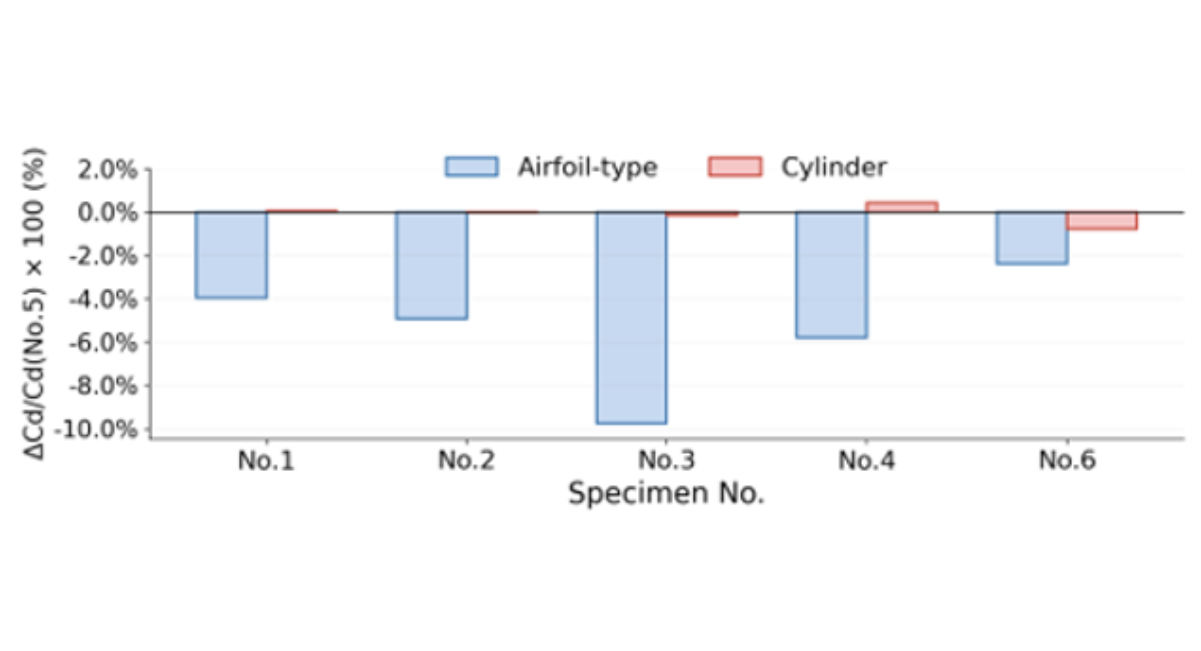
Figure 5: Relative Change in Drag Coefficient (Δcd, %) Of Heat-Treated Specimens Relative to The Untreated Fabric (No.5). Δcd Was Computed from Mean Cd Values Averaged Across All Flow Velocities (7–11 M/S)
Comparison by Flow Velocity
The specimen with the lowest Cd at each flow velocity differed by model geometry. In the airfoil-type model, No.6 showed the lowest Cd at 7 m/s, No.4 at 8–9 m/s, and No.3 at 10–11 m/s. In the cylinder model, No.2 showed the lowest Cd at 7 m/s, No.6 at 8–9 m/s, No.1 at 10 m/s, and No.5 at 11 m/s (Table 5). The velocity-wise relative change compared with the untreated fabric (No.5) is presented in Figures 7 and 8.
|
Velocity (m/s) |
Airfoil-type model |
Cylinder model |
|
7 |
No.6 (200°C single-side) |
No.2 (140°C double-side) |
|
8 |
No.4 (180°C single-side) |
No.6 (200°C single-side) |
|
9 |
No.4 (180°C single-side) |
No.6 (200°C single-side) |
|
10 |
No.3 (160°C single-side) |
No.1 (140°C single-side) |
|
11 |
No.3 (160°C single-side) |
No.5 (untreated) |
Table 5: Distribution of specimens with the lowest mean Cd, by model geometry and flow velocity
No.4 showed comparatively lower Cd in the 8–9 m/s range and No.3 in the 10–11 m/s range, indicating a complementary pattern in which the velocity range of relative advantage differed between the two conditions. In addition, No.4 reversed direction above 10 m/s, showing higher Cd than the untreated fabric (+4.4% at 10 m/s and +1.6% at 11 m/s), suggesting that evaluating heat-treatment effects at a single velocity condition alone could lead to misjudging the optimal condition. The velocity-wise complementary reduction pattern of No.3 and No.4 is presented in Figure 6.
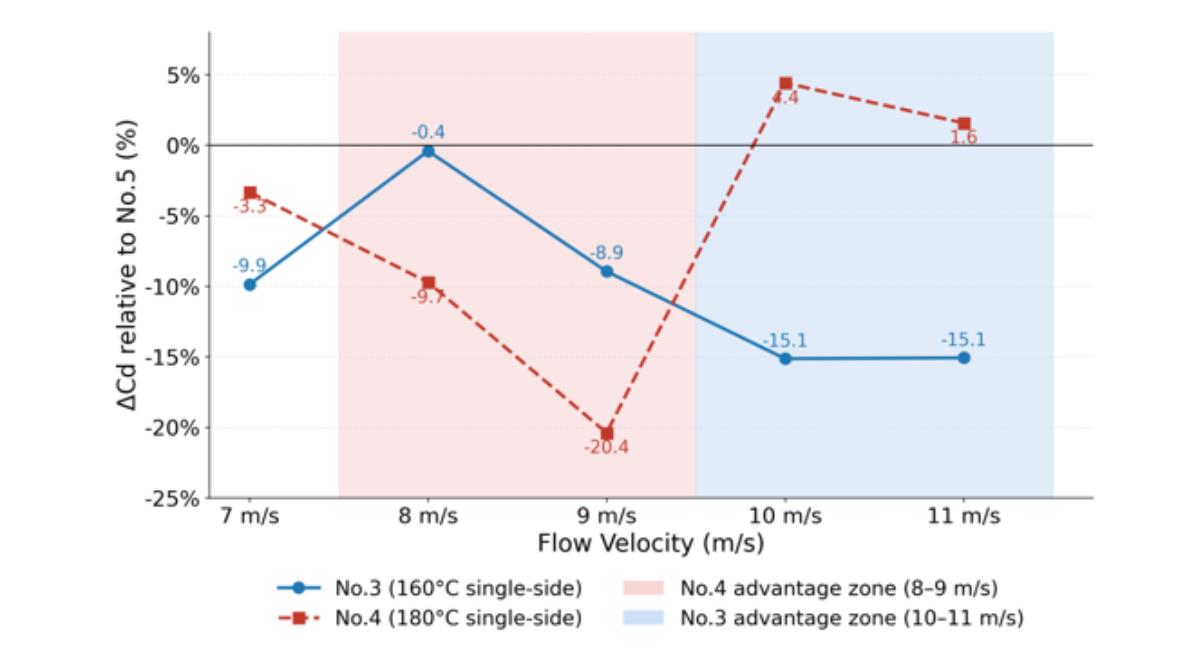
Figure 6: Velocity-Dependent Complementary Pattern Of Δcd (%) For No.3 (160°C Single-Side) And No.4 (180°C Single-Side) in the Airfoil-Type Model
In the airfoil-type model, No.4 (180°C single-side) showed the largest reduction, approximately −20.4%, at 9 m/s, and No.3 (160°C single-side) showed reductions of approximately −15.1% at both 10 and 11 m/s (Table 6).
|
Velocity (m/s) |
No.1 (140°C single-side) |
No.2 (140°C double-side) |
No.3 (160°C single-side) |
No.4 (180°C single-side) |
No.6 (200°C single-side) |
|
7 |
+0.1% |
−3.3% |
−9.9% |
−3.3% |
−10.5% |
|
8 |
−5.6% |
+5.1% |
−0.4% |
−9.7% |
+3.8% |
|
9 |
−7.6% |
−12.6% |
−8.9% |
−20.4% |
−5.5% |
|
10 |
+1.6% |
−2.0% |
−15.1% |
+4.4% |
−2.6% |
|
11 |
−8.1% |
−11.5% |
−15.1% |
+1.6% |
+4.1% |
Table 6: Distribution of Δcd (%) Relative to No.5 Across All Specimens and Flow Velocities for the Airfoil-Type Model
No.1 and No.4 showed higher Cd than the untreated fabric at 10 m/s, and No.4 and No.6 did so at 11 m/s. In the cylinder model, the overall range of change remained mostly within ±3%, with No.6 (200°C single-side) showing the largest reduction, approximately −2.5%, at 8 m/s. At 11 m/s, all heat-treated specimens showed higher Cd than the untreated fabric (Table 7).
|
Velocity (m/s) |
No.1 (140°C single-side) |
No.2 (140°C double-side) |
No.3 (160°C single-side) |
No.4 (180°C single-side) |
No.6 (200°C single-side) |
|
7 |
+0.9% |
−0.4% |
+0.4% |
+0.4% |
+0.2% |
|
8 |
+0.2% |
−0.5% |
−0.9% |
−0.2% |
−2.5% |
|
9 |
−0.6% |
−0.1% |
−0.8% |
+0.4% |
−1.2% |
|
10 |
−1.2% |
−0.5% |
−0.3% |
+0.3% |
−1.0% |
|
11 |
+0.9% |
+1.5% |
+0.8% |
+1.3% |
+0.7% |
Table 7: Distribution Of Δcd (%) Relative to No.5 Across All Specimens and Flow Velocities for the Cylinder Model
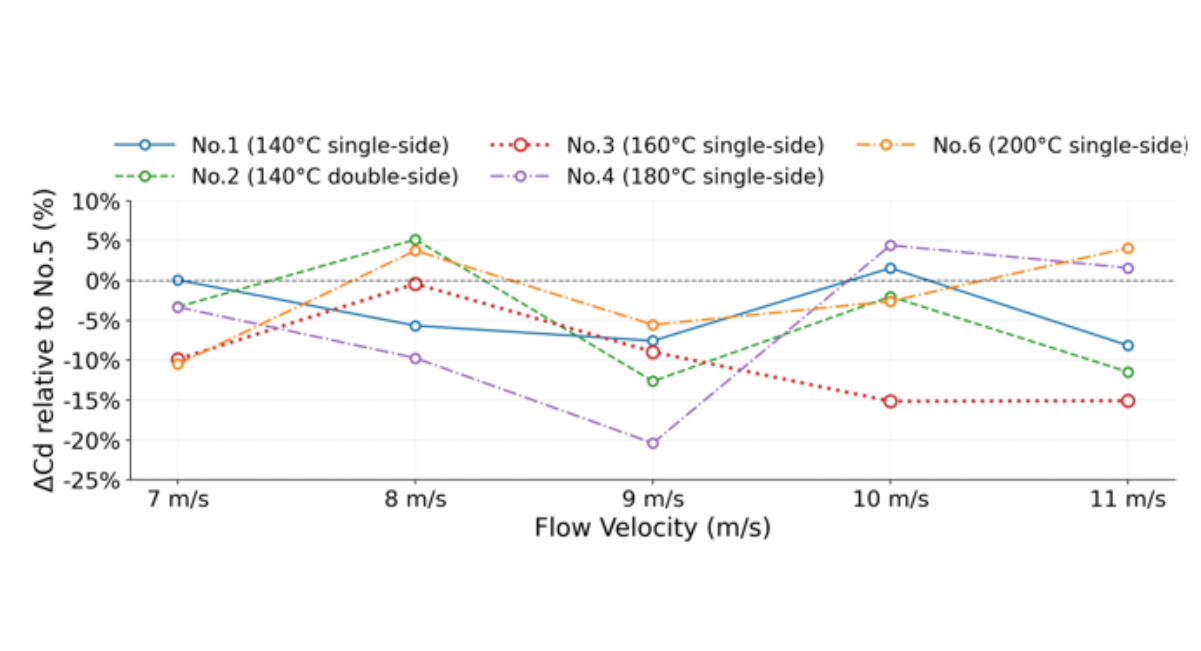
Figure 7: Velocity-Wise Relative Change in Drag Coefficient (Δcd, %) Compared to the Untreated Fabric (No.5) in the Airfoil-Type Model
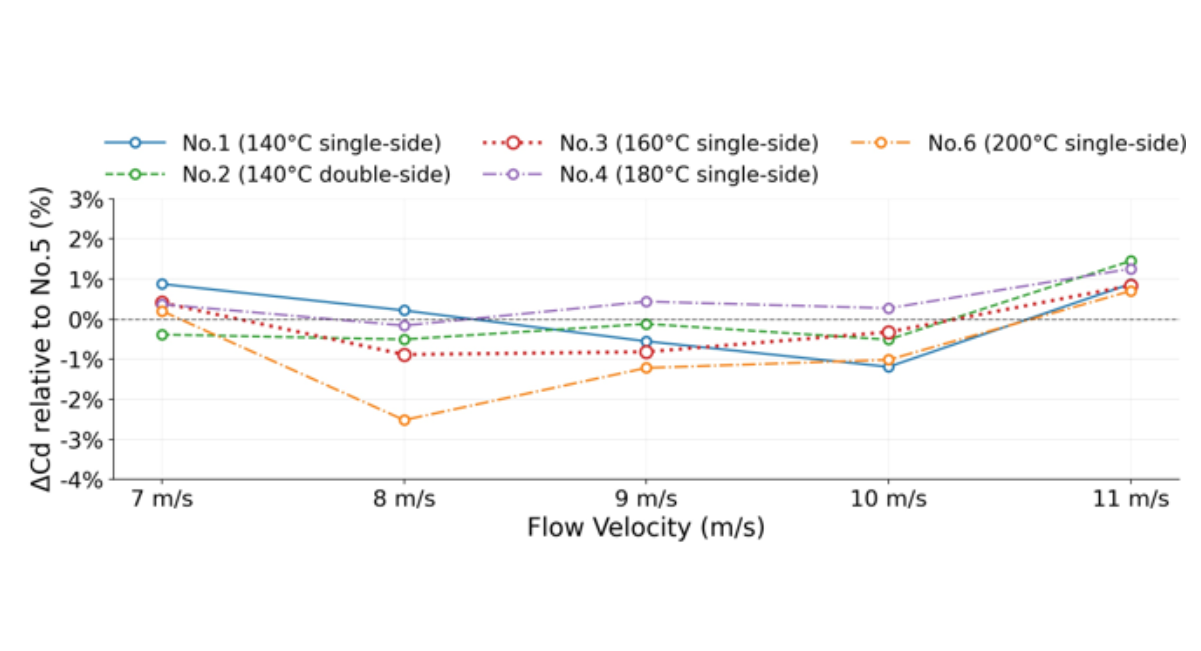
Figure 8: Velocity-Wise Relative Change in Drag Coefficient (Δcd, %) Compared to the Untreated Fabric (No.5) in the Cylinder Model
DISCUSSION
Overall, the results indicate that the effect of heat-treatment condition on the drag coefficient differed by model geometry. In the airfoil-type model, the rate of Cd change relative to the untreated fabric (No.5) varied considerably with flow velocity, with No.4 (180°C single-side) showing the largest reduction, approximately −20.4%, at 9 m/s, and No.3 (160°C single-side) showing reductions of approximately −15.1% at both 10 and 11 m/s. In the cylinder model, by contrast, the change relative to No.5 remained mostly within ±3% across all specimens and velocities. This difference may be related to differences in drag components and flow sensitivity between the two geometries.
From a fluid-mechanical perspective, in a bluff-body geometry such as the cylinder, pressure drag arising from separation and wake formation accounts for a large share of the total drag. In this case, changes in fabric surface condition may affect the boundary layer and separation location, but their effect on overall Cd may not be strongly manifested. In a relatively more streamlined geometry such as the airfoil-type model, by contrast, the boundary layer developing along the surface, skin-friction drag, and separation characteristics associated with surface condition may be more sensitively reflected in Cd. However, because this study did not directly measure changes in surface roughness, air permeability, thickness, or fiber protrusion before and after heat treatment, this interpretation can only be presented as a plausible physical explanation rather than a confirmed mechanism. The geometry-dependent differences identified in this study are therefore best interpreted as exploratory findings indicating that the way heat-treatment condition interacts with the flow may vary with geometry. An additional consideration is the markedly different magnitude of Cd between the two models. Because the baseline Cd of the airfoil-type model was approximately 0.03, compared with approximately 0.78 for the cylinder model, a similar absolute change in measured drag or Cd can produce a considerably larger relative percentage change in the airfoil-type model. Therefore, the larger ΔCd values observed for the airfoil-type geometry should not be interpreted solely as evidence of greater physical sensitivity to surface treatment; both flow-physics effects and scale-dependent amplification of relative differences may have contributed to the observed pattern.
Velocity dependence was another important feature identified in this study. In the airfoil-type model, No.4 (180°C single-side) showed comparatively lower mean Cd in the 8–9 m/s range, while No.3 (160°C single-side) did so in the 10–11 m/s range. Even for the same specimen, the rate of change relative to No.5 varied with flow velocity, and in some conditions the heat-treated specimen showed higher Cd than No.5. For example, in the airfoil-type model, No.1 was nearly identical to No.5 at 7 m/s, while No.4 showed higher Cd than No.5 at 10 m/s. This suggests that the interaction among fabric surface condition, boundary-layer development, and separation characteristics may vary with Reynolds number. As Moria reported changes in aerodynamic response with fabric stretch and compression condition, and as Esfahani showed that the effect of roughness on the drag of a circular cylinder can depend on flow velocity and Reynolds number, the combined effect of surface condition and flow velocity is difficult to explain with a simple linear relationship [7,8,12]. The present results likewise show the limitation of judging the optimal heat-treatment condition from a single flow-velocity condition alone.
By specimen, No.3 (160°C single-side) showed the lowest Cd in the airfoil-type model at 10 and 11 m/s, and a comparatively low, though not lowest, Cd at 7 m/s. In the cylinder model, No.6 showed low Cd at 8–9 m/s. No.3 can therefore be regarded as a candidate condition that repeatedly showed low Cd across both models and several velocity conditions. No.4 (180°C single-side) showed the lowest Cd in the airfoil-type model at 8–9 m/s, with the largest reduction observed at 9 m/s. No.6 (200°C single-side), by contrast, showed notably low Cd in the airfoil-type model at 7 m/s and in the cylinder model at 8 m/s, but showed lower consistency at higher velocities. No.1 and No.2, both at 140°C, showed low values at some velocities, but an overall clear and consistent reduction trend was difficult to establish. This pattern indirectly suggests that heat treatment above a certain level may induce changes in fabric surface condition that affect aerodynamic response.
Comparing the number of treated surfaces at the same treatment temperature (140°C), No.2 (double-side) showed lower Cd than No.1 (single-side) at all velocities except 8 m/s. The difference was most pronounced at 9 m/s (No.2: −12.6% vs. No.1: −7.6%) and 11 m/s (No.2: −11.5% vs. No.1: −8.1%), suggesting that the number of treated surfaces (single- vs. double-side) may act as an independent factor influencing aerodynamic response. No.4 also showed a pronounced reduction effect at 8–9 m/s but reversed direction above 10 m/s, showing higher Cd than the untreated fabric. This may be related to a transition in boundary-layer separation characteristics with changing Reynolds number, but because the flow field was not directly measured in this study, this cannot be confirmed as the underlying mechanism. The mean ΔCd across all flow velocities (7–11 m/s) for each heat-treated specimen in the airfoil-type model is summarized in Figure 9.
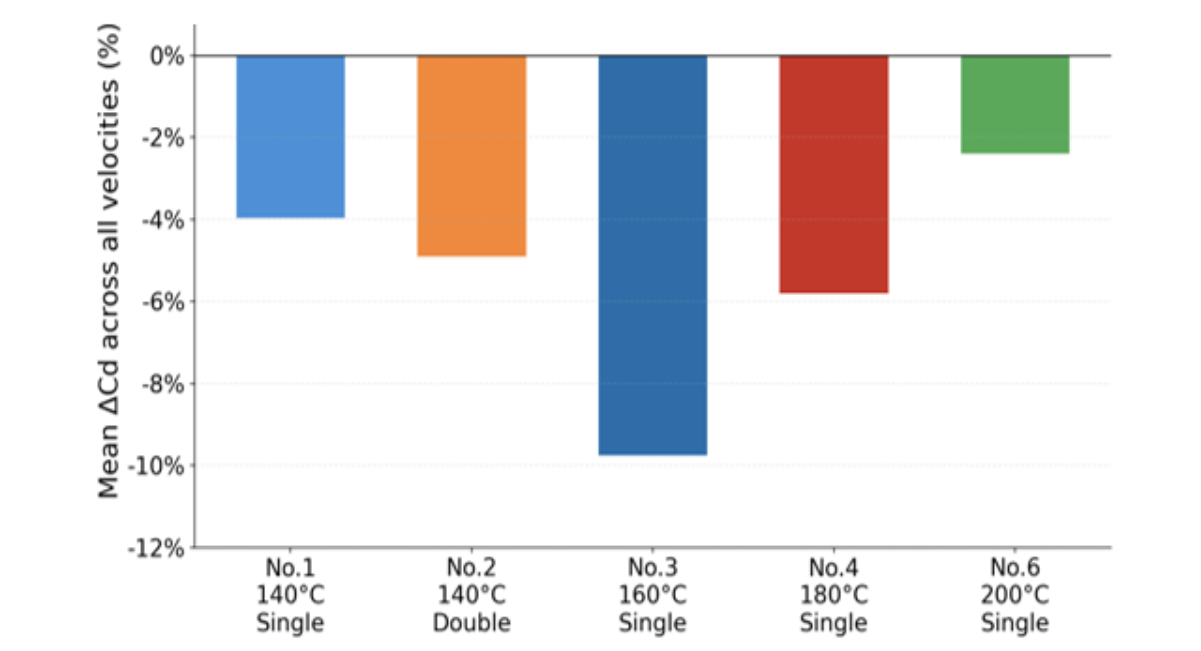
Figure 9: Mean Δcd (%) Relative to No.5, Averaged Across All Flow Velocities (7–11 M/S), For Each Heat-Treated Specimen in the Airfoil-Type Model. No.3 (160°C Single-Side) Showed the Largest Overall Mean Reduction
LIMITATIONS
This study has several limitations. Most importantly, only one independently prepared specimen was available for each heat-treatment condition; therefore, the three repeated measurements characterize technical measurement repeatability rather than specimen-to-specimen manufacturing variability, and the observed differences cannot be generalized as treatment effects without confirmation using independently manufactured replicate specimens. In addition, because fiber composition, weave structure, mass per unit area, air permeability, and surface roughness were not characterized for the specimens, this lack of material-level characterization further constrains mechanistic interpretation of the results. First, although the standard deviation of the repeated measurements is presented as error bars, statistical significance testing — confidence intervals, analysis of variance, and post-hoc tests — was not performed. Second, deviation among repeated measurements was observed in some conditions; in particular, the 7–8 m/s condition for airfoil-type No.1 and the 11 m/s condition for cylinder No.5 require cautious interpretation of the mean value. Third, because this study was a wind-tunnel experiment based on simplified models, it does not directly reflect actual wearing conditions, changes in body curvature, posture changes during running, or the effects of garment tension and wrinkling. Given these limitations, the results of this study are meaningful as preliminary comparative data, but caution is needed in applying the absolute values directly to actual competition conditions.
From a practical standpoint, fabric heat-treatment condition may serve as a new design variable for the aerodynamic optimization of sprinter skinsuits, and a panel-differentiation strategy — applying different conditions to cylindrical regions such as the thigh and calf versus streamlined regions such as the trunk — appears feasible. The condition-specific Cd reductions identified in this study suggest a potential design margin that could contribute to improved race times, providing a rationale for shifting toward manufacturing-process-centered aerodynamic design. Future studies should extend these findings quantitatively through statistical significance testing and analysis of material-property changes before and after heat treatment; validation under actual wearing conditions will also be an essential next step toward practical application.
CONCLUSION
This study systematically compared the aerodynamic performance of six sprintwear fabric specimens, differing in heat-treatment temperature and the number of treated surfaces, using cylinder and airfoil-type models under flow conditions corresponding to the top-speed range of sprinters (7–11 m/s). By treating a manufacturing-process variable directly as an evaluation axis for aerodynamic design, this exploratory study extends the scope of competition-apparel material evaluation from a fabric-property-centered approach toward a flow-based approach.
Marked descriptive differences in Cd were observed among the tested heat-treatment specimens in the airfoil-type model, with nominal reductions of up to approximately −20.4% (No.4, 9 m/s) and −15.1% (No.3, 10–11 m/s) relative to the untreated fabric, while the corresponding change remained within ±3% in the cylinder model. However, because each condition was represented by a single independently prepared specimen, these differences should be regarded as preliminary and descriptive rather than as confirmed treatment effects. This geometry dependence suggests that the effect of heat treatment interacts with the geometry-specific contribution of pressure and friction drag rather than acting as a simple, uniform surface change, pointing to a need for region-specific, condition-tailored design in sprint competition apparel. No single heat-treatment condition consistently produced the lowest Cd across all conditions tested; rather than a shortcoming, this indicates that optimization of heat-treatment condition is a multivariable problem combining local geometry, flow velocity, and flow state, within which No.3 and No.4 represent meaningful candidate conditions for further investigation.
DATA AVAILABILITY STATEMENT
The data supporting the findings of this study are available from the corresponding author upon reasonable request.
FUNDING
The author received no specific funding for this work.
CONFLICT OF INTEREST
The author declares no competing interests.
ETHICAL CONSIDERATIONS
This study involved wind-tunnel testing of fabric specimens on inanimate cylinder and airfoil-type models and did not involve human or animal subjects; ethics committee approval was therefore not applicable.
REFERENCES
- Brownlie LW, Kyle CR. Evidence that skin suits affect long track speed skating performance. Procedia Eng. 2012;34:26-31. [Crossref] [Google Scholar]
- Brownlie LW, Kyle CR, Harber E, MacDonald R, Shorten M. Reducing the aerodynamic drag of sports apparel: development of the NIKE Swift sprint running and SwiftSkin speed skating suits. In: Hubbard M, Mehta R, Pallis J, editors. The Engineering of Sport 5. Sheffield: International Sports Engineering Association; 2004. p. 90-96. [Google Scholar]
- Oggiano L, Brownlie L, Troynikov O, Bardal LM, Sæter C, Sætran L. A review on skin suits and sport garment aerodynamics: guidelines and state of the art. Procedia Eng. 2013;60:91-98. [Crossref] [Google Scholar]
- Chowdhury H, Alam F, Mainwaring D, Subic A. Design and methodology for evaluating aerodynamic characteristics of sports textiles. Sports Technol. 2009;2(3-4):81-86. [Crossref] [Google Scholar]
- Chowdhury H, Alam F, Subic A. Aerodynamic performance evaluation of sports textile. Procedia Eng. 2010;2(2):2517-2522. [Crossref] [Google Scholar]
- Chowdhury H, Alam F, Mainwaring D. Aerodynamic study of ski jumping suits. Procedia Eng. 2011;13:376-381. [Crossref] [Google Scholar]
- Moria H, Chowdhury H, Alam F, Subic A. Aerodynamic behaviour of stretchable sports fabrics. Sports Technol. 2011;4(3-4):171-177. [Google Scholar]
- Moria H, Alam F, Chowdhury H, Subic A. The compression effect on aerodynamic properties of sports fabrics. Procedia Eng. 2012;34:56-61. [Crossref] [Google Scholar]
- Kataoka Y, Hasegawa H, Murakami M, Seo K, Obayashi S. Flow behavior caused by air permeability of ski jumping suit fabric. Proceedings. 2020;49(1):109. [Crossref] [Google Scholar]
- Hsu XY, Lin WR, Lin TS, Chuang CC, Yang SH, Su YS, et al. A study of drag reduction with textile roughness on a cyclist model. J Text Inst. 2022;113(6):1171-1176. [Crossref] [Google Scholar]
- Jiang W, Qiu J, Ma G, Weng D, Zhang J, Liu L. An experimental investigation and flow field analysis on cycling clothing fabrics with grooved surface. J Ind Text. 2022;52:1-16. [Crossref] [Google Scholar]
- Esfahani VN, Rajavarothayam V, Quan K, Hanson R, Lavoie P. Effect of roughness and trips on the drag of a circular cylinder at subcritical flow. J Wind Eng Ind Aerodyn. 2024;253:105847. [Crossref] [Google Scholar]
- Messiry ME, Mohamed A. Aerodynamic analysis of single jersey knitted fabrics with slub yarn influence on air drag behavior. Discov Mater. 2025;5:257. [Google Scholar]
- Hirata K, Okayama T, Teraoka T, Funaki J. Precise aerodynamics measurements of a track runner using a wind-tunnel moving-belt system. Procedia Eng. 2012;34:32-37. [Crossref] [Google Scholar]
- Brownlie LW, Aihara Y, Carbo J, Harber E, Henry R, Ilcheva I, et al. The use of vortex generators to reduce the aerodynamic drag of athletic apparel. Procedia Eng. 2016;147:20-25. [Crossref] [Google Scholar]

Article Processing Timeline
| 2-5 Days | Initial Quality & Plagiarism Check |
| 25-35 Days |
Peer Review Feedback |
| 45-60 Days | Total article processing time |
EDITORIAL & PUBLICATION INFORMATION
| English | Publication Language |
| Single-Blind | Peer-Review Model |
| 17% | Acceptance Rate |
| <18% | Similarity Screening Guideline |
| Open Access | Access Model |
All manuscripts undergo editorial assessment and originality screening as part of the journal's evaluation process. The acceptance rate shown is based on journal-level editorial data and may change over time. Similarity reports are assessed editorially and are not interpreted solely on the basis of a numerical similarity score.
Why Publish with us?
Ethics & Policies
Editorial & Management
Useful Links
Journal Highlights
Open Access Journals
Journal Flyer