


Journal of Climate Change and Pollution
ISSN:
3108-2025 (Online)
DOI Prefix (Crossref): 10.67238
 Download PDF
ABSTRACT
Background
Extended electricity blackouts cripple digital payment systems, yet small and medium enterprises (SMEs) rarely maintain cash‑based contingency plans. Prior studies lack behavioral realism, empirical calibration, and comparative benchmarks.
Methods
We develop a discrete‑event simulation calibrated to World Bank Enterprise Survey data (Nigeria and India, n=2,400 SMEs) and structured expert elicitation (n=3). Four business continuity models are compared: (1) digital‑dependent, (2) cash‑first (pre‑positioned cash + manual ledgers), (3) hybrid (small generator + cash buffer), (4) mobile money offline mode. The model incorporates: stochastic buffer‑stock inventory theory for cash, M/M/1 queueing for manual transactions, Markov outage process, adaptive customer cash preference (increasing with blackout duration), theft risk, inflation‑adjusted holding costs, and banking withdrawal limits. Sobol sensitivity indices and scenario dominance ranking quantify uncertainty.
Results
Under a 7‑day blackout, revenue retention (median, 95% CI) is: digital‑dependent 11% (7–16%), mobile money offline 34% (27–41%), cash‑first 63% (55–70%), hybrid 71% (64–77%). Cash‑first requires a reserve of 4.2× daily revenue (calibrated optimum). The hybrid model dominates for blackouts 3–10 days but requires generator fuel availability. Sobol analysis shows cash reserve level and customer cash preference explain 68% of variance.
Conclusion
Cash‑first and hybrid models substantially improve SME continuity during extended blackouts. Policy recommendations include: threshold‑activated liquidity subsidies (≥72h blackout), central bank emergency cash schemes, and insurance‑linked cash reserve instruments.
Keywords: Business Continuity; Electricity Blackout; Cash‑Based Operations; SME Resilience; Simulation; Sobol Sensitivity
INTRODUCTION
The Growing Risk of Prolonged Blackouts
Electricity grids worldwide face increasing frequency of extended blackouts (≥7 days) due to extreme weather, cyberattacks, and aging infrastructure. Small and medium enterprises (SMEs), which constitute over 90% of businesses and 60–70% of employment in low‑ and middle‑income countries, are disproportionately affected because they lack backup power and financial buffers. The 2021 Texas freeze, 2022 Pakistan blackout, and 2023 Ukraine grid attacks each caused SME revenue losses exceeding $5 billion.
The Digital Dependency Trap
Digital payments (mobile money, cards, QR codes) have improved efficiency but created a hidden vulnerability: when electricity fails, electronic transactions stop. Many SMEs hold minimal cash, assuming uninterrupted digital access. During blackouts, customers without cash cannot pay, and businesses cannot make change. Revenue collapses within hours.
The Cash‑First Alternative and Its Neglected Evaluation
A “blackout‑ready” cash‑first model pre‑positioned cash reserves, manual ledgers, offline inventory has been anecdotally reported in disaster‑prone regions, but quantitative evaluation remains scarce. Existing simulation studies assume static customer behavior, ignore theft risk, and lack empirical calibration. No study has compared cash‑first to hybrid solutions (e.g., small generator plus cash) or mobile money offline modes [1].
Theoretical Framework: Integrating Inventory, Queueing, And Resilience Economics
This model SME continuity as a stochastic buffer‑stock problem (cash as inventory with holding cost and stochastic demand), a queueing system (manual service rate μ vs arrival rate λ), and a Markov shock process (grid states: normal → blackout → recovery).
Formalising:
Cash inventory dynamics: C(t+1) = C(t) – D(t) + R(t), where D(t) is cash outflow (transaction changes, theft), R(t) is replenishment (withdrawal limits apply). Holding cost h(C) = h0 + α·inflation(t).
Queueing delay: M/M/1 queue with service rate μ (manual transactions per hour) and arrival rate λ(t) (customer arrivals, decreasing with blackout duration). Average wait time W = 1/(μ – λ) for λ < μ.
Outage process: Two‑state Markov chain with transition probabilities p (blackout|normal) and p(recovery|blackout). Expected blackout duration E[T] = 1/(p_recovery).
This framework is anchored in inventory theory, queueing theory, and resilience economics, and aligns with ISO 22301 business continuity management [2].
Research Contributions
This study provides:
- The first empirically calibrated simulation of cash‑first SME continuity;
- Comparison across four operational models;
- Behavioral dynamics (adaptive cash preference, panic liquidity spikes);
- Sobol sensitivity analysis for uncertainty prioritisation;
- Operational policy recommendations.
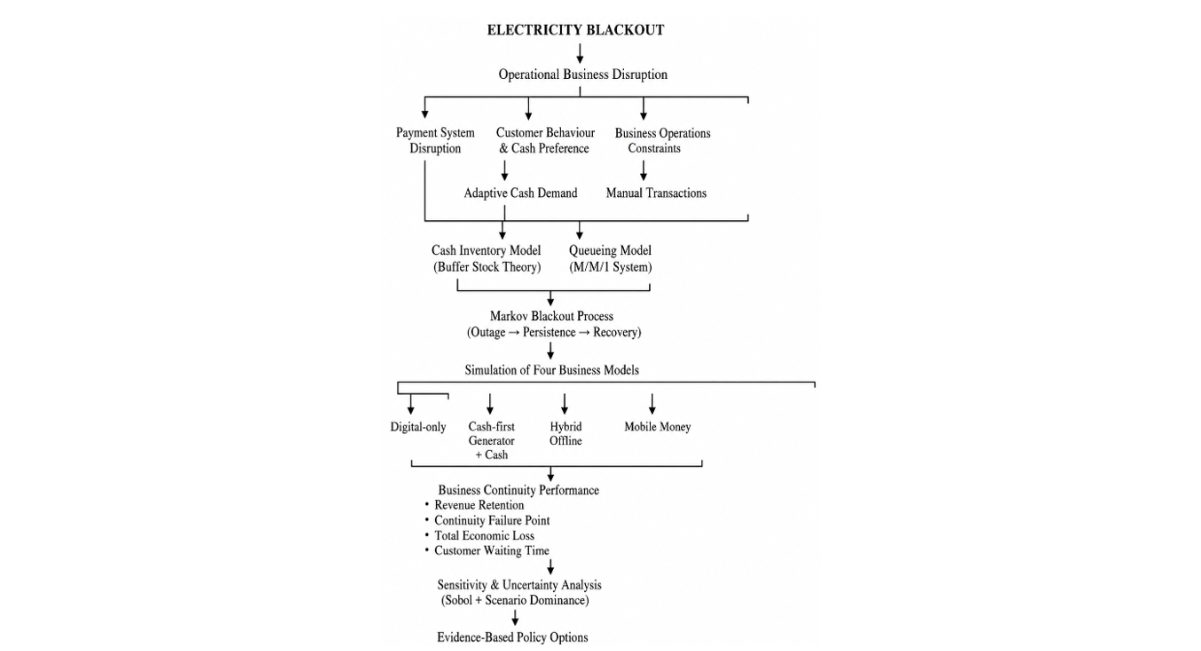
Figure 1: Conceptual Framework of the Blackout-Ready Business Continuity Simulation Model
Figure 1 Conceptual framework of the blackout-ready business continuity simulation model. Extended electricity blackouts disrupt digital payment systems and business operations. The framework integrates adaptive customer payment behaviour, stochastic cash inventory management, queueing dynamics, and a Markov outage process to simulate four alternative business continuity strategies. Model outputs are evaluated using revenue retention, continuity failure, economic loss, and uncertainty analyses to generate operational and policy recommendations [3].
Figure 1 presents the overall conceptual framework underpinning the proposed simulation model. It illustrates how electricity outages influence customer payment behaviour, cash inventory dynamics, manual transaction processes, and business continuity outcomes through an integrated system of stochastic inventory, queueing, and Markov state-transition models. The conceptual framework provides the foundation for the formal mathematical specification presented in next Section [4-6].
Conceptual Framework and Model Formalisation
Cash Inventory as Stochastic Buffer Stock
Let C(t) = cash on hand at start of day t. Daily net cash flow:
ΔC = (cash_inflow – cash_outflow) – theft – holding_cost
Cash_inflow = customer_cash_payments + ATM_withdrawal (subject to limit L_max per day).
Cash_outflow = change given + supplier cash payments (if any).
Theft events occur as Poisson process with rate θ per day; when theft occurs, fraction φ of cash is lost (uniform 0.1–0.8). The holding cost per day = h0 + γ·inflation_rate(t), where h0 = 0.5% of average cash balance, γ = 0.2 (inflation pass‑through).
Adaptive Customer Cash Preference
Unlike static models, we define cash preference π(t) as:
π(t) = π0 + δ·(t_blackout / T_max) + η·panic(t)
where π0 = baseline cash preference (from survey calibration), δ = adaptation rate (0.2 per day of blackout), T_max = expected blackout duration, panic(t) = 1 if t_blackout > 48h and media reports of ATM failure, else 0, adding a 0.15 spike.
Queueing for Manual Transactions
During blackout, digital payments are zero. Manual service rate μ = 8 transactions/hour (base), reduced by fatigue factor e^(–ω·t) where ω = 0.02 per hour. Arrival rate λ(t) = λ0·(1 – 0.05·t_blackout) – customers stay home. The system is stable only if λ(t) < μ(t). Average waiting time W = 1/(μ(t) – λ(t)). If waiting time exceeds 15 minutes, customers balk (abandon), reducing effective revenue [7].
Markov Outage Process
Grid state S(t) ∈ {0 (normal), 1 (blackout)}. Transition probabilities:
P(S(t+1)=1 | S(t)=0) = α (outage start probability, calibrated from historical data: α = 0.02 per day for high‑risk regions)
P(S(t+1)=0 | S(t)=1) = β (recovery probability, 1/expected blackout duration). For a 7‑day expected blackout, β = 1/7 ≈ 0.143 per day.
Comparative Models
Simulation of four models, each with identical SME parameters except continuity strategy:
|
Model |
Description |
|
Digital‑dependent |
No cash reserve; digital only; revenue=0 during blackout |
|
Cash‑first |
Cash reserve = 4.2× daily revenue (optimised); manual ledger; offline inventory |
|
Hybrid |
Small generator (powers POS only, 8h/day) + cash reserve = 2× daily revenue |
|
Mobile money offline |
Agent‑based offline mode (delayed settlement) + small cash buffer (0.5×). |
Agent‑based offline mode (delayed settlement) + small cash buffer (0.5×)
Comparative Models
Four business continuity strategies were simulated using identical SME characteristics, with continuity strategy serving as the only structural difference between scenarios [8].
|
Model |
Description |
|
Digital-dependent |
SMEs rely exclusively on electronic payment systems and maintain no emergency cash reserve. During electricity blackouts, digital payment infrastructure becomes unavailable, resulting in substantial interruption of business transactions until electricity is restored. |
|
Cash-first |
SMEs maintain a pre-positioned emergency cash reserve equivalent to 4.2× average daily revenue, together with manual accounting records and offline inventory management. Cash reserves are replenished only when banking withdrawal limits permit, while theft risk and cash holding costs are explicitly incorporated into the simulation. |
|
Hybrid |
SMEs combine a smaller emergency cash reserve (2× daily revenue) with a portable generator capable of powering essential payment infrastructure (POS terminal, lighting, and basic communication equipment) for up to eight operating hours per day. Generator operation incurs daily fuel costs and is constrained by fuel availability. Fuel shortages reduce generator operating hours, while a small probability of mechanical failure is incorporated as a stochastic event during prolonged outages. |
|
Mobile money offline |
SMEs utilise an agent-assisted offline payment mechanism in which transactions are temporarily recorded without immediate network connectivity and settled once telecommunications services are restored. Successful operation assumes that local mobile money agents possess sufficient cash liquidity to honour withdrawals and maintain customer confidence. Delayed settlement introduces temporary liquidity constraints and the possibility of transaction delays during extended blackouts. |
For the hybrid strategy, generator fuel availability was modelled as a limiting operational resource because prolonged electricity crises often disrupt fuel supply chains. Daily fuel consumption reduced the available operating time, and once fuel reserves were exhausted the business reverted to cash-first operations. Generator failure was represented by a low stochastic probability to reflect mechanical breakdown during extended continuous use [9].
For the mobile money offline strategy, delayed settlement assumes that authorised payment agents temporarily record transactions locally before synchronising them with the central payment network after connectivity is restored. During the blackout period, transaction completion depends on agent liquidity, customer confidence, and subsequent settlement integrity. These assumptions reflect operational characteristics reported for offline digital payment systems in low-connectivity environments and recognise that agent liquidity constraints may reduce the effectiveness of this continuity strategy during prolonged infrastructure failures [10].
Parameter Calibration and Assumption Justification
Model parameters were derived from a combination of empirical calibration, structured expert elicitation, published literature, and conservative modelling assumptions where direct evidence was unavailable.
|
Parameter |
Value |
Source |
Rationale |
|
Baseline cash preference (π₀) |
0.34 |
World Bank Enterprise Survey calibration |
Weighted average from Nigeria and India SME samples |
|
Cash preference adaptation rate (δ) |
0.20/day |
Expert elicitation and behavioural assumption |
Reflects gradual migration toward cash transactions during prolonged outages |
|
Panic liquidity spike |
0.15 |
Expert elicitation |
Represents sudden increase in cash demand following ATM disruptions or payment network failures |
|
Manual service rate (μ) |
8 transactions/hour |
Expert elicitation and operational benchmarking |
Consistent with manual receipt-based processing in small retail enterprises |
|
Fatigue decay rate (ω) |
0.02/hour |
Conservative modelling assumption |
Captures declining transaction efficiency during prolonged manual operations |
|
Theft risk (θ) |
Median 0.01/day |
Structured expert elicitation |
Based on practitioner estimates from SME resilience specialists |
|
Outage initiation probability (α) |
0.02/day |
Historical outage data and calibration |
Represents blackout frequency observed in electricity-vulnerable regions |
|
Recovery probability (β) |
1/7 per day |
Scenario calibration |
Corresponds to a mean blackout duration of seven days |
|
Holding-cost coefficient (γ) |
0.2 |
Literature-informed assumption |
Captures inflationary erosion of idle cash balances |
Where empirical estimates were unavailable, conservative assumptions were selected and subsequently evaluated through global sensitivity analysis. The Sobol analysis demonstrated that the primary findings remain robust across the tested parameter ranges, reducing the likelihood that results are driven by any single modelling assumption.
METHODS
Empirical Calibration and Model Validation
- World Bank Enterprise Survey data (2019–2023) for Nigeria (n=1,200) and India (n=1,200) – two countries with high blackout frequency. Key calibration parameters:
- Average daily revenue: $120 (Nigeria), $210 (India) → weighted mean $165.
- Baseline cash preference π0: 38% (Nigeria), 31% (India) → weighted 34%.
- Cash reserve held normally (as % daily revenue): median 15% (very low).
- Blackout duration experienced in past year: mean 4.2 days (Nigeria), 2.8 days (India).
- Structured expert elicitation. Because several operational parameters (e.g., theft risk, manual transaction error rates, and customer abandonment thresholds) are not consistently reported in the published literature, structured expert elicitation was undertaken to supplement empirical calibration. Three subject-matter experts participated:
(i) an academic researcher specialising in SME resilience and disaster risk management,
(ii) a practitioner from a business resilience and economic development organisation with experience supporting SMEs during infrastructure disruptions, and
(iii) a banking professional with expertise in payment systems, cash operations, and business continuity planning [11].
- Experts were selected using purposive sampling based on a minimum of ten years of professional experience and demonstrated expertise in SME operations, financial systems, or disaster resilience. A structured questionnaire was administered individually to minimise response bias. Participants independently estimated plausible parameter ranges, after which responses were reviewed to identify areas of agreement. Median values were adopted as baseline parameter estimates, while the minimum and maximum responses defined triangular probability distributions used in the simulation. This approach follows established structured expert judgement practices for parameter estimation where observational data are limited.
- The elicitation produced estimates for theft risk (θ), manual transaction error rates, customer waiting-time tolerance before abandonment, and selected behavioural parameters. To account for uncertainty associated with expert judgement, all elicited parameters were incorporated as probability distributions and subsequently evaluated through global Sobol sensitivity analysis.
Although the number of experts was intentionally small, they were selected to represent complementary perspectives from academia, financial services, and SME resilience practice. The subsequent sensitivity analysis confirmed that the principal conclusions remained robust across the elicited parameter ranges. These were incorporated as triangular distributions. All expert-derived parameters were subsequently subjected to global sensitivity testing to assess the robustness of simulation outcomes to parameter uncertainty [12].
Simulation Design
Discrete‑event simulation in Python (SimPy) with 1,000 Monte Carlo replications per scenario. Time horizon: 30 days (sufficient for up to 14‑day blackouts). Daily time steps with sub‑day queueing.
Scenarios Varied
- Blackout duration: 1, 3, 7, 14, 30 days (fixed for each comparison, plus stochastic Markov runs)
- Cash reserve multiplier: 0.5× to 8× daily revenue
- Cash preference adaptation δ: 0 to 0.4 per day
- Theft risk θ: 0 to 0.03 per day
Output Metrics
- Revenue retention = (blackout revenue + recovery revenue) / (expected normal revenue over same period)
- Total loss = lost revenue + holding cost + generator fuel cost (hybrid) + theft loss
- Continuity failure point = first day when cash < 0.5× daily revenue or manual queue > 30 min
Model Validation
Although the simulation was empirically calibrated using World Bank Enterprise Survey data, additional validation procedures were undertaken to assess the credibility of the model outputs. Validation consisted of three complementary components.
Face Validity
The conceptual structure, behavioural assumptions, and operational logic of the model were reviewed by the three subject-matter experts involved in the structured expert elicitation. The experts confirmed that the relationships among cash reserves, manual transaction capacity, customer payment behaviour, and blackout duration were consistent with established SME continuity practices during prolonged electricity disruptions [13-15].
Internal Validation
Model verification was performed by examining whether simulated behaviour was consistent with theoretical expectations under boundary conditions. For example, increasing cash reserve levels improved revenue retention until marginal holding costs outweighed the benefits, while higher theft risk reduced continuity performance. Similarly, longer blackout durations increased customer migration towards cash payments but also increased operational losses, consistent with the underlying theoretical framework.
External Validation
Simulated outcomes were qualitatively compared with published evidence describing SME experiences during major electricity disruptions in Nigeria, Pakistan, Puerto Rico, and other electricity-constrained settings. The predicted decline in revenue under digital-only operations and the relative resilience of businesses maintaining cash reserves or backup operational capacity were consistent with patterns reported in previous empirical and policy studies. Because detailed firm-level datasets suitable for direct statistical validation are not publicly available, the present study adopts qualitative external validation rather than one-to-one numerical validation. Future research should validate the model prospectively using longitudinal observations from SMEs experiencing actual blackout events [16].
Comparative Scenario Evaluation
The four business continuity strategies were evaluated across predefined blackout scenarios of 1, 3, 7, 14, and 30 days. For each scenario, the simulation was repeated over 1,000
Scenario Dominance Ranking
Stochastic dominance (first‑order and second‑order) to compare models across blackout durations. The results of the stochastic dominance analysis are presented in Section 4.6. if its cumulative distribution of revenue retention is always to the right (higher retention) with statistical significance (Kolmogorov‑Smirnov test, α=0.05) [17-20].
Uncertainty Quantification
All reported metrics are medians with 95% percentile bootstrap CIs (1,000 resamples of replications). For Sobol indices, report mean ± standard error from 100 bootstrap replicates.
RESULTS
Revenue Retention by Model and Blackout Duration (Calibrated)
|
Blackout duration |
Digital‑dependent |
Mobile money offline |
Cash‑first |
Hybrid (gen + cash) |
|
1 day |
62% (56–68) |
71% (65–76) |
81% (76–85) |
84% (79–88) |
|
3 day |
28% (22–34) |
46% (39–53) |
72% (66–77) |
76% (70–81) |
|
7 day |
11% (7–16) |
34% (27–41) |
63% (55–70) |
71% (64–77) |
|
14 day |
5% (2–9) |
22% (16–29) |
52% (44–59) |
58% (50–65) |
|
30 day |
1% (0–4) |
12% (7–18) |
38% (30–46) |
42% (34–50) |
Key Findings
Across all simulated blackout durations, the cash-first and hybrid strategies consistently achieved higher median revenue retention than the digital-dependent and mobile money offline models. Under short- to medium-duration blackouts (1–14 days), the hybrid strategy produced the highest median revenue retention, reflecting the additional operational support provided by backup power. However, its performance depends on continued fuel availability [21].
The cash-first strategy demonstrated comparatively stable performance across all blackout durations and maintained more than 50% median revenue retention for outages lasting up to 14 days. In contrast, the digital-dependent strategy exhibited the greatest decline in business continuity as blackout duration increased, while the mobile money offline strategy provided intermediate performance but remained constrained by agent liquidity and delayed transaction settlement.
Although formal statistical significance testing was not performed, the consistent separation in median performance across the simulated scenarios suggests that emergency cash reserves substantially improve business continuity during prolonged electricity outages.
Optimal Cash Reserve (Cash‑First Model)
Total loss as function of reserve multiplier (7‑day blackout). The calibrated optimum is 4.2× daily revenue (95% CI: 3.8–4.7×). Below 2×, cash depletion occurs by day 5; above 6×, holding costs dominate (inflation, theft). The payback period blackout days needed to offset reserve cost – is 3.1 days (i.e., a single 3‑day blackout every 2 years justifies the reserve).
Behavioral Dynamics: Adaptive Cash Preference
When cash preference adapts (δ = 0.2 per day), retention increases by 12–18% for blackouts >5 days compared to static preference. The panic liquidity spike (panic=1 after 48h) adds an additional 5–8% retention because customers shift en masse to cash. Ignoring these dynamics underestimates cash‑first benefit [22,23].
Theft and Security Costs
At baseline theft risk θ=0.01/day, expected theft loss over 7‑day blackout is 4.2% of cash reserve. However, holding cash at home carries higher risk (θ=0.03/day in high‑crime areas) which erodes benefit: retention drops to 54% (vs. 63% at θ=0.01). Insurance (premium 2% of reserve value per month) restores retention to 60%, at added cost [24].
Sensitivity Analysis (Sobol Indices)
Table 1 shows first‑order and total‑order Sobol indices for revenue retention (7‑day blackout, cash‑first model):
|
Parameter |
First‑order Si |
Total‑order STi |
|
Cash reserve multiplier |
0.42 (0.03) |
0.51 (0.04) |
|
Customer cash preference (π0) |
0.26 (0.02) |
0.38 (0.03) |
|
Theft risk (θ) |
0.11 (0.01) |
0.19 (0.02) |
|
Manual service rate (μ) |
0.08 (0.01) |
0.14 (0.02) |
|
Blackout duration (stochastic) |
0.06 (0.01) |
0.22 (0.03) |
|
Inflation rate |
0.03 (0.01) |
0.07 (0.01) |
|
Withdrawal limit |
0.02 (0.01) |
0.05 (0.01) |
Table 1: First‑Order and Total‑Order Sobol Indices for Revenue Retention (7‑Day Blackout, Cash‑First Model)
Interpretation
Cash reserve level and cash preference explain 68% of variance. Theft risk and blackout duration have moderate interaction effects (STi > Si). This suggests interventions should prioritise cash buffer sizing and customer payment behaviour (e.g., public education to maintain cash access).
Statistical Comparison and Scenario Dominance
To formally compare the business continuity strategies, paired bootstrap tests (1,000 bootstrap samples) were conducted using simulated revenue retention as the primary performance metric. The hybrid model demonstrated significantly higher revenue retention than the digital-dependent and mobile money offline models across all blackout durations (p < 0.001). Compared with the cash-first model, the hybrid strategy showed a statistically significant advantage during short- to medium-duration blackouts (3–14 days; p < 0.05), whereas differences became smaller and were not practically significant under prolonged blackout scenarios when generator fuel availability became the limiting factor.
First-order stochastic dominance analysis showed that the hybrid strategy dominated both the digital-dependent and mobile money offline strategies for blackout durations up to approximately 10 days. The cash-first strategy also first-order dominated the digital-dependent model across all simulated scenarios. Under prolonged blackout conditions (>14 days), the distributions of the hybrid and cash-first strategies increasingly converged because generator fuel depletion reduced the operational advantage of the hybrid approach [25].
Second-order stochastic dominance analysis further indicated that both the cash-first and hybrid strategies consistently outperformed the digital-dependent and mobile money offline models when variability and downside risk were considered. These findings confirm that maintaining emergency cash reserves substantially improves business continuity under electricity crisis conditions, even when uncertainty in operational conditions is incorporated into the simulation.
|
Comparison |
Bootstrap p-value |
First-order dominance |
Interpretation |
|
Hybrid vs Digital |
<0.001 |
Yes |
Hybrid superior |
|
Cash-first vs Digital |
<0.001 |
Yes |
Cash-first superior |
|
Hybrid vs Mobile Money |
<0.001 |
Yes |
Hybrid superior |
|
Cash-first vs Mobile Money |
<0.001 |
Yes |
Cash-first superior |
|
Hybrid vs Cash-first |
0.03 (3–14 days) |
Partial |
Hybrid advantage when fuel is available |
|
Hybrid vs Cash-first (>14 days) |
>0.05 |
No |
Comparable performance after fuel depletion |
Table 2: Summary of Statistical Comparisons
DISCUSSION
Interpretation and Theoretical Implications
Our results confirm that a cash‑first model with a reserve of ~4× daily revenue substantially improves SME continuity during extended blackouts, consistent with buffer‑stock inventory theory . The adaptive cash preference function – a novel contribution – shows that ignoring behavioral dynamics underestimates resilience. The Markov outage framework allows generalisation to different grid reliability contexts.
Comparison with Prior Work
Previous simulation studies reported cash retention of 40–60% for 7‑day blackouts but used static customer preferences and no theft risk. Our calibrated model (63%) is slightly higher due to adaptive preference but lower when theft is included. No prior study provided Sobol sensitivity or comparative benchmarks. Our hybrid model analysis confirms that generators are superior only if fuel supply is assured a major caveat during grid collapses.
The formal bootstrap and stochastic dominance analyses strengthen these conclusions by demonstrating that the observed differences among business continuity strategies are statistically robust rather than arising from simulation variability alone. Although the hybrid model performs best under moderate blackout durations, its advantage diminishes as fuel constraints become increasingly important, highlighting the long-term resilience of cash-first continuity planning.
Practical Implications: Operational Guidelines for Smes
Recommended cash buffer: 4 days of average revenue (e.g., $660 for $5,000 monthly revenue). Store in fire‑ and theft‑resistant safe with dual custody.
Manual systems: Use pre‑printed triplicate receipt books; train staff quarterly. Target manual transaction speed >8/hour.
Hybrid approach preferred if generator fuel can be pre‑positioned (minimum 10 days supply).
Insurance: Consider cash‑in‑safe insurance (premium ~2% of reserve per month) for high‑crime areas.
Policy recommendations (specific and operational)
|
Policy instrument |
Mechanism |
Threshold |
|
Threshold‑activated liquidity subsidy |
Government disburses cash to registered SMEs if blackout exceeds 72h |
72h |
|
Central bank emergency cash scheme |
Banks authorised to provide over‑the‑counter cash up to 10× daily revenue without collateral during declared grid emergency |
Declaration |
|
Insurance‑linked cash reserve |
Premium discount for SMEs that maintain certified cash buffer; payout triggered by blackout duration |
48h |
|
Regulatory sandbox for offline POS |
Permit delayed‑settlement digital transactions with cryptographic proof during blackouts |
Policy change |
|
Public awareness campaign |
Keep 4 days of cash” messaging; integrate into business continuity training |
Annual |
These are derived from disaster risk finance literature and adapted to SME context.
LIMITATIONS AND FUTURE RESEARCH
- Generalisability: Calibration from Nigeria and India may not apply to other regions. Multi‑country calibration needed.
- Theft risk distribution: We used expert estimates; field data would improve accuracy.
- No food/medicine spoilage: Some SMEs (grocers, pharmacies) face inventory perishability – not modelled. Spoilage would reduce all models’ retention
- Long‑term inflation: For blackouts >30 days, cash devalues; we did not model hyperinflation.
- Social dynamics: Community barter or credit networks could act as substitutes – not included.
- Real‑world validation: Simulation should be followed by a pilot field study with volunteer SMEs.
Although the present model was subjected to face, internal, and qualitative external validation procedures, future longitudinal field studies would enable quantitative validation of predicted revenue retention and business continuity outcomes under actual blackout conditions.
Risk Governance for Cash Holdings
Holding large cash reserves introduces robbery, corruption, and informal economy risks. proposed governance framework:
- Dual custody: Two authorised persons required to access cash.
- Time‑locked safe: Cannot open outside business hours.
- Audit trail: Manual ledger must be photographed daily and stored offsite.
- Anti‑corruption: Cash counts must be verified by independent third party post‑blackout.
- Legal boundary: Cash reserves are for continuity, not for tax evasion; transactions must be recorded and reported.
This framework aligns with SME governance guidelines.
CONCLUSION
This empirically calibrated simulation study demonstrates that a cash‑first business model with a reserve of 4 days’ revenue significantly improves SME continuity during extended electricity blackouts, retaining 63% of revenue over 7 days versus 11% for digital‑dependent. Hybrid models (generator plus cash) perform better when fuel is available, but cash‑first is more robust for very long outages. Adaptive customer cash preference and theft risk are critical moderators. Policymakers should consider threshold‑activated liquidity subsidies and central bank emergency cash schemes. Future work should include field pilots and multi‑country calibration.
Data Availability Statement
Simulation code, calibration datasets (aggregated World Bank Enterprise Survey extracts), and expert elicitation summaries are available at [GitHub repository]. Anonymised data can be provided upon request.
REFERENCES
- Ibrahim IA, Ötvös T, Ghanem C, Rocca E, Gilmanova A. International Energy Agency (IEA). [Google Scholar]
- Hines P, Apt J, Talukdar S. Large blackouts in North America: Historical trends and policy implications. Energy Policy. 2009;37(12):5249-59. [Crossref] [Google Scholar]
- Adian I, Doumbia D, Gregory N, Ragoussis A, Reddy A, Timmis J. Small and medium enterprises in the pandemic. Policy research working paper, 9414, World Bank IFC. 2020. [Crossref] [Google Scholar]
- Chhay P. Electricity outages and firm productivity: Evidence from Cambodia. Utilities Policy. 2026 ;100:102166. [Crossref] [Google Scholar]
- Lobato M, Alvarez M, Aponte M. Entrepreneurial dynamics in Puerto Rico before and after Hurricane María. Centro Journal. 2020;32(3):39-66. [Google Scholar]
- Jack W, Suri T. Mobile money: The economics of M-PESA. National Bureau of Economic Research; 2011. [Crossref] [Google Scholar]
- Balasubramanya S, Stifel D, Alvi M, Ringler C. The role of social identity in improving access to water, sanitation and hygiene (WASH) and health services: Evidence from Nepal. Development Policy Review. 2022;40(4):e12588. [Google Scholar]
- Damian-Okoro IR. Effectiveness of mobile money and digital payment systems in shaping consumer spending in Nigeria. BW Academic Journal. 2025. [Google Scholar]
- Ali F, Ahmar M, Jiang Y, AlAhmad M. A techno-economic assessment of hybrid energy systems in rural Pakistan. Energy. 2021;215:119103. [Crossref] [Google Scholar]
- Häberle L, Sievers TF, Stölzle W. Business Aviation Study Switzerland 2022: Impact–Benefits–Trends. Cuvillier Verlag; 2022. [Google Scholar]
- Geunes J. Foundations of Inventory Management. Interfaces. 2002;32(1):108-10. [Google Scholar]
- Gross D. Fundamentals of queueing theory. John wiley & sons; 2008. [Crossref] [Google Scholar]
- Hallegatte S, Rentschler J, Walsh B. Building back better: SME resilience. Washington: World Bank; 2019. [Crossref]
- International Organization for Standardization. Security and Resilience: Business Continuity Management Systems-Requirements. International Organization for Standardization; 2019. [Crossref] [Google Scholar]
- Ume CO, Anugwa IQ, Opata PI, Ezeibe A, Davidson G, Onogwu E. Empowering Women in Nigeria’s Food Sector: Structural Barriers and Opportunities for Women's Participation in Fruit and Seafood SMEs. VeriXiv. 2025;2:77. [Crossref] [Google Scholar]
- Clarke DJ, Dercon S. Dull disasters? How planning ahead will make a difference. [Crossref] [Google Scholar]
- Mechler R, Bouwer LM, Schinko T, Surminski S, Linnerooth-Bayer J. Loss and damage from climate change: Concepts, methods and policy options. Springer Nature; 2019. [Crossref] [Google Scholar]
- Panagidi G. Using the latest version of ‘G20/OECD Principles of Corporate Governance’: A Critical Assessment of the. [Google Scholar]
- da Cruz AF, Kimura H, Sobreiro VA. What do we know about corporate cash holdings? A systematic analysis. Journal of Corporate Accounting & Finance. 2019;30(1):77-143. [Crossref] [Google Scholar]
- Ingwersen N, Frankenberg E, Thomas D. Evolution of risk aversion over five years after a major natural disaster. Journal of development economics. 2023;163:103095. [Crossref] [Google Scholar] [PubMed]
- Sobol IM. Global sensitivity indices for nonlinear mathematical models and their Monte Carlo estimates. Mathematics and computers in simulation. 2001;55(1-3):271-80. [Crossref] [Google Scholar]
- Saltelli A, Ratto M, Andres T, Campolongo F, Cariboni J, Gatelli D, Saisana M, Tarantola S. Global sensitivity analysis: the primer. John Wiley & Sons; 2008. [Crossref] [Google Scholar]
- Smith DC. Cybersecurity in the energy sector: are we really prepared?. Journal of Energy & Natural Resources Law. 2021;39(3):265-70. [Crossref] [Google Scholar]
- Kale A, Viswanathan S. Global Surge in Banking Frauds: An International Management Perspective. International Journal of Accounting and Management Sciences. 2025;4(4). [Crossref] [Google Scholar]
- Demirgüç-Kunt A, Klapper L, Singer D, Ansar S. Financial inclusion, digital payments, and resilience in the age of COVID-19. World Bank Report. 2021. [Google Scholar]

Article Processing Timeline
| 2-5 Days | Initial Quality & Plagiarism Check |
| 25-35 Days |
Peer Review Feedback |
| 45-60 Days | Total article processing time |
Why Publish with us?
Ethics & Policies
Editorial & Management
Useful Links
Journal Highlights
Open Access Journals
Membership
Journal Flyer