


Journal of Climate Change and Pollution
ISSN:
3108-2025 (Online)
DOI Prefix (Crossref): 10.67238
 Download PDF

Meteorologist, Eastern and Central Oromia Meteorological service center, Adama, Ethiopia
ABSTRACT
Introduction
Air pollution is a public health problem in cities, especially in developing countries like Ethiopia. Monitoring the levels of PM2.5 is very important in assessing air quality and its impact on human health. Low-cost sensors offer a promising solution for expanding air quality monitoring networks in resource-constrained settings. This study aims to evaluate the SENSIRIONSPS30 in the two cities, Addis Ababa and Adama with metrics commonly used and officially prescribed.
Materials and Methods
Two SENSIRIONSPS30, Air visual Pro (IQAV) and Gravimetric are being used in Addis Ababa and Adama meteorological stations, in Ethiopia. The quality of SENSIRIONSPS30 was evaluated within identical, with gravimetric reference, and between different types, with regression slope and R2, and other statistical metrics such as the Pearson correlation, bias, and accuracy were used. And temporal variations of PM2.5 over selected stations were conducted.
Results
The SENSIRIONSPS30 showed an R2 of 0.98 - 0.99, 0.97 – 0.99, and 0.60 – 0.99 during intra-sensor, reference, and inter sensor comparison. After the performance was checked for SENSIRIONSPS30, the temporal variation of PM2.5 over both stations was drawn.
Conclusion
This study helps to promote effective air quality monitoring solutions in developing countries and ultimately support efforts to improve public health and environmental sustainability.
Keywords: Air Pollution; Low-Cost Sensors; Particulate Matter; PM2.5; SENSIRIONSPS30
INTRODUCTION
Air pollution is one of the most significant health problems of our time. According to the World Health Organization (WHO), in 2016 air pollution was linked to over 4.2 million deaths (11.6% of total deaths) with mortality in low and middle-income countries particularly heavily affected by air pollution [1]. Because of the rapid industrialization and population growth in cities, the issue of air quality and its impact on human health is of great concern and is expected to worsen in the coming years [2-3].
Particulate matter is an environmental pollutant linked to various health problems. Particulate matter (PM2.5; particles that have an aerodynamic diameter less than 2.5μm) has been associated with respiratory illness, cardiovascular disease, stroke, lung cancer, reproductive issues, and early death [4-5].
According to existing research, the main causes of air pollution in Addis Ababa include transportation, the open burning of rubbish, using biomass-based fuels for space heating and cooking, and to a reduced extent industrial activity [6-7]. Currently, in the city, three operational reference-grade air quality monitoring stations for fine particulate matter (PM2.5), two were set up by the U.S. embassy in 2016, and a third monitoring station was established by the Eastern Africa GEO Health Hub in 2015. According to data from these stations, the city's air pollution continuously surpasses the World Health Organization's recommended limits for fine particulate matter, which are 15 μg/m3 24-hour mean [8].
Conventional measurement instruments, however, are expensive and demand power supply [9]. Due to their high price and large size, regulatory-grade instruments were used primarily for scientific research and not widely used. This is partly because this pricey equipment has been deployed seldom, which results in low spatial resolution, especially in low and middle-income countries of big cities [10].
Ambient air quality monitoring in Addis Ababa and Adama needs to be better developed, like in most African cities. This is mainly because most cities lack the necessary monitoring infrastructure and capacity to collect and analyze air quality data. For example, as of 2017, Ethiopia was still classified by the World Health Organization as being among the countries with no data on urban monitoring of ambient PM2.5 [11].
Recently, low-cost sensors have been gaining popularity as a tool to fill data gaps in air quality monitoring (AQM). These low-cost sensors are promising tools for the collection of air quality data with large spatial and temporal coverage [12]. LCS has been widely deployed in low- and middle-income countries, where they often provide air quality information in regions lacking the more traditional and expensive reference grade monitors [13].
Currently, there are air quality monitoring (AQM) stations in big cities of Ethiopia such as Addis Ababa, Adama, and Hawassa at their meteorological stations, but all are out of service. Those costly air qualities monitoring (AQM) measured the same values for specific pollutants, data were inconsistent and the instruments were not calibrated, therefore the measurement data were not used for analysis. The public can purchase numerous low-cost sensors that have undergone minimal testing, come with limited maintenance recommendations, and lack standard operating procedures [14-15]. Low-cost sensors are gaining popularity among researchers and the general public, but there are very few opportunities to test these sensors in low-income countries. For example, the SensirionSPS30 is tested in Arba Minch town [16]. The performance is promising, but it has not yet been tested in relatively larger cities in Ethiopia. Therefore, the aim of this study is, to evaluate the performance of SENSIRIONSPS30 for PM2.5 over Addis Ababa and Adama, Ethiopia.
Statement of Problem
Air pollution is a significant health hazard, especially because of PM2.5. The burden of air pollution is higher in low- and middle-income countries, like Ethiopia, for two reasons: indoor pollution rates tend to be high due to the dependence on solid fuels for cooking, and ambient air pollution will increase as countries industrialize and transform from low-to-middle incomes.
Low-cost sensors have become an increasingly important supplement to air quality monitoring networks, yet their performances have not been evaluated and tested under different weather conditions. Conventional measurement instruments, however, are expensive and depend on electric power supply [17-18]. There are not enough financial resources in developing countries such as Ethiopia to install conventional measurement instruments for wider spatial coverage. Meanwhile, cheaper instruments (LCSs) are promising, but their performances have not yet been tested in larger cities in Ethiopia.
Research Objectives
This study addresses these gaps through the following primary objectives:
- Evaluate the intra-sensor precision and internal repeatability of multiple Sensirion SPS30 units deployed simultaneously in urban settings.
- Determine the accuracy of the SensirionSPS30 against reference-grade gravimetric measurements (UPAS) during the Kiremt season.
- Compare the performance profiles of the SensirionSPS30 against alternative low-cost units like the IQAir Air Visual Pro.
- Characterize temporal variations and spatial distribution patterns of PM2.5 across Addis Ababa and Adama.
Evaluation of the performance of LCSs
Several (at least three) air sensors were placed alongside a reference-grade instrument for field-testing purposes. Many research studies assessed the accuracy of inexpensive sensors by placing them alongside a regulatory or high-quality monitor, without implementing extra calibration techniques [19]. Performance metrics are parameters used to describe how good an air sensor performs relative to a standard (typically a reference instrument). Several metrics are available to assist in comprehending an air sensor's performance and choosing the best sensor for our particular requirements.
Programs to evaluate sensors have been established by both the US EPA and the air quality sensor performance evaluation center (AQ-SPEC) of California’s South Coast Air Quality Management District [20].
The main criterion for evaluating the data quality measure for air pollution measurement methods, as indicated by the EU Air Quality Directive, is measurement uncertainty. However, it is difficult to measure this criterion and it is not included in the majority of sensor studies [21-22]. For the performance criteria used to evaluate air quality modeling applications, a set of statistical indicators includes the bias, coefficient of variation, standard deviation (SD), Pearson correlation, and correlation coefficient (R2) [23].
Accuracy and precision together refer to the ability of low-cost sensors to measure the correct value reliably each time. Precision refers to measuring the same thing every time and consistently. Accuracy refers to whether the sensor is measuring the correct or true value. Correlation measures how air sensor data relates to data from a reference instrument, which can be assessed for measurements over time or space.
MATERIALS AND METHODS
Description of study area
The sensor evaluations and data collection occurred at the Ethiopian Meteorology Institute (EMI), Addis Ababa, and the central and eastern regional meteorological centers, Adama. Addis Ababa is the largest city in Ethiopia in area and population. The city is located at latitude of 8.98 and a longitude of 38.75. Approximately 4.6 million people lived there in 2019, in an area of around 527 km 2 and with a population density of 5,165 per square kilometer [24]. The Addis Ababa Meteorological Station is located in the northern part of Addis Ababa, situated near the main road known as Gambia Street, Tikur Anbesa (Black Lion) Hospital, and commercial and residential areas.
Adama, with an estimated 214,000 residents is one of Ethiopia's cities that has been expanding rapidly [26]. It is located at latitude of 8.51 and longitude of 39.26 [25]. Adama Meteorological Station in Ethiopia is situated in the city of Adama, which is located in the Oromia region. The station is located near Adama Road, Adama University, and commercial and residential areas.
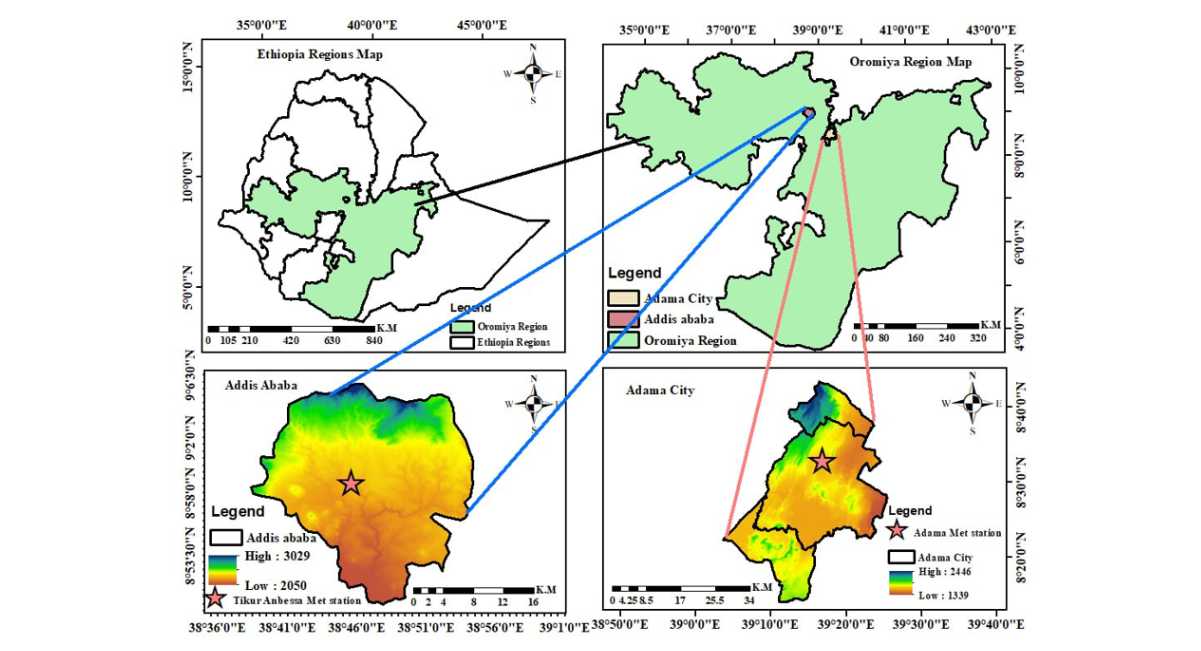
Figure: Map of the Study Area
Therefore, for this study, the SENSIRIONSPS30 set-up installations, data collection, and performance evaluations took place at both sites of the Meteorological Institute of Addis Ababa and Adama.
Materials
The fine particulate-matter sensors on the market chosen for this study were IQ Air Visual Pro and SPS30 (Sensirion, Switzerland). These sensors are chosen due to being widely used in many air purifiers and air quality monitoring devices, as well as their reliability, low price, compact size, and popularity [26-27].
Factors to consider for selecting SPS30 and IQAV
For this study, the following major criteria were supported for the selection of low-cost sensors of both SPS30 and IQAV, measurements of interest pollutant (PM2.5), certified, tested, and evaluated by the organization; their performance; simple installations and maintenance and low price.
In contrast to other inexpensive PM2.5 sensors, the SPS30 is built with advanced binning technologies and patented contamination-resistant technology to deliver more accurate data for a lifespan of over 10 years. The sensor performs self-cleaning, and no maintenance is required. SPS30 has an internal fan for sampling purposes and can measure the concentration of particles ranging from 1 to 1000 µg/m3. The device does not have storage and requires the use of a computer and manufacturer-provided software for operation. An external power source is required for operation as there is no internal battery. Furthermore, it does not assess temperature or relative humidity.
SENSIRIONSPS30 set up
The setup consists of different components, all of which are driven by an Arduino Microprocessor. As a PM2.5 sensor in the set-up, the SensirionSPS30 was used. This specific sensor has been part of some of the setups studied in laboratory circumstances or European cities [28-30]. In a preliminary field test by the South Coast Air Quality Management District (USA), an R2 of 0.83 was found between a reference instrument and the SPS30, and a cross-unit variability of 1.3% (South Coast Air Quality Management District). For this study, the data collection with the SENSIRIONSPS30, set-ups were done by connecting the SPS30, SD module to an Arduino mega microprocessor. An SD card was put into the SD module, the Arduino microprocessor was connected to the power bank, and the power bank was connected to an electricity source at both Addis Ababa and Adama Meteorological Institute stations. The SPS30 requires a 5V supply voltage +/-0.5V to provide correct output values; the SPS30 should be compatible with 3.3V I2C levels, so as long as the supply voltage is correct the SPS30 should work fine with 3.3V setups.
In this study, the set-up is referred to as SENSIRIONSPS30 (SPS30 particle sensor with Arduino microprocessor). At both stations, two SENSIRIONSPS30 set-ups were collocated and used for measurement and intra-comparison.
|
N o. |
Components |
Explanation |
Photo |
|
1 |
Arduino Mega |
Microprocessor |
fed |
|
2 |
SensirionSPS30 |
PM2.5 sensor |
vdcd |
|
3 |
SD module |
Module to connect the memory card to the microprocessor |
ved |
|
4 |
Green LED |
Light, programmed to blink when data storage was successful |
scwscx |
|
5 |
SD card |
A memory card on which measurement data can be stored |
vcv |
|
6 |
DS3231 |
Real-Time Clock, to keep track of the time, with CR2032 battery |
ced |
|
7 |
Power bank |
To be charged, providing back-up power |
csvbe |
Table 1: Show a Summary of the Components of the SENSIRIONSPS30 Set-ups
Table 1 shows the components of the SENSIRIONSPS30 set-up with each descriptions and photos.
Integration with the Arduino Mega2560 Board
The process of integrating the SPS30 sensor with the Arduino MEGA2560 board encompassed several critical steps, undertaken with precision. The initial phase involved establishing a connection between the sensor and the board. This was achieved through the implementation of the I2C communication protocol, chosen for its efficacy in ensuring reliable and accurate data transmission. Subsequently, the aspect of power supply became paramount. The operational power for the SPS30 was sourced directly from the Arduino board. This necessitated meticulous management of both power supply and its distribution, a key factor in maintaining system stability and functionality [32]. The specific connection layout of the SPS30 sensor with the Arduino MEGA2560 board is illustrated in figure 1.
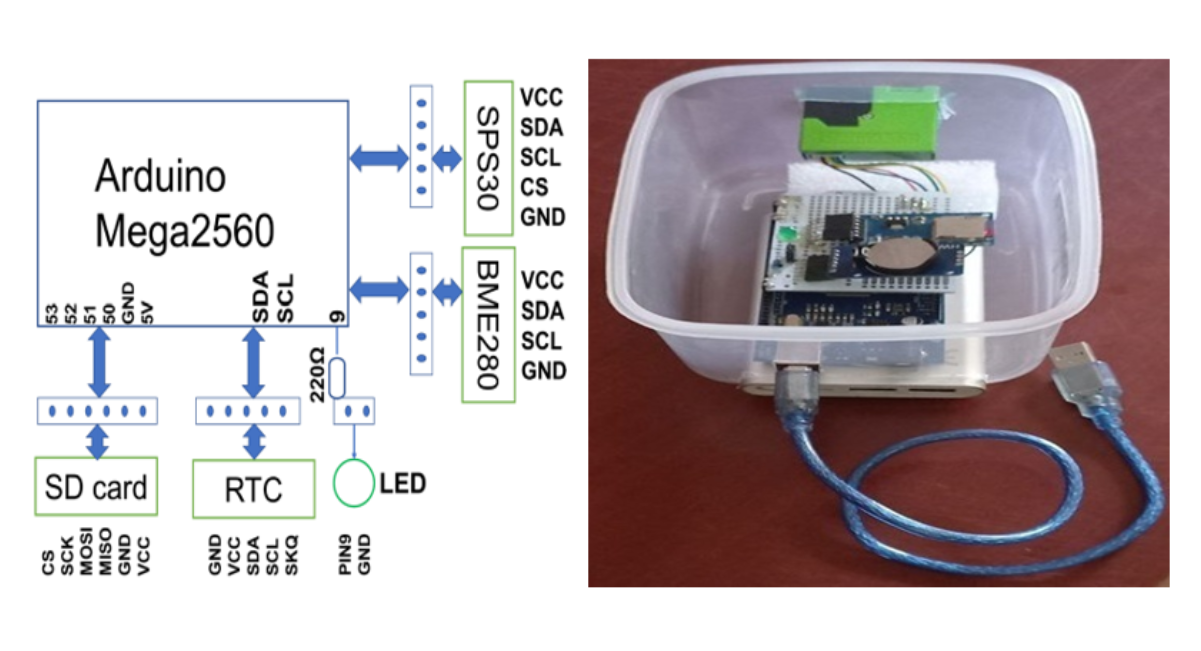
Figure 1: SENSIRIONSPS30, set-up circuit sketch components (A) and its photo (B)
The core components of the SENSIRIONSPS30, set-up were a SPS30PM2.5 sensor, an SD card module, a Real Time Clock (RTC), and LED connected to a microprocessor and with the following descriptions of each components [32-33].
Arduino Mega2560 is a microcontroller board based on the ATmega2560. 5 V x 50 Ma = 250 mW. An operating voltage was 5v.
SPS30 was used to measure the concentration of PM2.5 in the atmosphere and requires 5 V x 80 mA = 400 mW.
The real-time clock module with DS3232 ensured that the arduino knew the exact time at any given measurement and the built-in temperature sensor was deviation ±3℃.
Micro SD card reader was suitable for the arduino and was already part of the standard arduino library. The storage capacity was 32 GB and the circuit current was 3.3v and 5v.
Micro SD card 4GB was suitable for older devices that can handle a maximum of 4GB, and also suitable for arduino micro SD card reader.
Jumpler cables with a length of 40cm to connect two points on a bread board or arduino. They are grouped as a ribbon cable.
LED (Light Emitting Diode) light programmed to blink when data storage was successful 40 mA x 5 V = 200 mW when in use.
IQAir Air Visual pro
The Air Visual Pro, developed by IQAir in La Mirada, California, monitors PM2.5, PM10, CO2, relative humidity (RH), and temperature [34]. The PM2.5 AQI and mass concentration can be displayed on the screen. The sensor can internally store data for a maximum of 5 years, which is approximately 3 GB in size. No Wi-Fi is needed for data logging, as it can be done internally. However, Wi-Fi is necessary to remotely retrieve the data from a mobile device or computer, which can be done in a laboratory following sampling. The manufacturer’s reported accuracy range is ± 8% of the reading. It uses a small fan to draw air inside the laser cavity, where it utilizes light scattering to calculate the concentration. It has a life expectancy of > 3 years [34].
For this study, one IQAV per station was used for further comparison with SENSIRIONSPS30 set up at each of the two stations, Addis Ababa and Adama Meteorological Institute. Table 2 below shows specifications of low-cost sensors used in this study.
|
Sensors |
IQAV Pro |
SPS30 |
|
Name Range |
Air Visual Pro 0-4488 |
SensirionSPS30 0-1000 |
|
Logging interval |
>10s |
>1s |
|
Cost ($) |
269 |
30 |
|
Internal storage |
Yes |
No available |
|
Internal battery |
2-4 hours |
No available |
Table 2: Lists the Fundamental Specifications of the LCS Sensors that were Utilized
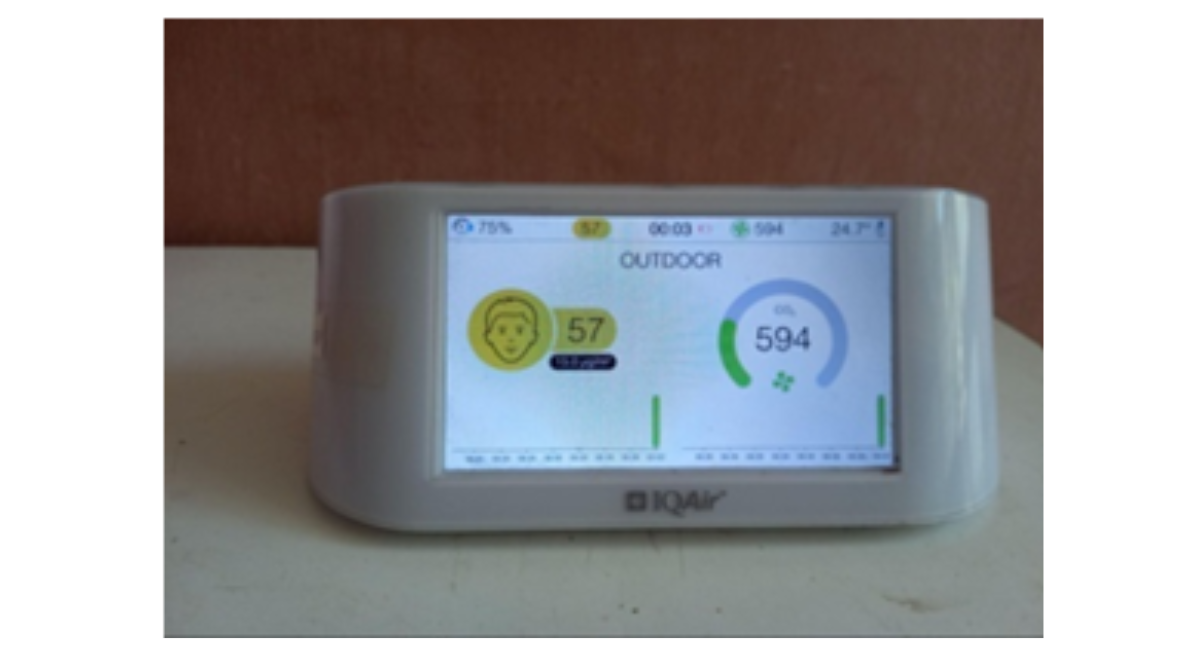
IQAir Air visual pro
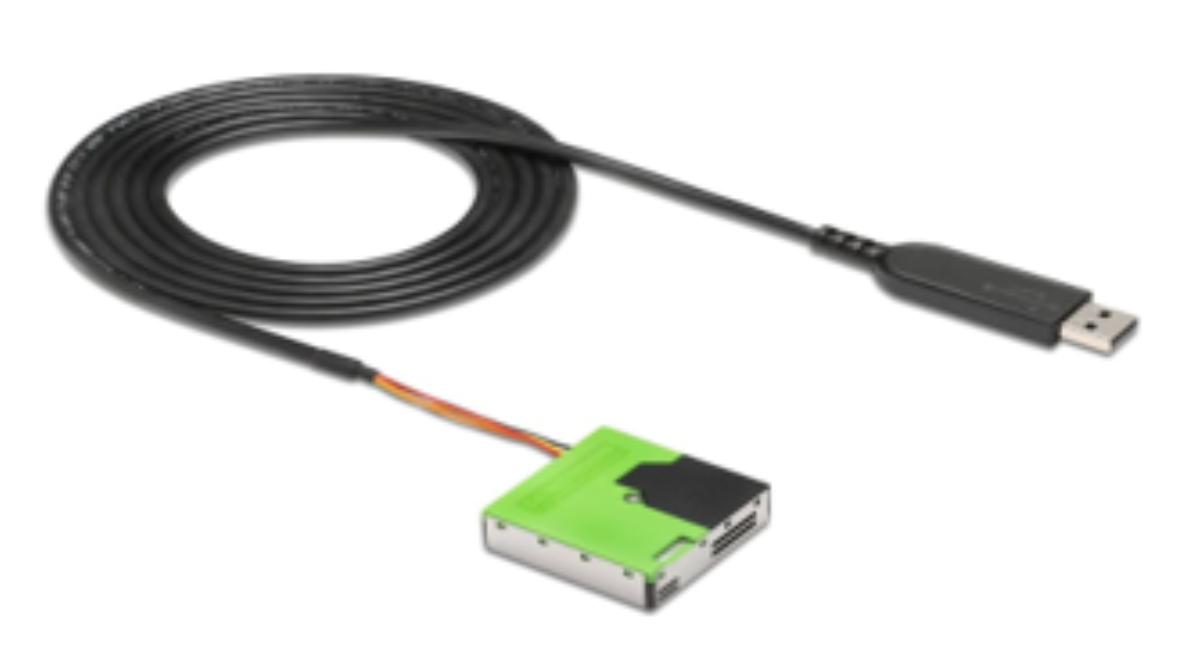
SensirionSpS30
Figure 2: Low-cost Sensors used for the Study
Gravimetric Instrument
The reference method for PM2.5 is based on gravimetric: exposing a filter paper to air with PM2.5 and weighing the mass increase to establish the concentration. PM2.5 is collected on filter paper with an Ultrasonic Personal Air Sampler (UPAS) [35]. The UPAS is a gravimetric instrument designed for personal exposure and medium to high concentrations. With a flow rate of 1 L/min, a filter is loaded with particles. At the inlet, a cyclone makes sure those only particles with a diameter smaller than 2.5µm. Over ranges of 20-1,000 µg/m 3, found strong correlations with the EPA federal reference method, and found for ranges of 100-500 µg/m 3 that the UPAS may be a suitable alternative for respiratory dust mass sampling in occupational settings. Filter papers were weighed before and after sampling with a Mettler ToledoAE240 analytical balance, which has a readability of 10 µg and a reproducibility of ±20 µg [35-37].
Installations of Instruments and Data Collection
SENSIRIONSPS30 and IQAV observations
For this study, SENSIRIONSPS30 and IQAV were installed at fixed locations of the Ethiopian Meteorological Institute Addis Ababa and Adama stations.
For data quality assessment, multiple instruments were placed at the same location (co-locate) at both study stations. Continuous data collection took place for four consecutives of months at both stations (mid-May to the 1 st ten days of September 2023). The two setups, SENSIRIONSPS30 and one IQAir air visual Pro was placed at both stations. Regularly, the instruments were checked if they were working properly, and data from both instruments was retrieved once per week. Data from the Sensirion SPS30 were recollected at 10-second intervals on an SD card. For power interruptions, a power bank provided an additional operation time up to 48 hours.
Data from the IQAV were collected at 10-second intervals. Data is stored on the instrument, and retrieved by connecting to the device storage over Wi-Fi. For power interruptions, an internal battery can provide up to 4 hours of additional operation time. At both measurement stations, Addis Ababa and Adama, the IQAV served as the LCS for comparison with the SensirionSPS30. The observation period for SENSIRIONSP30, set-up, and IQAV data was collected from mid-May to the 1 st ten days of September 2023. Table 3 shows installation period, data available for both low-cost sensors at both stations.
|
Locations |
Instruments |
Start time |
End time |
Hours of available data |
Missing data (%) |
|
Addis Ababa |
ASPM07 |
2023/5/23 |
2023/9/13 |
2281 |
20 |
|
Addis Ababa |
ASPM08 |
2023/5/23 |
2023/9/13 |
2305 |
18 |
|
Addis Ababa |
ASPM15 |
2023/7/17 |
2023/9/13 |
1073 |
25 |
|
Adama |
ASPM10 |
2023/5/20 |
2023/9/15 |
2229 |
22 |
|
Adama |
ASPM16 |
2023/8/1 |
2023/9/15 |
748 |
74 |
|
Adama |
IQAV08 |
2023/6/22 |
2023/9/15 |
1425 |
51 |
|
Addis Ababa |
IQAV11 |
2023/5/23 |
2023/9/15 |
2696 |
4 |
Table 3: Number of Data Points Collected, Durations, and Missing of Data for Lcss
Table 3 shows the period when the low-cost sensors started to measure the PM2.5 and the period as the measurements stopped, the availability of data, and missing data for each low-cost sensor at both stations.
Gravimetric measurements
At the study locations, twelve and eight UPAS reference measurements were conducted at Adama and Addis Ababa stations, respectively. Empty filters were weighed at the Arba Minch Air Quality Laboratory, and after being put into the UPAS, and through the UPAS exposed to air next to other instruments. For sufficient filter load, at Adama and Addis Ababa stations longer filters were used; filter load times of 5 and 7 days were attempted. After loading, the filter was weighed again (post) at Arba Minch University Air Quality Laboratory. The total collection of PM2.5 equals the difference between post and pre. The instrument operates at a flow rate of 1 L/min [38]. Based on the total hours of operation for a filter, the total volume of air was calculated. The concentration during the operation time is found by dividing the total collected PM2.5 by the total volume of air.
To determine the mass concentrations of PM2.5 using filter paper;
Where, Mf = Final mass PM2.5 after filter paper exposed to ambient air (mg)
Mi = Initial mass of empty filter paper (mg)
Where, V= total volume of sampled air, m 3.
PM2.5= concentration of PM2.5 in ambient air (µg/m 3).
Measurements of co-located SENSIRIONSPS30 can be compared with this reference result by taking the average of all measured concentrations during the same time. At both stations, the gravimetric measurements were taken for one month.
Before sampling, the twenty paper filters were conditioned to remove any moisture that might affect the weighing process. This is done by putting the filter in desiccators. Table 4 below shows durations for the gravimetric reference instruments to collect the PM2.5 concentrations.
|
Number |
Location |
Duration |
Time (hr.) |
|
1 |
Adama |
2023/7/18 - 2023/7/26 |
96 |
|
2 |
Adama |
2023/7/26 – 2023/7/31 |
79.1 |
|
3 |
Adama |
2023/7/31-2023/8/5 |
91.6 |
|
4 |
Adama |
2023/8/7-2023/8/13 |
120 |
|
5 |
Adama |
2023/8/14-2023/8/22 |
120 |
|
6 |
Adama |
2023/8/23-2023/9/5 |
92 |
|
7 |
Adama |
2023/7/21-2023/7/27 |
96 |
|
8 |
Adama |
2023/7/28-2023/8/3 |
83.4 |
|
9 |
Adama |
2023/8/3-2023/8/10 |
96 |
|
10 |
Adama |
2023/8/10-2023/8/16 |
120 |
|
11 |
Adama |
2023/8/17-2023/9/2 |
140 |
|
12 |
Adama |
2023/9/4-2023/9/15 |
166 |
|
13 |
Addis Ababa |
2023/7/20-2023/7/27 |
166.1 |
|
14 |
Addis Ababa |
2023/7/27-2023/8/1 |
122.5 |
|
15 |
Addis Ababa |
2023/8/1-2023/8/8 |
167 |
|
16 |
Addis Ababa |
2023/8/8-2023/8/15 |
166 |
|
17 |
Addis Ababa |
2023/8/15-2023/8/21 |
144 |
|
18 |
Addis Ababa |
2023/8/21-2023/9/5 |
362 |
|
19 |
Addis Ababa |
2023/9/5-2023/9/6 |
24 |
|
20 |
Addis Ababa |
2023/9/6-2023/9/13 |
190 |
Table 4: Gravimetric UPAS Measurements at both Stations
The above table shows the duration of the exposure of UPAS filter papers to air and the hours for each filter at both stations. The duration of UPAS filter papers exposed to air for Adama station was 83.4 hours to 166 hours, and for Addis Ababa station, it was for about 24 hours to 362 hours. The UPAS filter papers on which PM2.5 was exposed were used as a reference for evaluating the performance of set-up sensirionSPS30 at both stations. The reason for the difference between date duration and time of hours, especially at Adama station, is due to the interruptions of power supply.
Data Processing and Software Used
Data Preparation
The European Commission (2010) permits the exclusion of up to 2.5% of anomalies using Grubb’s outlier test at the 99% level in their guidelines for Demonstrating Equivalence of Ambient Air Monitoring Methods (DEM) [39]. I used this method to eliminate outliers from some SENSIRIONSPS30 devices. And also, ASPM16 and ASPM10's real-time changed. For UPAS at Addis Ababa, a day of measurement was removed because it was an outlier. The data quality metrics for the three comparison types and simultaneously checking the instruments on the field were also used as data quality checks.
Software used
The ArcGIS was used to show the study area. The software used for all data processing and visualization is Python 3.8 [40], with the packages NumPy, Panda, and SciPy [41-43]. NumPy was used for handling large dimensional arrays, pandas were used for data manipulation and analysis and matplotlib was used for building data visualization. Additionally, the averaged continuous of SENSIRIONSPS30 PM2.5 measurements were used for statistical analysis. Communication with the set-ups (reading the serial messages, and uploading scripts) is done through the Arduino IDE, version 1.8.16.
Data Analysis
Most commercial power banks have a capacity of 6-10 Ah at 5 V. In case of connection to an irregular power grid, a 6 Ah power bank can provide backup power during power interruptions for 6 Ah / (0.674 W / 5 V) = 44 hours [33]. During the data analysis unavailable data due to power loss, were treated as ‘not available’. Different quality metrics were taken from guidelines by the Environmental Protection Agency of the United States of America (EPA); the National Institute for Occupational Safety and Health (NIOSH); and the European Commission in the Guide to the Demonstration of Equivalence of Ambient Air Monitoring Methods, and those regularly used in other studies for low-cost sensors data quality. The data quality metrics used were the slope (S) and the corresponding coefficient of determination (R 2) of Ordinary Least Squares regression, Coefficient of Variation (CV), between-sampler uncertainty (u bs), Bias (B), Accuracy (Ac) and Pearson correlation (r) [39,44]. Table 5 below shows metrics used for evaluating the low-cost sensors, reference used and score of requirements for each evaluation purpose.
|
Evaluation |
Metrics |
Location |
Reference |
Score /Requirement |
|
Pairwise (intra) |
S & R 2 CV |
Both Both |
Often used EPA, NIOSH |
R 2>0.75 at least; R 2>0.9 v/good <10% |
|
Within gravimetric (reference) |
R S R 2 B & Ac |
Both Both Both Both |
EPA EPA Often used NIOSH |
>0.97 1 0.35 R 2>0.75 at least; R 2>0.9 v/good Correction if /B/>10%, Ac<25% |
|
Within IQAir (between) |
S&R 2 B &Ac Ubs |
Both Both Both |
Often used NIOSH DEM |
R 2>0.75 at least; R 2>0.9 v/good Correction if /B/>10%, Ac<25% <2.5 µg/m 3 |
Table 5 : A Summary of Quality Metrics was Used for Evaluating Lcss
The above table 5 shows the metrics used for the performance evaluation of the SENSIRIONPS30 sensor against itself (intra-comparison), with reference (gravimetric) and with other commercially low-cost sensors (IQAV), guidelines as references used, and score requirements at both stations.
Quantifying the correlation of SENSIRIONSPS30
To quantify the correlation of SENSIRIONSPS30, there were three types of comparisons conducted in this study: a comparison of similar SENSIRIONSPS30 (intra-comparison), a comparison of the SENSIRIONSPS30 amongst other LCS (inter-sensor comparison), and a comparison of the SENSIRIONSPS30 with the gravimetric reference method (reference comparison). Comparison with the air quality monitoring stations (AQMs) at both stations was not possible, because AQMs are currently not operational at both Addis Ababa and Adama stations.
Comparison with similar (Intra comparison)
This kind of comparison is intra-comparison, a comparison among the same instruments. For this study, the same SENSIRIONSPS30, set-ups were compared at both Addis Ababa and Adama meteorological stations. To compare these SENSIRIONSPS30 with other sensirionSPS30 instruments, the linear association quantified with the slope (S) resulting from Ordinary Least Squares (OLS) regression without intercept, and the corresponding coefficient of determination (R 2) was used. Furthermore, the coefficient of variation (CV), which should be below 10% for good data quality, was calculated as equation 3.3.
Where, SD = standard deviation of 24-hour averaged sensor PM2.5 concentration measurement (µg/m 3). M= number of identical sensors operated simultaneously during a field test. N= number of 24-hour periods during which all identical sensors are operating and returning valid averages throughout the field test.
xdj= 24-hr averaged sensor PM2.5 concentration for day d and sensor j (µg/m 3).
xd= 24-hr averaged sensor PM2.5 concentration for day d (µg/m 3).
The Coefficient of Variation (CV) is calculated with equation 3.4 [45]
Comparison with IQAV
This kind of comparison is inter-comparison, a comparison between two different low-cost sensors. In this study, SENSIRIONSPS30 and IQAV were compared at both Addis Ababa and Adama meteorological stations. To compare the SENSIRIONSPS30 with the IQAV, accuracies were used to quantify the degree of equivalence at both stations. Accuracy was used as a metric for all comparisons of averages over periods smaller than 24 hours. Comparisons were also conducted at 10-minute and 1-hour average levels. Additionally, R 2 for OLS regression without an intercept was computed.
Comparison with gravimetric (Reference comparison)
The kind of reference comparison is a comparison between SENSIRIONSPS30 and reference instruments [46]. In this study, SENSIRIONSPS30 and gravimetric were compared at both Addis Ababa and Adama meteorological stations. Pearson correlation coefficient (R), slope (S), and corresponding R 2 based on OLS regression without intercept, accuracy, and bias were computed for the comparison with the gravimetric instrument.
Bias is the relative discrepancy between the mean of the distribution of measurements from a low-cost sensor and the reference concentration being measured, expressed as a fraction. It is given by
The bias (B) was calculated with equation 3.5 [47]:
Where Xi is the concentration of the low-cost sensor, Yi is the concentration of the reference instruments for period i, and n is the number of periods. To meet the accuracy (AC) of ≤25%, acceptable monitors should have a bias magnitude no greater than 10% and if this criterion is not met, measurements must be bias-corrected.
The accuracy (Ac) is the theoretical maximum error of the measurement, expressed as the proportion or percentage of the amount being measured, without regard for the direction of the error, which is achieved with 0.95 probabilities. The accuracy was calculated as the upper value of the confidence interval at 95% of the relative difference between the low-cost sensors measurement and reference measurements. Accuracy should be ≤25% with 95% confidence. Accuracy was calculated with equation 3.6
Where, A= accuracy, LCS PM2.5 = low-cost sensors and Ref PM2.5 = reference measurement
For this, all values are calculated, and the confidence interval at 95% was determined based on these values.
If |B| is higher than 10%, NIOSH prescribes correcting the bias in the data. Equation 3.7 was used for calculating corrected data x new based on the old data x old [47].
The names Ac_BC and Ac_AC were used to distinguish between accuracy before and after bias correction, respectively. A linear relationship between the low-cost sensors and gravimetric reference data was assumed. For establishing this linear relationship, algorithms of orthogonal regression were used. If slopes are significantly different from 1, and/or the intercept is significantly different from 0, the Demonstration of Equivalence of Ambient Air Monitoring Methods (DEM) prescribes correcting the data for this slope and/or intercept [39]. To conduct all data comparisons in this study, the slope without intercept was significant.
Temporal variation of PM2.5
Daily temporal variation of the PM2.5 concentrations over Addis Ababa and Adama meteorological stations was done using SENSIRIONSPS30 and IQAV.
RESULTS AND DISCUSSIONS
Comparisons of Intra-sensors of SENSIRONSPS30
To verify the internal consistency of the instrumentation, identical SensirionSPS30 units were operated side-by-side at the monitoring locations. The empirical evaluation began with rigorous pairwise intra-sensor comparisons among the various Sensirion SPS30 sensor setups deployed across the Addis Ababa and Adama meteorological stations. Hourly scatter plots illustrating these intra-sensor comparisons demonstrate that the independent Sensirion SPS30 units exhibited highly consistent measurement behaviors, recording remarkably similar particulate matter concentrations across both testing environments.
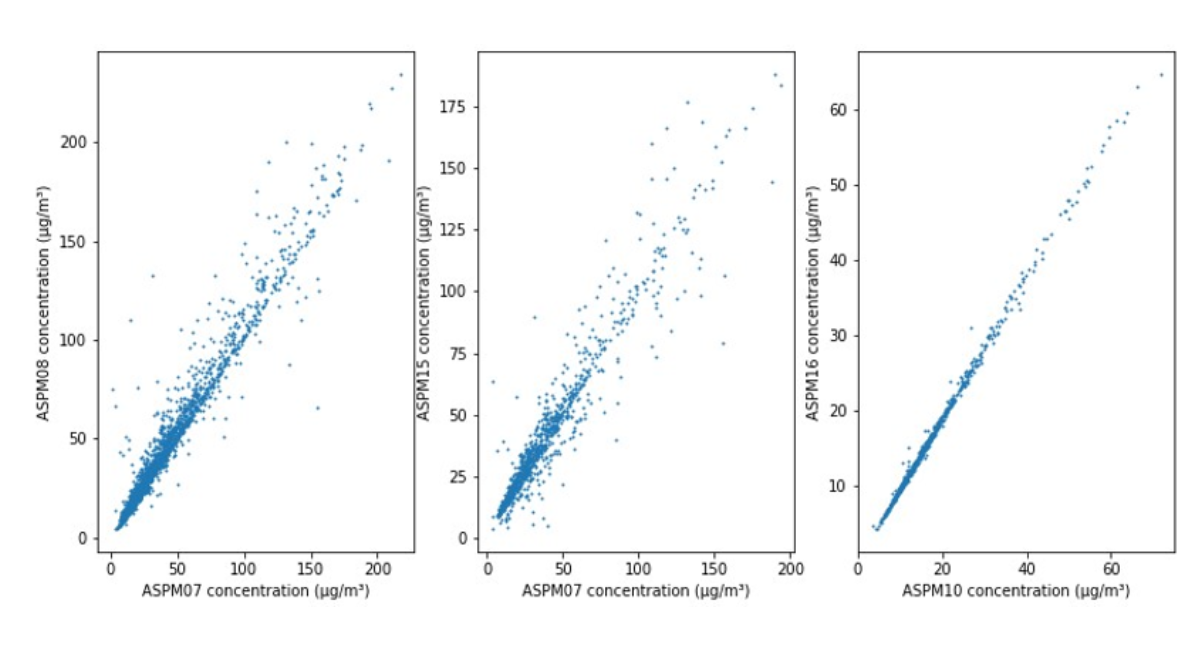
Figure 3: Hourly Scatter Plots among SENSIRIONSPS30
Figure 3 shows that the comparisons among SENSIRIONSPS30 set-up sensors at Addis Ababa and Adama meteorological stations were good and shows SENSIRIONSPS30 were measured similar data at both stations
|
Location |
Instruments |
N |
CV |
Slope |
R 2 |
|
Addis Ababa |
ASPM07 and ASPM08 |
2155 |
9% |
1.08 |
0.98 |
|
Addis Ababa |
ASPM07 and ASPM15 |
964 |
11.6% |
1.01 |
0.97 |
|
Addis Ababa |
ASPM08 and ASPM15 |
966 |
8.5% |
0.87 |
0.99 |
|
Adama |
ASPM10 and ASPM16 |
727 |
3.9% |
1.05 |
0.99 |
Table 6: Shows That the Comparison Among SENSIRIONSPS30 Sensors at Both Locations Shows Good Performance
At the Addis Ababa meteorological station, the comparison between sensor ASPM07 and ASPM08 over 2,155 observations yielded a low coefficient of variation of 9%, a regression slope of 1.08, and an outstanding coefficient of determination of 0.98. Similarly, comparing ASPM07 against ASPM15 across 964 data points revealed a CV of 11.6%, a slope of 1.01, and an R2 of 0.97, while the comparison between ASPM08 and ASPM15 across 966 observations demonstrated a CV of 8.5%, a slope of 0.87, and an exceptionally high R2 of 0.99.
At the Adama meteorological station, the intra-sensor evaluation between ASPM10 and ASPM16 across 727 observations established an even tighter alignment, characterized by a minimal coefficient of variation of 3.9%, a regression slope of 1.05, and a coefficient of determination reaching 0.99. These quantitative findings confirm that the Sensirion SPS30 sensor setups possess exceptional internal precision and repeatability under field operating conditions.
Comparisons of SENSIRIONSPS30 with reference instrument
To evaluate absolute measurement accuracy, the low-cost sensor outputs were benchmarked directly against the gravimetric reference data obtained via the UPAS sampler. Bar chart concentration comparisons clearly displayed the distribution patterns between the gravimetric reference and the low-cost sensor arrays at both monitoring locations.
Figure 4 shows bar chart concentrations of gravimetric (reference) and all low-cost sensors including SENSIRIONSPS30 and IQAV at Addis Ababa meteorological station.
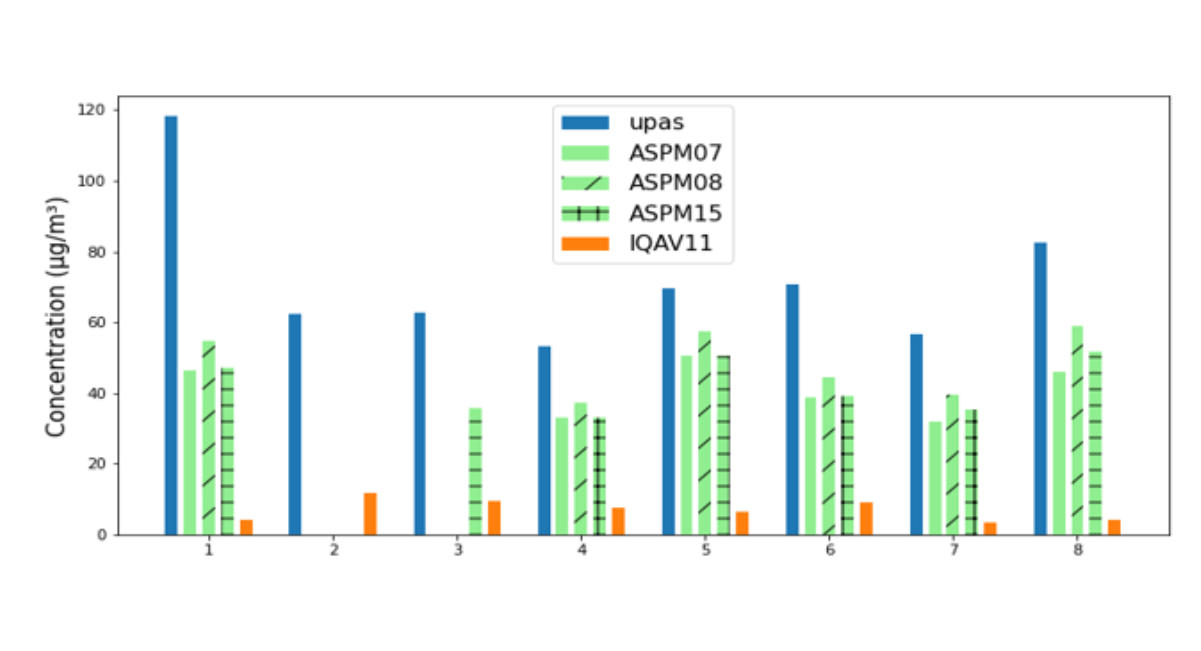
Figure 4: Shows Concentrations of UPAS and LCS Sensors During the Same Time at Addis Ababa
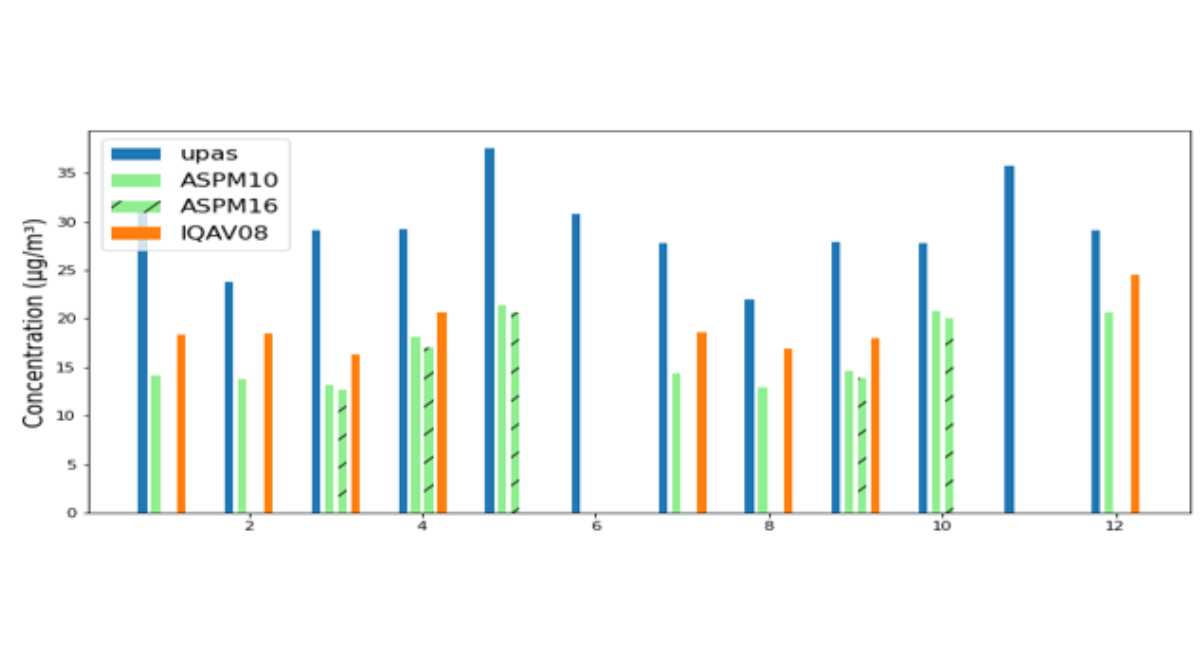
Figure 5: Show Concentrations of UPAS and LCS Sensors during the Same time at Adama
Figure 5 shows bar chart concentrations of UPAS (reference instrument) and all low-cost including SENSIRIONSPS30 and IQAV sensors at Adama station
|
Location |
Instruments |
Numbers |
R |
Accuracy before bias correction |
Bias |
Accuracy after bias correction |
Slope |
R 2 |
|
Addis Ababa |
ASPM07 |
5 |
0.76 |
0.46 |
-0.39 |
0.15 |
1.64 |
0.99 |
|
Addis Ababa |
ASPM08 |
5 |
0.86 |
0.35 |
-0.28 |
0.13 |
1.39 |
0.99 |
|
Addis Ababa |
ASPM15 |
6 |
0.85 |
0.43 |
-0.38 |
0.12 |
1.6 |
0.99 |
|
Addis Ababa |
IQAV11 |
6 |
-0.18 |
0.92 |
-0.88 |
0.50 |
8.8 |
0.86 |
|
Addis Ababa |
ASPM07, ASPM08, ASPM15 |
10 |
0.74 |
0.39 |
-0.34 |
0.15 |
1.49 |
0.98 |
|
Adama |
ASPM10 |
10 |
0.58 |
0.48 |
-0.42 |
0.18 |
1.7 |
0.97 |
|
Adama |
ASPM16 |
5 |
0.52 |
0.54 |
-0.44 |
0.25 |
1.76 |
0.97 |
|
Adama |
IQAV08 |
8 |
0.33 |
0.39 |
-0.30 |
0.15 |
1.43 |
0.98 |
|
Adama |
ASPM10 and ASPM16 |
15 |
0.56 |
0.47 |
-0.43 |
0.17 |
1.72 |
0.97 |
|
Addis Ababa and Adama |
ASPM07, ASPM08, ASPM10, ASPM15, ASPM16 |
25 |
0.95 |
0.42 |
-0.39 |
0.17 |
1.53 |
0.98 |
Table 7: Show Quality Metrics Between Lcss and Gravimetric UPAS at Both Stations
At Addis Ababa, individual evaluations of sensor ASPM07 against the reference across 5 paired samples yielded a Pearson correlation of 0.76, an initial pre-correction accuracy of 0.46, a negative bias of -0.39, a post-correction accuracy of 0.15, a regression slope of 1.64, and an R2 of 0.99. Sensor ASPM08 across 5 samples demonstrated a correlation of 0.86, a pre-correction accuracy of 0.35, a bias of -0.28, a post-correction accuracy of 0.13, a slope of 1.39, and an R2 of 0.99. Sensor ASPM15 across 6 samples showed a correlation of 0.85, a pre-correction accuracy of 0.43, a bias of -0.38, a post-correction accuracy of 0.12, a slope of 1.6, and an R2 of 0.99. Meanwhile, the IQAir reference comparison (IQAV11) yielded a weaker correlation of -0.18, a pre-correction accuracy of 0.92, a bias of -0.88, a post-correction accuracy of 0.50, a slope of 8.8, and an R2 of 0.86.
Combining all Sensirion units at Addis Ababa across 10 aggregate samples yielded a robust Pearson correlation of 0.74, a pre-correction accuracy of 0.39, a bias of -0.34, a post-correction accuracy of 0.15, a slope of 1.49, and an R2 of 0.98.
At Adama, sensor ASPM10 evaluated across 10 samples achieved a correlation of 0.58, a pre-correction accuracy of 0.48, a bias of -0.42, a post-correction accuracy of 0.18, a slope of 1.7, and an R2 of 0.97. Sensor ASPM16 across 5 samples recorded a correlation of 0.52, a pre-correction accuracy of 0.54, a bias of -0.44, a post-correction accuracy of 0.25, a slope of 1.76, and an R2 of 0.97. The IQAir unit at Adama (IQAV08) across 8 samples showed a correlation of 0.33, a pre-correction accuracy of 0.39, a bias of -0.30, a post-correction accuracy of 0.15, a slope of 1.43, and an R2 of 0.98. Across the combined dataset of 25 total samples spanning both Addis Ababa and Adama stations, the Sensirion SPS30 sensors achieved an impressive overall Pearson correlation of 0.95, a pre-correction accuracy of 0.42, a bias of -0.39, a post-correction accuracy of 0.17, a regression slope of 1.53, and a high coefficient of determination of 0.98.
Comparisons of SENSIRIONSPS30 with low-cost sensors
Inter-sensor comparisons between the Sensirion SPS30 units and the IQAir Air Visual Pro units revealed notable performance variations between the two monitoring sites.
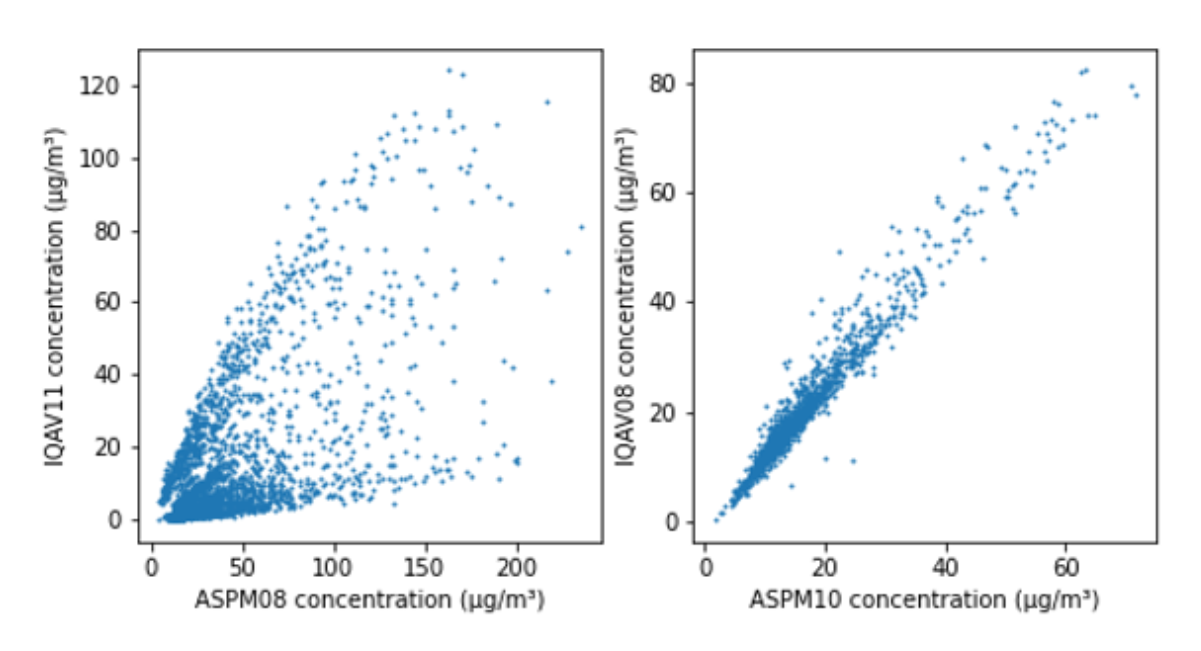
Figure 6: Hourly Scatter Plot between SENSIRIONSPS30 and IQAV
Hourly scatter plots indicated that the comparison between IQAV11 and ASPM08 at the Addis Ababa station exhibited high dispersion, reflecting lower mutual precision and inter-sensor comparability between the two device types at that location, whereas the comparison between IQAV08 and ASPM10 were less scattered showing that the IQAV and SENSIRIONSPS30 measure PM2.5 close to one another at Adama station. Table 8 shows some statistical comparisons between SENSIRIONSPS30, set-ups and IQAV at both sites.
|
Location |
Instruments |
Number |
Uncertainty between sampler (Ubs) |
Accuracy before bias correction |
Bias |
Accuracy after bias correction |
Slope |
R 2 |
|
Addis Ababa |
ASPM07 and IQAV11 |
2274 |
19.55 |
0.59 |
0.54 |
0.75 |
1.58 |
0.66 |
|
Addis Ababa |
ASPM08 and IQAV11 |
2296 |
23.9 |
0.64 |
0.60 |
0.80 |
1.68 |
0.60 |
|
Addis Ababa |
ASPM15 and IQAV11 |
1060 |
25.76 |
0.87 |
0.86 |
0.49 |
4.7 |
0.71 |
|
Adama |
ASPM10 and IQAV08 |
1291 |
3.23 |
0.23 |
0.21 |
0.10 |
0.79 |
0.98 |
|
Adama |
ASPM16 and IQAV08 |
616 |
3.34 |
0.27 |
0.26 |
0.08 |
0.76 |
0.99 |
Table 8: Show Quality Metrics Between SENSIRIONSPS30 and IQAV at both Stations
Uncertainty between samplers (ubs) for Addis Ababa pairings reached 19.55 for ASPM07 and IQAV11 across 2,274 observations (R 2 = 0.66), 23.9 for ASPM08 and IQAV11 across 2,296 observations (R 2 = 0.60), and 25.76 for ASPM15 and IQAV11 across 1,060 observations (R 2 = 0.71).
Conversely, the inter-sensor comparison at the Adama station between IQAV08 and the Sensirion units was markedly less scattered, demonstrating that the IQAir and Sensirion SPS30 sensors measured PM2.5 concentrations in much closer alignment. For Adama, the pairing between ASPM10 and IQAV08 across 1,291 observations yielded a remarkably low sampler uncertainty of 3.23, a pre-correction accuracy of 0.23, a bias of 0.21, a post-correction accuracy of 0.10, a regression slope of 0.79, and an exceptional R 2 of 0.98. Similarly, the comparison between ASPM16 and IQAV08 across 616 observations showed a sampler uncertainty of 3.34, a pre-correction accuracy of 0.27, a bias of 0.26, a post-correction accuracy of 0.08, a regression slope of 0.76, and an R 2 of 0.99.
Temporal Variations of PM2.5
Temporal variations of PM2.5 concentration over Addis Ababa station
An analysis of daily temporal variations revealed distinct particulate pollution patterns across both urban monitoring sites. Figure 7 shows daily concentration of PM2.5 over Addis Ababa.
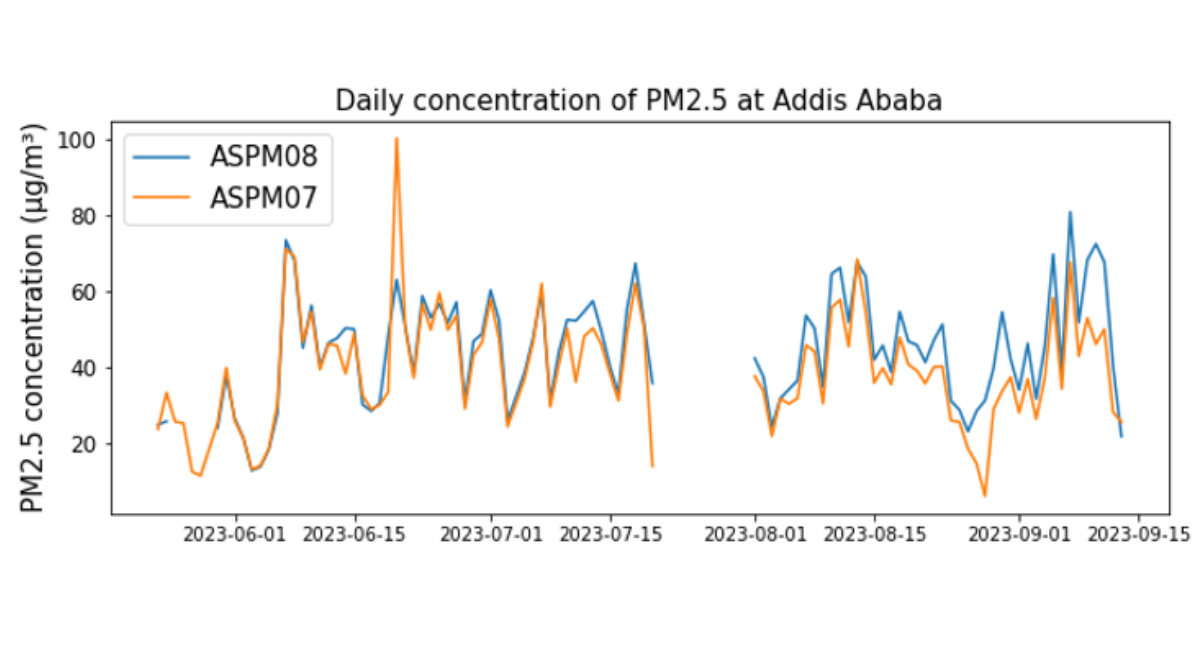
Figure 7: Shows Daily Concentration of PM2.5 Over Addis Ababa
From the figure 7 the concentrations of PM2.5 at Addis Ababa station were usually between 30 and 60 µg/m 3. On average, the concentration was around 42.2µg/m 3. According to WHO guidelines, the daily mean concentration of PM2.5 was 15 µg/m 3, but in this study, the concentration of PM2.5 was three times higher than the guidelines of WHO. There are limited long-term studies on ambient air pollution in Addis Ababa, but the available data so far indicate that the level of air pollution in the city is increasing [11]. Due to rapid urban growth and increased vehicles, air quality management in Addis Ababa is challenging, and real-time monitoring is needed [24].
Temporal variation of PM2.5 concentration over Adama station
In this study, the daily concentration level of PM2.5 was done using the data of SENSIRIONSPS30 and IQAV, because their measurements are almost the same and have good accuracy when compared to reference measurements.
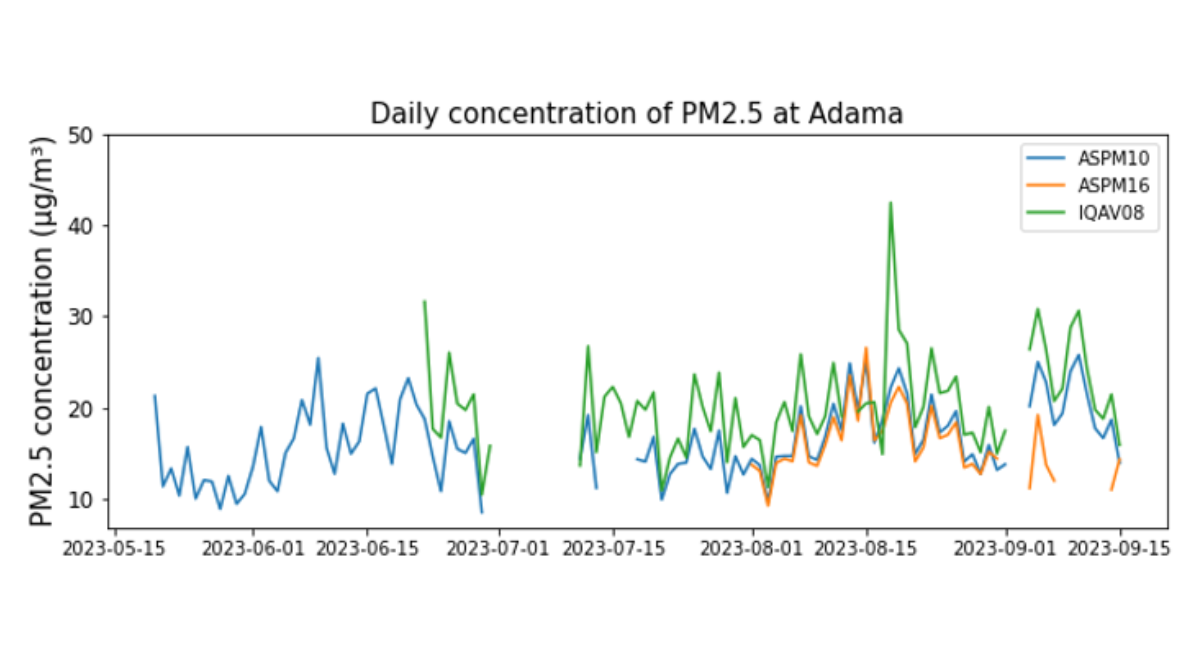
Figure 8: Shows Daily Concentration of PM2.5 Over Adama
From the above figure 8 the concentrations of PM2.5 at Adama station were between 10 and 30µg/m 3 with an average of around 16.6µg/m 3. The concentration level of PM2.5 in Adama was also higher than the WHO guidelines, which set to daily concentration level of 15 µg/m 3 ( WHO, 2021).
From the daily temporal variation concentration of PM2.5 measured by SENSIRIONSPS30 the concentration of PM2.5 at Addis Ababa station was higher than the concentration of level of PM2.5 at Adama station due to the instruments were installed in confined air and the sources of PM2.5 in Addis Ababa was higher than Adama station area.
CONCLUSION AND RECOMMENDATION
This study evaluated low-cost sensors (LCS) for measuring PM2.5 concentrations at Ethiopia's Addis Ababa and Adama meteorological stations. From the performance evaluation of the SENSIRIONSPS30, the study showed that the low-cost sensor was good. The coefficient of variation is in almost all circumstances below the required 10%, and the accuracy against the gravimetric was at both locations well below the required 25%. Average daily PM2.5 concentrations at Addis Ababa and Adama meteorological stations were 42.2µg/m 3 and 16.6µg/m 3 respectively. This indicates concentration level of PM2.5 was high in the capital city of Addis Ababa.
The SENSIRIONSPS30 low-cost sensor has shown promising results in accurately measuring PM2.5 concentrations at both Addis Ababa and Adama meteorological stations.
The good performance of the SENSIRIONSPS30 has implications for air quality monitoring in Ethiopia and other developing countries. Monitoring air quality can inform policy decisions, improve public health, and guide future research.
It is recommended to test the quality of the sensors also in other cities and other weather and climatic seasons. This thesis was only focused on Addis Ababa and Adama meteorological stations. If the sensor quality is validated in different cities and ambient circumstances, the SENSIRIONSPS30 set-up possibly becomes applicable to many more locations.
COMPETING INTERESTS
The author declares no conflicts of interest.
ACKNOWLEDGEMENTS
I extend my heartfelt appreciation to the Ethiopian Meteorology Institute (EMI), whose financial support made education and research possible. Its generosity has enabled me to pursue my academic aspirations and contribute to the field of meteorological science. I would like to thanks Thomas Torora Minda (Dr.) and Johannes Dirk Dingemanse for their guidance.
Special thanks go to my family for their unwavering love, understanding, and encouragement. Their patience and belief in me have been the cornerstones of my academic journey.
ETHICAL CONSIDERATIONS
Ethical issues (Including plagiarism, Informed Consent, misconduct, data fabrication and/ or falsification, double publication and/ or submission, redundancy, etc.) have been completely observed by the authors.
REFERENCES
- Air pollution. In: Compendium of WHO and other UN guidance on health and environment, 2022 update. Geneva: World Health Organization.
- Weagle CL, Snider G, Li C, Van Donkelaar A, Philip S, Bissonnette P, et al. Global sources of fine particulate matter: interpretation of PM2. 5 chemical composition observed by SPARTAN using a global chemical transport model. Environmental science & technology. 2018;52(20):11670-81. [Crossref] [Google Scholar] [PubMed]
- Petkova EP, Jack DW, Volavka-Close NH, Kinney PL. Particulate matter pollution in African cities. Air Quality, Atmosphere & Health. 2013;6(3):603-14. [Crossref] [Google Scholar]
- Pope Iii CA, Burnett RT, Thun MJ, Calle EE, Krewski D, Ito K, Thurston GD. Lung cancer, cardiopulmonary mortality, and long-term exposure to fine particulate air pollution. Jama. 2002;287(9):1132-41. [Crossref] [Google Scholar]
- Apte JS, Marshall JD, Cohen AJ, Brauer M. Addressing global mortality from ambient PM2. 5. Environmental science & technology. 2015;49(13):8057-66. [Crossref] [Google Scholar] [PubMed]
- Gordon JN, Bilsback KR, Fiddler MN, Pokhrel RP, Fischer EV, Pierce JR, et al. The effects of trash, residential biofuel, and open biomass burning emissions on local and transported PM2. 5 and its attributed mortality in Africa. GeoHealth. 2023;7(2):e2022GH000673. [Crossref] [Google Scholar] [PubMed]
- Cardenas B, et al. CLEAN AIR CATALYST. Sources of Air Pollution: Addis Ababa World Resources Institute: Environmental Defense Fund.
- World Health Organization. WHO global air quality guidelines: particulate matter. (PM2. 5 and PM10), ozone, nitrogen dioxide, sulfur dioxide and carbon monoxide: executive summary. World Health Organization; 2021. [Google Scholar] [PubMed]
- Dingemanse JD, Dingemanse-de Wit G. An evaluation of best practices in an air quality student science project in Ethiopia. Aquademia. 2022;6(1):ep22001. [Crossref] [Google Scholar]
- Kanaroglou PS, Jerrett M, Morrison J, Beckerman B, Arain MA, Gilbert NL, et al. Establishing an air pollution monitoring network for intra-urban population exposure assessment: A location-allocation approach. Atmospheric Environment. 2005;39(13):2399-409. [Google Scholar] [PubMed]
- Policy AA. Regulatory Situational Analysis. A Report Published by UN Environment in Collaboration with the Environmental Compliance Institute UNEP. 2018. [Google Scholar]
- Kosmopoulos G, Salamalikis V, Pandis SN, Yannopoulos P, Bloutsos AA, Kazantzidis A. Low-cost sensors for measuring airborne particulate matter: Field evaluation and calibration at a South-Eastern European site. Science of The Total Environment. 2020;748:141396. [Crossref] [Google Scholar] [PubMed]
- World Meteorological Organization. United Nations Environment Programme, and International Global Atmospheric Chemistry project. Integrating Low-cost Sensor Systems and Networks to Enhance Air Quality Applications. 293, p. 80, 2024.
- Snyder EG, Watkins TH, Solomon PA, Thoma ED, Williams RW, Hagler GS, et al. The changing paradigm of air pollution monitoring. Environmental science & technology. 2013;47(20):11369-77. [Crossref] [Google Scholar] [PubMed]
- Lewis A, Edwards P. Validate personal air-pollution sensors. Nature. 2016;535(7610):29-31. [Crossref] [Google Scholar] [PubMed]
- Dingemanse JD. Evaluation of Three Low-Cost Particulate Matter (PM2. 5) Sensors for Ambient and High Exposure Conditions in Arba Minch, Ethiopia. Ethiopian Journal of Water Science and Technology. 2021;4:31-61. [Crossref] [Google Scholar]
- Motlagh NH, Lagerspetz E, Nurmi P, Li X, Varjonen S, Mineraud J, et al. Toward massive scale air quality monitoring. IEEE Communications Magazine. 2020;58(2):54-9. [Crossref] [Google Scholar]
- Abraham S, Li X. A cost-effective wireless sensor network system for indoor air quality monitoring applications. Procedia Computer Science. 2014;34:165-71. [Crossref] [Google Scholar]
- Khreis H, Johnson J, Jack K, Dadashova B, Park ES. Evaluating the performance of low-cost air quality monitors in Dallas, Texas. International journal of environmental research and public health. 2022;19(3):1647. [Crossref] [Google Scholar] [PubMed]
- Feinberg S, Williams R, Hagler GS, Rickard J, Brown R, Garver D, et al. Long-term evaluation of air sensor technology under ambient conditions in Denver, Colorado. Atmospheric measurement techniques. 2018;11(8):4605-15. [Crossref] [Google Scholar] [PubMed]
- Karagulian F, Barbiere M, Kotsev A, Spinelle L, Gerboles M, Lagler F, et al. Review of the performance of low-cost sensors for air quality monitoring. Atmosphere. 2019;10(9):506. [Crossref] [Google Scholar]
- Gerboles M, Lagler F, Rembges D, Brun C. Assessment of uncertainty of NO2 measurements by the chemiluminescence method and discussion of the quality objective of the NO2 European Directive. Journal of Environmental Monitoring. 2003;5(4):529-40. [Crossref] [Google Scholar] [PubMed]
- Thunis P, Pederzoli A, Pernigotti D. Performance criteria to evaluate air quality modeling applications. Atmospheric Environment. 2012;59:476-82. [Crossref] [Google Scholar]
- Kumie A, Worku A, Tazu Z, Tefera W, Asfaw A, Boja G, et al. Fine particulate pollution concentration in Addis Ababa exceeds the WHO guideline value: Results of 3 years of continuous monitoring and health impact assessmen Environmental Epidemiology. 2021;5(3):e155.. [Crossref] [Google Scholar] [PubMed]
- Flanagan E, Mattisson K, Walles J, Abera A, Eriksson A, Balidemaj F, et al. Air pollution and urban green space: evidence of environmental injustice in Adama, Ethiopia. Frontiers in Sustainable Cities. 2021;3:728384. [Crossref] [Google Scholar]
- Roba ZR, Aiymeku TG, Gurmessa TT. Impact of land cover changes on land surface temperature variations in Adama City, Ethiopia. Journal of water and climate change. 2024;15(10):5041-59. [Crossref] [Google Scholar]
- Jovašević-Stojanović M, Bartonova A, Topalović D, Lazović I, Pokrić B, Ristovski Z. On the use of small and cheaper sensors and devices for indicative citizen-based monitoring of respirable particulate matter. Environmental Pollution. 2015;206:696-704. [Crossref] [Google Scholar] [PubMed]
- Bulot FM, Johnston SJ, Basford PJ, Easton NH, Apetroaie-Cristea M, Foster GL, et al. Long-term field comparison of multiple low-cost particulate matter sensors in an outdoor urban environment. Scientific reports. 2019;9(1):7497. [Crossref] [Google Scholar] [PubMed]
- Kuula J, Mäkelä T, Aurela M, Teinilä K, Varjonen S, González Ó, Timonen H. Laboratory evaluation of particle-size selectivity of optical low-cost particulate matter sensors. Atmospheric Measurement Techniques. 2020 May 15;13(5):2413-23. [Crossref] [Google Scholar]
- Weber T, Wiseman NA, Kock A. Global ocean methane emissions dominated by shallow coastal waters. Nature communications. 2019;10(1):4584. [Crossref] [Google Scholar] [PubMed]
- South Coast Air Quality Management District (SCAQMD). Field Evaluation Sensirion SPS30 Evaluation Kit Background. 2019.
- MANZARI TAVAKOLI AM. Advanced sensor integration and enviromental monitoring: utilizing Arduino and LabVIEW for air quality analysis. [Google Scholar]
- Dingemanse JD, Tademe A. Developing and testing a PM2. 5 low-cost sensor in Ethiopia under ambient and indoor air pollution conditions. Clean Air Journal. 2023;33(2):1-5. [Crossref] [Google Scholar]
- Volckens J, Quinn C, Leith D, Mehaffy J, Henry CS, Miller‐Lionberg D. Development and evaluation of an ultrasonic personal aerosol sampler. Indoor air. 2017;27(2):409-16. [Crossref] [Google Scholar] [PubMed]
- Afshar-Mohajer N, Foos R, Ramachandran G, Volckens J. Field evaluation of the ultrasonic personal aerosol sampler (UPAS) for respirable dust exposure in a taconite mine. Annals of work exposures and health. 2021;65(1):127-35. [Crossref] [Google Scholar] [PubMed]
- Weight N. Mettler Analytical Balance AE240 Dual Range Balance. pp. 1–9, 1979.
- Dingemanse JD. Ethiopian Journal of Water Science and Technology ( EJWST ) . Evaluation of Three Low-Cost Particulate Matter ( PM2 . 5 ) Sensors for Ambient and High Exposure Conditions in Arba Minch , Ethiopia,” vol. 4, pp. 33–61, 2021.
- WALDÉN J, HILLAMO R, AURELA M, MÄKELÄ T. DEMONSTRATION OF THE EQUIVALENCE OF PM. [Google Scholar]
- Subasi A. Practical machine learning for data analysis using python. Academic Press; 2020. [Crossref] [Google Scholar]
- Harris CR, Millman KJ, Van Der Walt SJ, Gommers R, Virtanen P, Cournapeau D, et al. Array programming with NumPy. nature. 2020;585(7825):357-62. [Crossref] [Google Scholar] [PubMed]
- SunPy Community, Barnes WT, Bobra MG, Christe SD, Freij N, Hayes LA, et al. The SunPy project: Open source development and status of the version 1.0 core package. The Astrophysical Journal. 2020;890(1):68. [Crossref] [Google Scholar]
- Virtanen P, Gommers R, Oliphant TE, Haberland M, Reddy T, Cournapeau D, et al. SciPy 1.0: fundamental algorithms for scientific computing in Python. Nature methods. 2020;17(3):261-72. [Google Scholar] [PubMed]
- Boylan JW, Russell AG. PM and light extinction model performance metrics, goals, and criteria for three-dimensional air quality models. Atmospheric environment. 2006;40(26):4946-59. [Crossref] [Google Scholar]
- Duvall R, Clements A, Hagler G, Kamal A, Kilaru V, Goodman L, et al. Performance testing protocols, metrics, and target values for fine particulate matter air sensors: use in ambient, outdoor, fixed site, non-regulatory supplemental and informational monitoring applications. Us epa office of research and development. 2021. [Google Scholar]
- US-EPA. How to Evaluate Low-Cost Sensors by Collocation with Federal Reference Method Monitors. p. 45, 2022.
- Components for Evaluation of Direct-Reading Monitors for Gases and Vapors. 2012.
- Air quality guidelines for particulate matter, ozone, nitrogen dioxide and sulfur dioxide. 2005.

Article Processing Timeline
| Stage 1 |
Initial Quality & Plagiarism Check The manuscript is reviewed for journal scope, basic submission requirements, ethical compliance, and similarity/plagiarism concerns. |
| Stage 2 |
Editorial Assessment & Peer Review Manuscripts that pass the initial screening undergo editorial assessment and independent peer review in accordance with the journal's peer-review policy. |
| Stage 3 |
Revision & Editorial Decision Authors may be requested to revise their manuscript based on reviewer and editor comments. A final editorial decision is made after the required review and revision stages are completed. |
| Stage 4 |
Production & Publication Accepted manuscripts proceed to production, author proofing, final quality checks, and online publication. |
EDITORIAL & PUBLICATION INFORMATION
| English | Publication Language |
| Single-Blind | Peer-Review Model |
| 17% | Acceptance Rate |
| <18% | Similarity Screening Guideline |
| Open Access | Access Model |
All manuscripts undergo editorial assessment and originality screening as part of the journal's evaluation process. The acceptance rate shown is based on journal-level editorial data and may change over time. Similarity reports are assessed editorially and are not interpreted solely on the basis of a numerical similarity score.
Why Publish with us?
Ethics & Policies
Editorial & Management
Useful Links
Journal Highlights
Open Access Journals
Journal Flyer