
Journal of Plant Science and Biotechnology
ISSN:
3139-6437 (Online)
DOI Prefix (Crossref): 10.67238
 Download PDF

Department of Agriculture and Natural Resources, Persian Gulf University, Bushehr, Iran
ABSTRACT
Salinity is a major abiotic constraint to wheat production, particularly in dry and semi-arid environments where saline irrigation water and salt-affected soils limit crop growth and yield. Salicylic acid (SA) is a signaling compound that can modify plant growth and physiological responses to environmental stress. The present study evaluated the responses of four wheat cultivars to salinity and examined whether foliar SA application could alleviate adverse effects of salt stress. The experiment was conducted in 2019 in the greenhouse of the Faculty of Agriculture and Natural Resources, Persian Gulf University, near Borazjan, Iran. A factorial experiment involving four cultivars, two salinity levels, and five SA concentrations was arranged in a randomized complete block design with three replications. The cultivars were the bread wheats Kuhdasht and Chamran 2 and the durum wheats Dehdasht and Shabrang. Salinity treatments were a non-saline control and 80 mM, and SA treatments were 0, 0.25, 0.5, 1, and 2 mM. Morphological, yield-related, chlorophyll, and proline traits were measured. Analysis of variance showed significant cultivar, salinity, and SA effects for many traits, with significant interactions for several characters. Salinity generally reduced plant height, flag-leaf dimensions, peduncle and awn length, fertile spikelets, seeds per spike, spike weight, and thousand-seed weight, whereas proline accumulation increased. SA application improved several growth and yield-related traits and increased proline and chlorophyll responses in a concentration- and genotype-dependent manner. Kuhdasht had the highest thousand-seed weight across the two salinity conditions, and Kuhdasht and Chamran 2 showed relatively favorable agronomic performance under salinity. Grain weight per spike was positively correlated with spike weight (r = 0.62) and seeds per spike (r = 0.43). Stepwise regression retained seven traits and explained 88% of the variation in grain weight per spike. Path analysis showed positive direct effects of flag-leaf length, thousand-seed weight, seeds per spike, spike weight, and leaf number. Principal component and cluster analyses further separated the evaluated cultivars according to their multivariate phenotypic responses. The results demonstrate the value of combining agronomic, physiological, and multivariate traits when screening wheat germplasm for salinity response and indicate that spike weight and seeds per spike may be useful selection criteria in breeding programs.
Keywords: Wheat; Salinity Stress; Salicylic Acid; Proline; Chlorophyll; Wheat Breeding; Genetic Variation; Stress Tolerance
INTRODUCTION
Salinity is one of the most important abiotic stresses limiting agricultural productivity in arid and semi-arid regions. The problem is intensified by inadequate rainfall, high evaporative demand, the use of saline irrigation water, and insufficient drainage. Salt accumulation can alter the soil-water relationship and expose plants simultaneously to osmotic stress and ionic stress. In wheat, these effects can reduce leaf expansion, photosynthetic performance, reproductive development, grain filling, and final yield. The severity of the response depends on genotype, developmental stage, salt concentration, duration of exposure, and environmental conditions [1-5].
Wheat is particularly important for food security, and improving its performance on salt-affected land is therefore an important breeding objective. Considerable variation in salt response exists among wheat genotypes. Field and controlled-environment studies have shown differences among bread and durum wheats in growth, yield components, ion regulation, and physiological responses to salinity [6,7,8]. The existence of this variation provides an opportunity for breeders to identify adapted parental material and selection traits for improving salinity tolerance.
Salinity affects plants through both osmotic and ionic mechanisms. Early responses include reduced water availability and stomatal adjustment, whereas prolonged exposure can result in excessive accumulation of sodium and chloride, nutrient imbalance, oxidative stress, and impairment of photosynthetic processes. High salt concentrations can also interfere with chlorophyll formation and photosystem activity, thereby reducing carbon assimilation [4,9]. Yield components such as spike development, seeds per spike, spike weight, and grain weight are consequently important indicators of plant response. Studies of salt-stressed wheat have demonstrated that the timing and intensity of salinity can substantially modify yield components [10,11].
An important component of wheat improvement is the identification of measurable traits that are closely associated with grain production under stress. Correlation analysis describes the degree of association among traits, but correlation alone cannot distinguish direct effects from indirect effects. Path analysis can partition these relationships and identify traits with stronger direct associations with yield [12]. Stepwise regression and multivariate methods such as principal component analysis and cluster analysis can further summarize complex variation among genotypes and assist breeders in identifying useful selection criteria [13].
Salicylic acid is an endogenous phenolic signaling compound involved in plant growth, development, photosynthesis, and responses to biotic and abiotic stress. Exogenous SA has been reported to modify antioxidant activity, photosynthetic performance, ion accumulation, osmotic adjustment, and the activity of stress-related enzymes. Its effects can vary with genotype, concentration, method of application, developmental stage, and stress intensity [14,15,16]. In wheat, salicylic acid has been associated with improved growth and physiological performance under salt stress [17-21].
Proline accumulation is another commonly measured response to salinity. Proline can contribute to osmotic adjustment and may be associated with protection of cellular structures under stress. The classical colorimetric procedure of Bates is widely used for determining free proline [22]. In salt-stressed wheat, increased proline has been reported as part of the physiological response to stress, although its relationship with tolerance should be interpreted together with growth and yield performance rather than as an independent indicator.
Although SA-mediated responses to salinity have been studied in wheat, the usefulness of combined morphological, physiological, and multivariate information for selecting cultivars under a defined greenhouse salinity treatment remains important. The present study was therefore designed to evaluate four wheat cultivars under 80 mM salinity and different foliar SA concentrations. The specific objectives were to: (i) quantify cultivar differences in morphological, yield-related, chlorophyll, and proline traits; (ii) determine the effects of salinity and SA and their interactions; (iii) identify traits associated with grain weight per spike using correlation, regression, and path analyses; and (iv) classify cultivars using principal component and cluster analyses. The overall aim was to identify phenotypic traits that may support screening and selection in wheat breeding for saline environments.
MATERIALS AND METHODS
Experimental Site
The experiment was conducted during the 2019 growing season in the research greenhouse of the Faculty of Agriculture and Natural Resources, Persian Gulf University, approximately 8 km southeast of Borazjan, Iran. The experimental site was reported at approximately 110 m above sea level, 51°17′ E longitude and 21°02′ N latitude. The region is characterized as hot and semi-arid to desert-like, with low annual precipitation and high summer temperatures. The greenhouse experiment was used to provide controlled conditions for comparing cultivar responses to salinity and foliar SA. The original thesis reports regional climatic information (annual precipitation approximately 230–250 mm, regional temperature extremes of about −5 to 51 °C, and relative humidity of approximately 40–90%), but it does not provide continuous greenhouse temperature or relative-humidity records. These regional values are therefore not presented as measured greenhouse conditions.
Plant Materials and Experimental Design
Four wheat cultivars were evaluated: Kuhdasht and Chamran 2 (bread wheat) and Dehdasht and Shabrang (durum wheat). The experiment was factorial with three fixed factors: cultivar (4 levels), salinity (2 levels), and foliar salicylic acid (SA) concentration (5 levels), giving 40 treatment combinations. Treatments were arranged in a randomized complete block design (RCBD) with three blocks/replications. The pot was the experimental unit. Ten seeds were initially sown per pot and five plants were retained after emergence. For traits measured on multiple plants, measurements from the five plants within a pot were averaged so that each pot contributed one observation to the statistical analysis. Thus, the five plants were subsamples within the pot rather than independent experimental units.
Two salinity levels were imposed: a non-saline control and 80 mM salinity, reported in the thesis as approximately equivalent to an electrical conductivity of about 8 dS m−1. Five foliar SA concentrations were used: 0, 0.25, 0.5, 1, and 2 mM. The control treatment received no SA.
Pot Preparation, Sowing, and Crop Management
Pots were filled with a uniform growing medium consisting of 15% washed animal manure, 30% field clay soil, and 55% sandy soil by volume. Based on the soil-test recommendations reported in the original thesis, triple superphosphate was incorporated before sowing at an equivalent rate of 1 g per pot, while urea was supplied at 7 g per pot in three split applications during tillering, stem elongation, and heading. The original thesis does not report initial pH or electrical conductivity of the growing medium; these values were therefore not added or estimated.
Seeds were disinfected with Vitavax (carboxin–thiram) at a ratio of 2 per thousand and sown on 10 January 2019 at a depth of approximately 3 cm. Ten seeds of each cultivar were initially sown in each pot. After emergence and at the three-leaf stage, excess seedlings were removed and five plants were retained per pot. Irrigation before stem elongation was generally performed according to crop demand and environmental conditions, approximately every three days. Subsequent irrigation was adjusted according to the treatment. Weeds were removed manually throughout the experiment.
Salinity Treatment
Plants were irrigated with ordinary water until establishment at the four-leaf stage. Salinity was initiated at the third irrigation. The thesis records a gradual salt treatment beginning with 40 mM and increasing over approximately one week to the target 80 mM concentration. The original experimental record describes this as a salt solution but does not identify the salt compound or provide a direct measurement of solution EC. Therefore, the previously stated equivalence of approximately 8 dS m−1 is reported here only as the value stated in the original thesis and should not be interpreted as an experimentally verified EC measurement. Control pots were maintained without the salt treatment. After the target concentration was reached, irrigation was continued according to the experimental treatment and crop water requirement.
Salicylic Acid Preparation and Foliar Application
SA solutions of 0.25, 0.5, 1, and 2 mM were prepared by dissolving 34.5, 69, 138, and 276 mg SA, respectively, in 10 mL of 96% ethanol and bringing each solution to 1 L with distilled water. The solutions were mixed for approximately 45 min on a magnetic stirrer. Each concentration was then prepared to a total batch volume of 3 L according to the experimental requirement. The ethanol content of the prepared SA solutions was therefore 1% (v/v) before any further dilution. The original thesis does not state that the untreated control received an equivalent ethanol concentration; consequently, this point is reported transparently rather than inferred. Foliar application was performed twice at the tillering stage, uniformly between approximately 06:30 and 07:30 under conditions without strong wind or intense sunlight. The original record specifies a 3-L batch for each SA concentration but does not provide a separately recorded spray volume per pot or the exact interval between the two applications.
Measurement of Morphological and Yield-Related Traits
Plant height, flag-leaf length and width, flag-leaf area, number of leaves, peduncle length, awn length, spike length with awns, spike length without awns, fertile spikelets per spike, seeds per spike, spike weight, grain weight per spike, and thousand-seed weight were measured. At harvest, spike and grain measurements were recorded for the experimental units. Thousand-seed weight was estimated by counting 100 randomly selected seeds, determining their mass, and multiplying the value by ten.
Chlorophyll a and b were determined using the Arnon procedure. Approximately 0.5 g fresh leaf tissue was homogenized after grinding with liquid nitrogen, extracted with 20 mL of 80% acetone, and centrifuged at 6000 rpm for 10 min. Absorbance was measured at 663 and 645 nm. Chlorophyll concentrations were calculated as follows, where A663 and A645 are absorbance values, V is the acetone/extract volume (mL), and W is fresh tissue mass (g):
Chlorophyll a (mg g−1 FW) = [12.7(A663) − 2.69(A645)] × V/(1000 × W)
Chlorophyll b (mg g−1 FW) = [22.9(A645) − 4.68(A663)] × V/(1000 × W)
Total chlorophyll (mg g−1 FW) = [(20.2 × A645) − (8.02 × A663)] × V/(1000 × W)
The bibliographic record for the chlorophyll method was corrected to the verified Arnon (1949) citation.
Proline Determination
Free proline was determined according to Bates et al. (1973). Approximately 0.25 g of fresh leaf tissue was homogenized in 5 mL of 3% phosphosalicylic acid and filtered. Two millilitres of filtrate were reacted with 2 mL ninhydrin reagent and 2 mL acetic acid and heated at 100°C for one hour. The reaction was stopped in an ice bath, followed by extraction with 4 mL toluene and vortex mixing. The absorbance of the upper phase was measured at 520 nm. Proline concentration was calculated from an L-proline standard curve and expressed per gram fresh weight.
Statistical Analysis
Normality of the measured traits was checked using SAS before analysis of variance. Data were analyzed with SAS version 9.4. The factorial RCBD model was: Yijkl = μ + Bi + Cj + Sk + Al + (CS)jk + (CA)jl + (SA)kl + (CSA)jkl + εijkl, where μ is the overall mean, B is block, C is cultivar, S is salinity, A is SA concentration, and ε is experimental error. The experimental unit was the pot, with the mean of the five retained plants used where repeated plant-level measurements were made. Degrees of freedom were 2 for block, 3 for cultivar, 1 for salinity, 4 for SA, 3 for cultivar × salinity, 12 for cultivar × SA, 4 for salinity × SA, 12 for the three-way interaction, and 78 for error. Duncan's multiple range test (DMRT) at α = 0.05 was applied to factor or interaction means corresponding to significant ANOVA effects; mean separation letters are reported consistently in the relevant treatment tables. Pearson correlation, stepwise regression, path analysis, principal component analysis (PCA), and Ward clustering based on squared Euclidean distance were performed as described below.
Because the thesis tables report mean squares rounded to the displayed precision rather than the original SAS probability output, the F statistics and P values in the revised ANOVA summary table were reconstructed from the reported mean squares and the stated degrees of freedom. These P values should therefore be regarded as recalculated values from the thesis table, not as a substitute for the original SAS output file.
RESULTS
|
Trait |
Cultivar |
Salinity |
SA |
Cultivar × Salinity |
Cultivar × SA |
Salinity × SA |
Cultivar × Salinity × SA |
|
Plant height |
F=98.69; P=<0.0001 |
F=493.51; P=<0.0001 |
F=66.07; P=<0.0001 |
F=6.95; P=0.0003 |
F=1.46; P=0.1570 |
F=4.17; P=0.0041 |
F=0.85; P=0.5984 |
|
Flag-leaf length |
F=29.98; P=<0.0001 |
F=686.82; P=<0.0001 |
F=59.24; P=<0.0001 |
F=16.67; P=<0.0001 |
F=3.59; P=0.0003 |
F=1.67; P=0.1646 |
F=3.80; P=0.0002 |
|
Flag-leaf width |
F=22.00; P=<0.0001 |
F=880.00; P=<0.0001 |
F=98.00; P=<0.0001 |
F=12.00; P=<0.0001 |
F=1.00; P=0.4571 |
F=6.00; P=0.0003 |
F=3.40; P=0.0005 |
|
Flag-leaf area |
F=11.09; P=<0.0001 |
F=1183.24; P=<0.0001 |
F=106.92; P=<0.0001 |
F=20.73; P=<0.0001 |
F=2.97; P=0.0019 |
F=1.76; P=0.1461 |
F=2.92; P=0.0022 |
|
Leaf number |
F=8.57; P=<0.0001 |
F=80.61; P=<0.0001 |
F=7.14; P=<0.0001 |
F=0.53; P=0.6626 |
F=0.08; P=1.0000 |
F=0.47; P=0.7580 |
F=0.59; P=0.8425 |
|
Peduncle length |
F=53.62; P=<0.0001 |
F=294.48; P=<0.0001 |
F=46.15; P=<0.0001 |
F=5.24; P=0.0024 |
F=2.49; P=0.0082 |
F=2.67; P=0.0384 |
F=1.12; P=0.3536 |
|
Awn length |
F=47.70; P=<0.0001 |
F=450.52; P=<0.0001 |
F=36.87; P=<0.0001 |
F=5.26; P=0.0023 |
F=1.70; P=0.0838 |
F=13.70; P=<0.0001 |
F=1.65; P=0.0945 |
|
Spike length with awn |
F=10.03; P=<0.0001 |
F=247.06; P=<0.0001 |
F=25.11; P=<0.0001 |
F=1.03; P=0.3850 |
F=0.25; P=0.9946 |
F=0.11; P=0.9783 |
F=7.28; P=<0.0001 |
|
Spikelet length without awn |
F=18.24; P=<0.0001 |
F=93.67; P=<0.0001 |
F=1.85; P=0.1281 |
F=2.22; P=0.0927 |
F=1.63; P=0.1003 |
F=2.24; P=0.0723 |
F=4.17; P=<0.0001 |
|
Fertile spikelets |
F=12.75; P=<0.0001 |
F=402.50; P=<0.0001 |
F=29.38; P=<0.0001 |
F=2.62; P=0.0563 |
F=0.54; P=0.8807 |
F=6.38; P=0.0002 |
F=1.13; P=0.3527 |
|
Seeds per spike |
F=609.49; P=<0.0001 |
F=761.94; P=<0.0001 |
F=90.41; P=<0.0001 |
F=7.50; P=0.0002 |
F=3.09; P=0.0013 |
F=3.65; P=0.0089 |
F=1.54; P=0.1276 |
|
Spike weight |
F=39.50; P=<0.0001 |
F=499.00; P=<0.0001 |
F=55.50; P=<0.0001 |
F=6.00; P=0.0010 |
F=2.00; P=0.0352 |
F=2.50; P=0.0492 |
F=1.20; P=0.2983 |
|
Grain weight per spike |
F=6.33; P=0.0007 |
F=638.33; P=<0.0001 |
F=70.00; P=<0.0001 |
F=5.00; P=0.0032 |
F=1.83; P=0.0569 |
F=11.67; P=<0.0001 |
F=1.33; P=0.2173 |
|
Thousand-seed weight |
F=162.96; P=<0.0001 |
F=359.53; P=<0.0001 |
F=37.61; P=<0.0001 |
F=2.10; P=0.1075 |
F=0.77; P=0.6814 |
F=0.88; P=0.4777 |
F=0.51; P=0.9034 |
|
Proline |
F=316.67; P=<0.0001 |
F=3866.67; P=<0.0001 |
F=326.67; P=<0.0001 |
F=60.00; P=<0.0001 |
F=40.00; P=<0.0001 |
F=70.00; P=<0.0001 |
F=16.67; P=<0.0001 |
|
Chlorophyll a |
F=1600.00; P=<0.0001 |
F=12500.00; P=<0.0001 |
F=1000.00; P=<0.0001 |
F=1000.00; P=<0.0001 |
F=150.00; P=<0.0001 |
F=100.00; P=<0.0001 |
F=200.00; P=<0.0001 |
|
Chlorophyll b |
F=65000.00; P=<0.0001 |
F=600000.00; P=<0.0001 |
F=90000.00; P=<0.0001 |
F=20000.00; P=<0.0001 |
F=3500.00; P=<0.0001 |
F=10000.00; P=<0.0001 |
F=3500.00; P=<0.0001 |
|
Total chlorophyll |
F=12000.00; P=<0.0001 |
F=146000.00; P=<0.0001 |
F=22000.00; P=<0.0001 |
F=10800.00; P=<0.0001 |
F=1600.00; P=<0.0001 |
F=1200.00; P=<0.0001 |
F=1400.00; P=<0.0001 |
Note: F statistics were calculated as MS_effect/MS_error using the thesis-reported mean squares. P values were recalculated from the reported F statistics and df1/df2 = 78. Because the source mean squares are rounded, these P values are reconstructed/approximate rather than the original SAS output values.
Overall Effects of Cultivar, Salinity, and SA
Analysis of variance showed significant effects of cultivar, salinity, and SA for many measured traits. The interaction structure was trait-specific. Significant cultivar × salinity effects were observed for most morphological and physiological traits, whereas cultivar × SA and salinity × SA effects also occurred for multiple traits. The three-way cultivar × salinity × SA interaction was significant for flag-leaf length, flag-leaf width, flag-leaf area, spike length with awns, spikelet length without awns, proline, chlorophyll a, chlorophyll b, and total chlorophyll, but was not significant for plant height, number of leaves, peduncle length, awn length, fertile spikelets, seeds per spike, spike weight, grain weight per spike, or thousand-seed weight. Accordingly, the interpretation of treatment means below emphasizes the relevant interaction rather than treating main effects as independent when interactions were significant.
|
Factor |
Levels |
Replication |
Design |
|
Cultivar |
Kuhdasht; Chamran 2; Dehdasht; Shabrang |
3 |
Factorial |
|
Salinity |
0 and 80 mM |
3 |
Factorial |
|
SA |
0, 0.25, 0.5, 1, 2 mM |
3 |
Factorial |
Effects of Salinity on Growth and Yield-Related Traits
Salinity produced clear reductions in several vegetative and reproductive traits. For example, plant height decreased from 73.27 to 64.68 cm in Kuhdasht, from 73.10 to 64.47 cm in Dehdasht, from 78.78 to 72.39 cm in Shabrang, and from 78.66 to 67.56 cm in Chamran 2 when the salinity level increased from 0 to 80 mM. Flag-leaf width, peduncle length, awn length, spike dimensions, fertile spikelets, seeds per spike, spike weight, and thousand-seed weight also showed generally unfavorable responses to increased salinity. The magnitude of the response differed among cultivars, demonstrating genotype-dependent variation in salinity response.
For flag-leaf area, the response was more complex than for plant height and some other traits. The detailed mean comparisons showed significant cultivar × salinity and higher-order interactions, with some treatment combinations maintaining relatively large flag-leaf areas under salinity while other combinations showed marked reductions. For example, the smallest reported flag-leaf area occurred in Kuhdasht under 80 mM salinity without SA, whereas larger values were recorded in several non-saline treatments with 2 mM SA. This indicates that leaf-area response cannot be interpreted from salinity alone and should be considered in relation to cultivar and SA treatment.
Seeds per spike declined with salinity. The highest cultivar mean under the non-saline condition was 56.11 seeds per spike in Shabrang, whereas the lowest reported cultivar mean under 80 mM salinity was 36.04 seeds per spike in Kuhdasht. For the combined salinity × SA comparison, 52.41 seeds per spike were recorded under non-saline conditions with 2 mM SA, compared with 37.41 under 80 mM salinity without SA.
Spike weight also decreased as salinity increased. The highest reported spike weight among cultivar × salinity means was 2.82 g for Dehdasht without salinity, whereas lower values occurred under 80 mM salinity, including 1.94 g in Kuhdasht. Thousand-seed weight was significantly affected by cultivar, salinity, and SA, although their interactions were not significant for this trait. Kuhdasht had the highest overall thousand-seed weight, with a mean of 43.81 g.
|
Trait |
Cultivar / treatment |
Condition |
Reported value |
|
Plant height |
Kuhdasht |
0 → 80 mM |
73.27 → 64.68 cm |
|
Plant height |
Chamran 2 |
0 → 80 mM |
78.66 → 67.56 cm |
|
Seeds per spike |
Shabrang |
0 mM |
56.11 |
|
Seeds per spike |
Kuhdasht |
80 mM |
36.04 |
|
Spike weight |
Dehdasht |
0 mM |
2.82 g |
|
Spike weight |
Kuhdasht |
80 mM |
1.94 g |
|
Thousand-seed weight |
Kuhdasht |
Across salinity levels |
43.81 g |
Effects of Salicylic Acid
SA application produced significant improvements in several traits. Across the evaluated cultivars, increasing SA concentration generally increased plant height, flag-leaf area, peduncle length, flag-leaf length, seeds per spike, spike weight, proline, and chlorophyll a relative to untreated plants. The response was not uniform for every trait or cultivar, indicating that SA concentration and genetic background influenced the magnitude of the response.
In Kuhdasht under non-saline conditions, plant height increased from 62.69 cm without SA to 73.35 cm at the highest SA concentration. The number of seeds per spike increased from 36.00 to 42.83, and spike weight increased from 1.91 to 2.72 g across the corresponding SA treatments. These results indicate that foliar SA was associated with improved vegetative and reproductive performance in several treatment combinations.
For fertile spikelets, salinity reduced the number across SA levels, whereas increasing SA increased fertile spikelets at both salinity levels. The combined comparison showed 16.27–16.96 fertile spikelets under several SA treatments without salinity, while the lowest value, 13.16, occurred at 80 mM salinity without SA.
SA also influenced the physiological traits. Proline increased with SA concentration in all cultivars. The highest cultivar × SA value was 0.78 µmol g−1 fresh weight in Kuhdasht at 2 mM SA and 0.77 µmol g−1 fresh weight in Dehdasht at 2 mM. Under salinity, proline increased further; the maximum combined value was 0.98 µmol g−1 fresh weight in Dehdasht at 80 mM salinity and 2 mM SA.
Chlorophyll responses were genotype and concentration-dependent. Chlorophyll a generally declined with salinity but increased with SA in several combinations. The highest reported chlorophyll a value was 0.654 in Dehdasht under non-saline conditions with 2 mM SA. Chlorophyll b showed a more variable response, with the highest reported value of 0.861 in Chamran 2 at 80 mM salinity with 0.5 mM SA. Total chlorophyll also varied significantly among combinations, with a maximum reported value of 1.444 in Chamran 2 at 80 mM salinity with 0.5 mM SA.
Correlation Analysis
Grain weight per spike, used as an indicator of grain productivity at the spike level, showed a significant positive correlation with spike weight (r = 0.62) and seeds per spike (r = 0.43). These relationships indicate that heavier spikes and a greater number of grains per spike were associated with greater grain weight under the experimental conditions.
Several strong associations were observed among component traits. Chlorophyll a and total chlorophyll were highly correlated (r = 0.93), as were flag-leaf width and flag-leaf area (r = 0.93), flag-leaf length and flag-leaf area (r = 0.91), thousand-seed weight and seeds per spike (r = 0.91), and thousand-seed weight and leaf number (r = 0.90). The relationships among these traits demonstrate the interdependence of morphological and physiological characteristics under the imposed treatments.
|
Step |
Predictor |
Partial R² |
Cumulative R² |
Regression coefficient |
Note |
|
1 |
Flag-leaf area |
0.720 |
0.720 |
— |
First variable entered |
|
2 |
Spike weight |
0.096 |
0.816 |
0.178 |
Added variance explained |
|
3 |
Flag-leaf length |
0.011 |
0.827 |
0.047 |
Added variance explained |
|
4 |
Seeds per spike |
0.015 |
0.842 |
0.011 |
Added variance explained |
|
5 |
Thousand-seed weight |
0.023 |
0.866 |
0.016 |
Added variance explained |
|
6 |
Awn length |
0.007 |
0.874 |
−0.036 |
Added variance explained |
|
7 |
Peduncle length |
0.004 |
0.878 |
−0.011 |
Added variance explained |
|
8 |
Leaf number |
0.005 |
0.883 |
0.138 |
Final model |
Stepwise Regression and Path Analysis
Stepwise regression was conducted with grain weight per spike as the dependent variable and the measured morphological, yield-related, and physiological traits as candidate predictors. Flag-leaf area entered first and accounted for 72.0% of the variation (R² = 0.720). Spike weight, flag-leaf length, seeds per spike, thousand-seed weight, awn length, peduncle length, and leaf number subsequently entered the model. The final model had R² = 0.883, indicating that the retained variables explained approximately 88.3% of the variation in grain weight per spike in this dataset. The regression coefficients from the thesis were 0.178 for spike weight, 0.047 for flag-leaf length, 0.011 for seeds per spike, 0.016 for thousand-seed weight, −0.036 for awn length, −0.011 for peduncle length, and 0.138 for leaf number, with an intercept of −0.752. The original thesis did not report adjusted R², model-selection information criteria (AIC/BIC), tolerance/VIF statistics, or the entry/removal P values. These quantities cannot be reconstructed reliably from the published summary table alone and therefore are not invented here. Given the strong correlations among several predictors, the regression results should be interpreted as exploratory and subject to multicollinearity concerns.
Path analysis showed positive direct effects of flag-leaf length (0.50), thousand-seed weight (0.35), seeds per spike (0.31), spike weight (0.28), and leaf number (0.12), while awn length (−0.31) and peduncle length (−0.11) had negative direct effects. These are statistical direct effects within the specified path model; they do not establish biological causation.
Path analysis provided additional information about the relationships between explanatory traits and grain weight per spike. The largest positive direct effects were associated with flag-leaf length (0.50), thousand-seed weight (0.35), seeds per spike (0.31), spike weight (0.28), and leaf number (0.12). Awn length and peduncle length showed negative direct effects of approximately −0.31 and −0.11, respectively. The positive direct effects of spike weight and seeds per spike were consistent with their positive correlations with grain weight per spike.
|
Trait / analysis |
Coefficient |
Interpretation |
|
Spike weight ↔ grain weight per spike |
r = 0.62 |
Positive and significant |
|
Seeds per spike ↔ grain weight per spike |
r = 0.43 |
Positive and significant |
|
Flag-leaf length |
Direct effect = 0.50 |
Largest positive direct effect |
|
Thousand-seed weight |
Direct effect = 0.35 |
Strong positive direct effect |
|
Seeds per spike |
Direct effect = 0.31 |
Positive direct effect |
|
Spike weight |
Direct effect = 0.28 |
Positive direct effect |
|
Final stepwise model |
R² ≈ 0.88 |
Seven traits retained |
|
Trait |
PC1 loading |
PC2 loading |
PC3 loading |
|
Thousand-seed weight |
−0.323 |
−0.172 |
−0.028 |
|
Plant height |
−0.166 |
0.311 |
0.21 |
|
Flag-leaf length |
−0.304 |
0.199 |
−0.092 |
|
Flag-leaf width |
0.195 |
0.099 |
0.401 |
|
Flag-leaf area |
−0.261 |
0.264 |
0.092 |
|
Leaf number |
−0.329 |
−0.159 |
0.0002 |
|
Peduncle length |
−0.242 |
0.22 |
0.245 |
|
Awn length |
−0.260 |
−0.271 |
−0.054 |
|
Spike length with awn |
−0.113 |
−0.377 |
0.036 |
|
Spikelet length without awn |
0.314 |
0.188 |
0.052 |
|
Fertile spikelets |
−0.024 |
0.387 |
−0.110 |
|
Seeds per spike |
0.347 |
0.05 |
0.11 |
|
Spike weight |
0.235 |
−0.263 |
0.185 |
|
Grain weight per spike |
0.201 |
−0.262 |
−0.250 |
|
Proline |
−0.315 |
−0.190 |
0.0009 |
|
Chlorophyll a |
0.054 |
−0.279 |
0.357 |
|
Chlorophyll b |
−0.024 |
0.036 |
0.497 |
|
Total chlorophyll |
0.019 |
−0.155 |
0.459 |
Principal Component and Cluster Analyses
PCA based on the 18 measured traits identified three components with eigenvalues greater than one. The three components had eigenvalues of 7.73, 6.27, and 3.99 and explained 42.94%, 34.87%, and 22.17% of the variance, respectively, for a cumulative 99.98% of the variation. The first component had relatively strong positive loadings for spikelet length without awns (0.314), seeds per spike (0.347), and several other yield-related variables, while thousand-seed weight (−0.323), flag-leaf length (−0.304), leaf number (−0.329), and proline (−0.315) loaded negatively. The second component was characterized by positive loadings for plant height (0.311), flag-leaf area (0.264), and fertile spikelets (0.387), with negative loadings for spike length with awns (−0.377), awn length (−0.271), spike weight (−0.263), grain weight per spike (−0.262), and chlorophyll a (−0.279). The third component had relatively large positive loadings for chlorophyll b (0.497), total chlorophyll (0.459), and flag-leaf width (0.401).
The original thesis abstract contained a different statement referring to seven components and approximately 77% variance. The detailed PCA results table in the thesis reports three components with eigenvalues >1 and 99.98% cumulative variance; the revised manuscript therefore follows the detailed statistical table and explicitly notes the discrepancy rather than combining the two results. A PCA loading plot has been added to the revised manuscript.
Ward's hierarchical clustering using squared Euclidean distance grouped Kuhdasht with Chamran 2 and Dehdasht with Shabrang. The original dendrogram is included in the revised manuscript. Because only four cultivars were evaluated and the analysis used measured phenotypic/physiological traits, the clustering should be interpreted as phenotypic grouping rather than evidence of genome-wide genetic relatedness.
Ward's hierarchical clustering using squared Euclidean distance grouped Kuhdasht with Chamran 2 and Dehdasht with Shabrang. The grouping broadly followed the bread-wheat versus durum-wheat distinction in this four-cultivar dataset. Because only four cultivars were evaluated and no molecular marker data were included, this result should be interpreted as phenotypic/physiological grouping rather than direct evidence of genome-wide genetic relatedness.
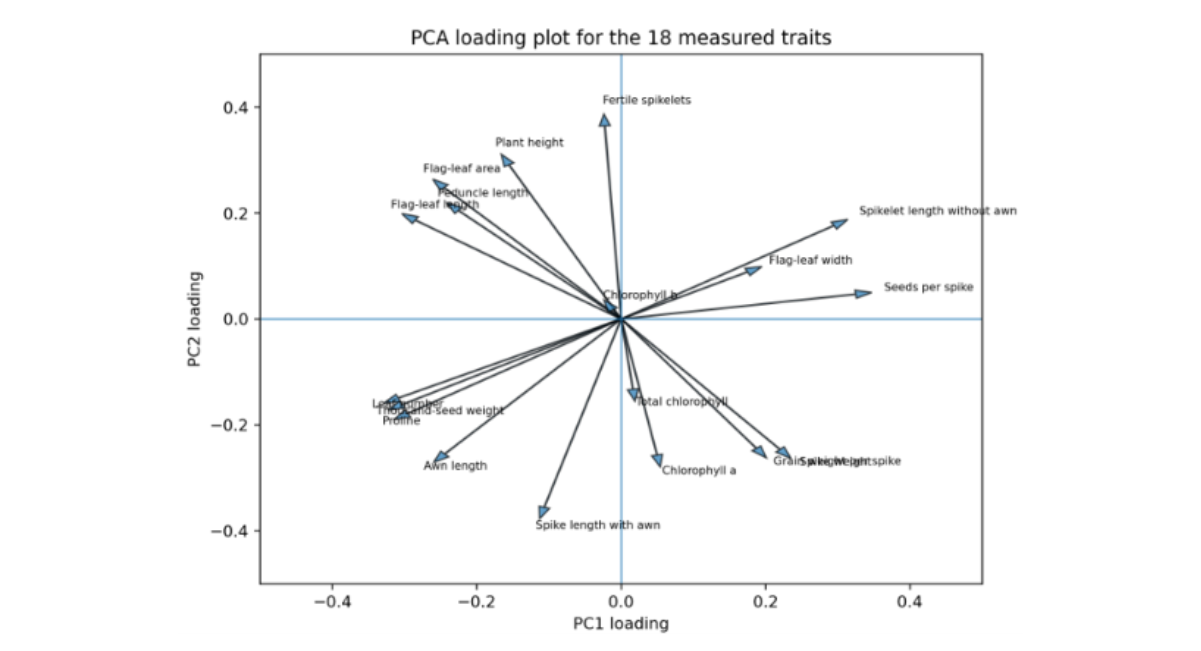
Figure 1: PCA Loading Plot of the 18 Measured Traits Based on the Three-Component Solution Reported in the Thesis
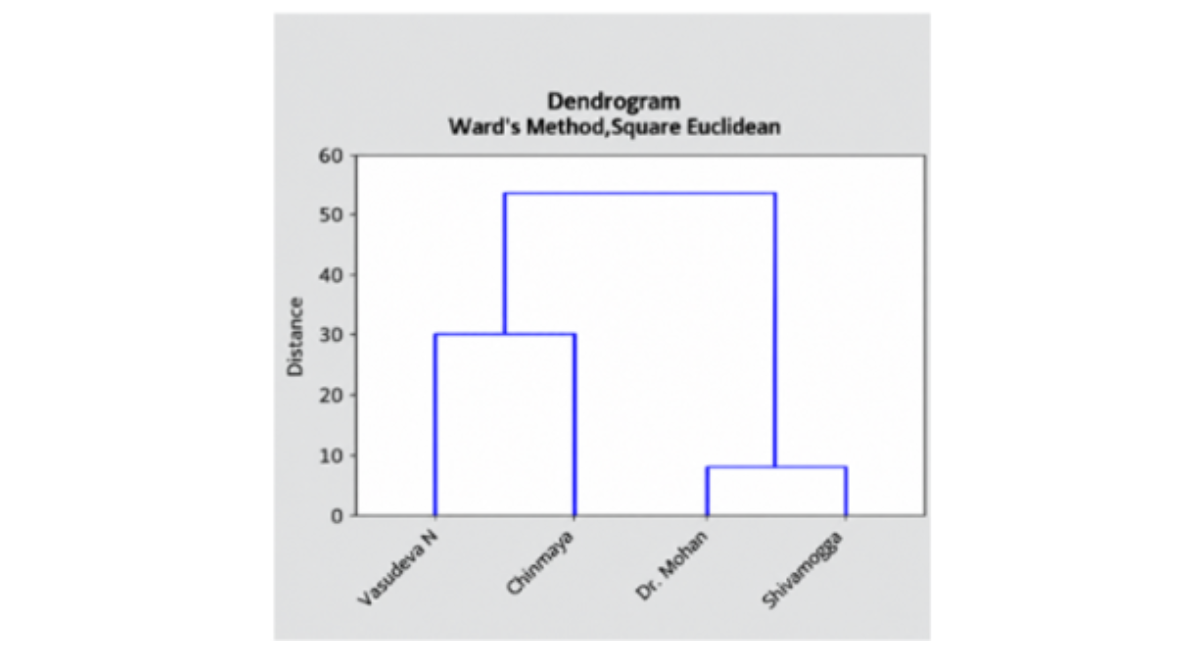
Figure 2: Ward Hierarchical Cluster Dendrogram Based on Squared Euclidean Distance Among the Four Wheat Cultivars (Reproduced from the Original Thesis Output).
DISCUSSION
The reduction in plant height, leaf dimensions, peduncle length, spike traits, and thousand-seed weight under 80 mM salinity is consistent with the established physiological effects of salt stress. Salinity reduces water availability and can disrupt ion homeostasis, leading to reduced cell expansion and impaired photosynthetic activity [3,4]. Similar variation in wheat growth and yield components under saline conditions has been reported by Grieve, Francois and El-Hendawy [8,10,11]. The present experiment further demonstrates that the magnitude of reduction was not identical among cultivars, which supports the use of genetic variation in wheat breeding for saline environments.
The strong response of proline to salinity is physiologically plausible because compatible solute accumulation is one of the responses plants use during osmotic stress. In this study, proline increased from approximately 0.57 to 0.80 µmol g−1 fresh weight in Kuhdasht, from 0.47 to 0.70 in Dehdasht, from 0.49 to 0.62 in Shabrang, and from 0.52 to 0.72 in Chamran 2 when salinity increased from 0 to 80 mM. The direction of this response is consistent with previous work showing increased proline accumulation under salt stress. However, higher proline should not automatically be interpreted as greater tolerance; it is more informative when considered together with yield and growth performance.
The changes in chlorophyll traits also reflect the sensitivity of photosynthetic processes to salinity. High salt stress can restrict chlorophyll accumulation and damage photosynthetic systems, as reported in wheat and other crops [9]. The present results showed a general decline in chlorophyll a with increasing salinity, although chlorophyll b and total chlorophyll displayed genotype- and SA-dependent patterns. Such variation suggests that SA did not simply reverse salt effects in every treatment; rather, the response depended on the interaction among genotype, salinity, and SA concentration.
The positive effects of SA on several traits are consistent with previous studies in wheat. Afzal reported alleviation of salinity stress using hormonal priming treatments that included SA, while Arfan found that exogenous SA affected growth and photosynthetic capacity in salt-stressed spring wheat [17,18]. Kaydan also reported effects of SA on growth and physiological traits in salt-stressed wheat [20]. The present study extends these observations by evaluating several SA concentrations simultaneously with four wheat cultivars and by combining conventional trait comparisons with multivariate analyses.
The physiological basis of SA-mediated improvement is likely multifaceted. SA participates in signaling and regulation of plant responses and has been associated with antioxidant metabolism, photosynthesis, ion balance, and stress-related biochemical pathways [14,15,16]. Previous work has also shown that SA can modify antioxidant responses and reduce oxidative damage under stress [21,22]. The increase in chlorophyll a and proline observed in several SA treatments in the present study is compatible with such a regulatory role, although the experiment was not designed to identify the molecular mechanism.
An important breeding result is the identification of traits associated with grain weight per spike. The positive correlations of grain weight per spike with spike weight and seeds per spike, together with their positive direct effects in path analysis, indicate that these traits may be useful for selection under the tested conditions. Flag-leaf length and thousand-seed weight also had relatively large positive direct effects. These findings agree with the general principle that indirect selection is most useful when the target trait has meaningful and repeatable associations with easily measured component traits [12].
The clustering of Kuhdasht and Chamran 2 separately from Dehdasht and Shabrang is also relevant to breeding interpretation. The cluster structure broadly followed the bread-versus-durum distinction in the four-cultivar sample. Earlier work has shown that multivariate methods can help summarize genetic or phenotypic diversity and support the identification of distinct groups for breeding [13]. However, the present study evaluated only four cultivars and did not include molecular marker data. Therefore, the observed clustering should be interpreted as phenotypic and physiological grouping rather than direct evidence of genome-wide genetic relationships.
The results also suggest that SA concentration should not be treated as a universal recommendation independent of genotype and stress intensity. Although several traits improved as SA concentration increased, other physiological responses were non-linear. For example, chlorophyll b and total chlorophyll showed different patterns across cultivar × salinity × SA combinations. This genotype-by-treatment dependency is important for future experiments because an SA concentration that is beneficial in one genotype or environment may not produce the same response elsewhere.
From a practical breeding perspective, the most useful outcome is not simply the identification of one treatment with the highest value, but the recognition of traits that consistently differentiate cultivars under stress. Spike weight, seeds per spike, flag-leaf length, and thousand-seed weight showed meaningful relationships with grain weight per spike. Combining these traits with physiological measurements such as proline and chlorophyll may provide a more comprehensive screening framework. Nevertheless, validation across multiple environments, seasons, soil types, and a larger germplasm population is necessary before these traits can be generalized as breeding criteria.
CONCLUSION
This study demonstrated substantial variation among four wheat cultivars in their responses to 80 mM salinity and foliar SA application under the tested greenhouse conditions. Salinity generally reduced several vegetative and yield-related traits, while proline increased. SA responses were genotype- and treatment-dependent. The cultivar comparisons identify material that showed relatively favorable performance under the specific stress treatment, but the experiment does not establish broad field-level salt tolerance. Grain weight per spike was positively associated with spike weight and seeds per spike, and path analysis identified several positive statistical direct effects. These traits may be useful for preliminary screening under controlled conditions; validation with larger germplasm sets, multiple environments, and field trials is required before generalizing them as breeding criteria.
DATA AVAILABILITY
The underlying data were generated in the greenhouse experiment described in the author's M.Sc. thesis. The complete experimental dataset and the original statistical tables are retained by the author and can be made available to the journal or reviewers upon reasonable request, subject to the journal's data-sharing requirements. The original SAS output containing exact software-generated P values was not preserved in the materials available for this revision; consequently, ANOVA P values shown in the revised summary table are explicitly identified as recalculated from the reported mean squares.
AUTHOR CONTRIBUTIONS
Conceptualization, experimental work, data collection, statistical analysis, interpretation of results, and manuscript preparation: Mohammad Yaqoub Sultani. The final contribution statement should be checked against the journal's authorship requirements and the actual contributions of all contributors.
ACKNOWLEDGEMENTS
The author acknowledges the Faculty of Agriculture and Natural Resources, Persian Gulf University, for providing the greenhouse and laboratory facilities used for this research, and acknowledges the academic supervision provided during the M.Sc. research.
CONFLICT OF INTEREST
The author declares that there is no conflict of interest associated with this study.
REFERENCES
- Maas EV. Salt tolerance of plants. Appl Agric Res. 1986;1(1):12-25. [Google Scholar]
- Munns R. Comparative physiology of salt and water stress. Plant Cell Environ. 2002;25(2):239-250. [Crossref] [Google Scholar] [PubMed]
- Munns R, James RA, Läuchli A. Approaches to increasing the salt tolerance of wheat and other cereals. J Exp Bot. 2006;57(5):1025-1043. [Crossref] [Google Scholar] [PubMed]
- Munns R, Tester M. Mechanisms of salinity tolerance. Annu Rev Plant Biol. 2008;59:651-681. [Crossref] [Google Scholar] [PubMed]
- Rengasamy P. World salinization with emphasis on Australia. J Exp Bot. 2006;57(5):1017-1023. [Crossref] [Google Scholar] [PubMed]
- Francois LE, Maas EV, Donovan TJ, Youngs VL. Effect of salinity on grain yield and quality, vegetative growth, and germination of semi-dwarf and durum wheat. Agron J. 1986;78(6):1053-1058. [Crossref] [Google Scholar]
- Jafari-Shabestari J, Corke H, Qualset CO. Field evaluation of tolerance to salinity stress in Iranian hexaploid wheat landrace accessions. Genet Resour Crop Evol. 1995;42(2):147-156. [Crossref] [Google Scholar]
- El-Hendawy SE, Hu Y, Yakout GM, Awad AM, Hafiz SE, Schmidhalter U. Evaluating salt tolerance of wheat genotypes using multiple parameters. Eur J Agron. 2005;22(3):243-253. [Crossref] [Google Scholar]
- Abdelkader AF, Aronsson H, Sundqvist C. High salt stress in wheat leaves causes retardation of chlorophyll accumulation due to a limited rate of protochlorophyllide formation. Physiol Plant. 2007;130(1):157-166. [Crossref] [Google Scholar]
- Grieve CM, Lesch SM, Francois LE, Maas EV. Analysis of main-spike yield components in salt-stressed wheat. Crop Sci. 1992;32(3):697-703. [Crossref] [Google Scholar]
- Francois LE, Grieve CM, Maas EV, Lesch SM. Time of salt stress affects growth and yield components of irrigated wheat. Agron J. 1994;86(1):100-107. [Crossref] [Google Scholar]
- Aycicek M, Yildirim T. Path coefficient analysis of yield and yield components in bread wheat (Triticum aestivum L.) genotypes. Pak J Bot. 2006;38(2):417-425. [Google Scholar]
- Khodadadi M, Fotokian MH, Miransari M. Genetic diversity of wheat (Triticum aestivum L.) genotypes based on cluster and principal component analyses for breeding strategies. Aust J Crop Sci. 2011;5(1):17-24. [Google Scholar]
- Raskin I. Role of salicylic acid in plants. Annu Rev Plant Biol. 1992;43(1):439-463. [Crossref] [Google Scholar]
- Popova L, Pancheva T, Uzunova A. Salicylic acid: Properties, biosynthesis and physiological role. Bulg J Plant Physiol. 1997;23(1-2):85-93. [Google Scholar]
- Joseph B, Jini D, Sujatha S. Insight into the role of exogenous salicylic acid on plants grown under salt environment. Asian J Crop Sci. 2010;2(4):226-235. [Crossref] [Google Scholar]
- Afzal I, Basra SMA, Farooq M, Nawaz A. Alleviation of salinity stress in spring wheat by hormonal priming with ABA, salicylic acid and ascorbic acid. Int J Agric Biol. 2006;8(1):23-28. [Google Scholar]
- Arfan M, Athar HR, Ashraf M. Does exogenous application of salicylic acid through the rooting medium modulate growth and photosynthetic capacity in two differently adapted spring wheat cultivars under salt stress? J Plant Physiol. 2007;164(6):685-694. [Crossref] [Google Scholar] [PubMed]
- Arfan M. Exogenous application of salicylic acid through rooting medium modulates ion accumulation and antioxidant activity in spring wheat under salt stress. Int J Agric Biol. 2009;11(4):437-442. [Google Scholar]
- Kaydan D, Yagmur M, Okut N. Effects of salicylic acid on the growth and some physiological characters in salt stressed wheat (Triticum aestivum L.). Tarim Bilimleri Dergisi. 2007;13(2):114-119. [Google Scholar]
- Borsani O, Valpuesta V, Botella MA. Evidence for a role of salicylic acid in the oxidative damage generated by NaCl and osmotic stress in Arabidopsis seedlings. Plant Physiol. 2001;126(3):1024-1030. [Crossref] [Google Scholar] [PubMed]
- Dat JF, Lopez-Delgado H, Foyer CH, Scott IM. Effects of salicylic acid on oxidative stress and thermotolerance in tobacco. J Plant Physiol. 2000;156(5-6):659-665. [Crossref] [Google Scholar]

Article Processing Timeline
| Stage 1 |
Initial Quality & Plagiarism Check The manuscript is reviewed for journal scope, basic submission requirements, ethical compliance, and similarity/plagiarism concerns. |
| Stage 2 |
Editorial Assessment & Peer Review Manuscripts that pass the initial screening undergo editorial assessment and independent peer review in accordance with the journal's peer-review policy. |
| Stage 3 |
Revision & Editorial Decision Authors may be requested to revise their manuscript based on reviewer and editor comments. A final editorial decision is made after the required review and revision stages are completed. |
| Stage 4 |
Production & Publication Accepted manuscripts proceed to production, author proofing, final quality checks, and online publication. |
EDITORIAL & PUBLICATION INFORMATION
| English | Publication Language |
| Single-Blind | Peer-Review Model |
| 17% | Acceptance Rate |
| <18% | Similarity Screening Guideline |
| Open Access | Access Model |
All manuscripts undergo editorial assessment and originality screening as part of the journal's evaluation process. The acceptance rate shown is based on journal-level editorial data and may change over time. Similarity reports are assessed editorially and are not interpreted solely on the basis of a numerical similarity score.
Why Publish with us?
Ethics & Policies
Editorial & Management
Useful Links
Journal Highlights
Open Access Journals
Journal Flyer