Journal of Climate Change and Pollution
ISSN:
3108-2025 (Online)
DOI Prefix (Crossref): 10.67238
ABSTRACT
This Study aims to assess climate change's impact on crop production in Wera Woreda Halaba Zone Southern Ethiopia. Primary data is obtained from households of sample kebeles and secondary data obtained from National Meteorological Agency, Zone and Woreda Agricultural office. Climate data from 1995-2021obtained from NMA and production per hectare of main cereal crops in the study area obtained from Woreda Agricultural office. Mixed research approach employed in data collection to data analysis. Questionnaire, key informant interview, FGD and observation were used as data collection methods. The study area is purposively selected and the sample sizes were determined by using Kothari sample size determination formula. 167 household heads were selected from four Kebeles using systematic random sampling. Both quantitative and qualitative methods were employed to analysis the data. Frequency, percentage and mean were used. Correlation was employed for continuous data at 5% of significance level. The qualitative data was discussed in narration form to substantiate the study. The result of the analysis shows that the average maximum and minimum temperature increased at the rate of 0.2647 0c and 0.3266 0cwhich is higher than the national average 0.18 0c. On the other hand, rainfall decreased by 16.48 mm per year. The precipitation concentration index (PCI) value of 11 shows high seasonal concentration of rainfall in certain months per decades. The long term mean monthly rainfall shows moderate coefficient of variation with CV value of 24.37%. the finding of the study also indicate that decrease in the maize yield is 0.55 Q/ha/ year and 5.5Q/ha/per decade, decrease in the Teff yield is 0.68 Q/ha/per year and 6.8 Q/ha/ decade, decrease the Boloke at the rate of 0.64 Q/ha/year and 6.4Q/ha/decade, decrease Dagussa yield at the rate of 0.61 Q/ha/year and 6.1Q/ha/ decade and pepper at the rate of 0.92 Q/ha/year and 9.2Q/ha/decade respectively. In the study area women and young girls and people with disabilities were most vulnerable group for climate change. Women and young girls walk more than 2hrs for search of water during continuous dry seasons. In response, farmers had adopted different adaptation strategies like; crop diversification; adjusting crop planting dates, selling assets, being responses to involved in off- farm activities, and practicing mixed farming, which are the most adaptive response to climate change in the study area. The local farmers should build water harvesting, adaptive livestock breeding, fodder production on small land, selection and management system to minimize these challenges.
Keywords: Crop Production; Climate Change; Adaptation; Rain Fall and Temperature
INTRODUCTION
Background of the Study
Climate change is one of the biggest challenges of the world faces today posing a threat to many around the globe. Studies indicate that climate change will affect agriculture in many regions of the world, limiting food production and threatening food security [1]. Global Climate change has affected the planet. Warming of the climate system is unequivocal, as is now evident from observations of increases in global average air and ocean temperatures, wide spread melting of snow, ice and rising global average water level.
Observational evidence from all continents and most oceans shows that a lot of natural systems are being littered with climate changes, particularly temperature increases [2]. Most of the observed increase in global average temperatures since the mid-20th century is extremely likely thanks to the observed increase in anthropogenic GHG concentrations. This increasing level of emissions of greenhouse gases has caused an increase within the amount of warmth from the sun trapped within the earth’s atmosphere, heat that might normally be radiated into space. This has led to the atmospheric phenomenon and temperature change [3]. Variability of climatic elements, especially rainfall and temperature, may affect agricultural production as they influence the production elements like soil moisture and soil fertility, length of growing season and increased probability of extreme climatic condition; although with special variations. Climate change is already affecting agriculture and its effects are unequally distributed across the world [4].
Africa is commonly identified as the region highly vulnerable to climatic variabilities of the tropical rain i.e., uncertainties of commencement, termination, continuity and intensities, mainly because it is the continent which has its major areal spread within the tropics. And as a matter of fact, it is the tropical land which is full of uncertainties of climatic attributes. In addition to these the social, economic, and political constraints that determine the capacity of human systems to cope with climate change and variability, and the existing burden of climate-related hazards, including high prevalence of food insecurity.
Africa is also sensitive to climatic hazards, as its people are mainly dependent on natural resources for their livelihoods such as agriculture, pastoralist and fishing [5]. Environmental stressors, thus, place a large proportion of the population at risk of adverse outcomes [6]. Agriculture is the most important sector in sub-Saharan Africa, but it is predicted to be negatively impacted by climate change. Climate Change and Food Security in Sub-Saharan Africa; it is clear that climate change will bring about substantial welfare losses especially for smallholders whose main source of livelihood derives from agriculture [7].
Sub-Saharan African countries are among the most vulnerable to climate change having warm climate and lower socio-economic status that limits their capacity to adapt to the rapidly growing climate change effects [8]. Findings from previous studies indicated that agriculture is largely negatively affected in this region due to climate change; for example, mean yield changes of up to −22% have been found in some crops [8].
Ethiopia is one of African countries, which become prone to climate change. Ethiopia is especially vulnerable to climate change because of its geographical coverage and complexity, low income and reliance on climate sensitive economic sectors particularly agriculture and pastoralist [9]. The IPCC’s fifth report indicates that future climate change will lead to an increase in climate inconsistency and in the frequency and intensity frequency and intensity of extreme events in Africa including Ethiopia [10]. Many people's livelihoods in the country are critically related to climate condition. The impact of climate change in Ethiopia is highly manifested because of agriculture is predicted to play a key role in only rain-fed, is highly affected with late onset and early offset of rainfall during the main rainy season and in most cases total failure of the Belg season. This may result in drought and famine. According to IMF the agricultural sector remains a key source of growth in Ethiopia but continues to face major challenges [9].
Rural livelihoods remain extremely vulnerable to climatic shocks as food production is mainly dependent of natural rainfall and irrigation supports only negligible portion of the country total cultivated land. Irrigation agriculture accounts for only 5% of the country total cultivated land [11]. Thus, the amount and temporal variation of rainfall and other climatic factors during the growing season are critical to crop yield and can induce food shortage and famine. This shows that climate change and variability can have greater negative impacts on poor farm households due to high vulnerability leading to food insecurity. In turn, food insecurity has become a very important development challenge in Ethiopia [12]. IPCC indicates that rising temperatures, drought; damage of crops; floods, desertification and weather extremes will severely affect agriculture, especially in the developing countries like Ethiopia [13].
The Statement of the problem
Agricultures is a food producing economic activity that defines the current and future food security of the global economies whereas “productivity measures the amount produced by a target group (country, industry, sector, farm or almost any target group) given a set of resources and inputs” such as land and labor [14]. Despite all the scientific and technological developments in enhancing the harvests, the success of agricultural production has remained highly reliant on climate.
The impacts of climate change on agriculture in Ethiopia deserve scholarly attention for multiple reasons. First, Ethiopia has been an icon of the liberation of Africa from the colonial occupation of the continent, a founding member of the UN and the African base for numerous international bodies. Given their pioneering roles in Africa and East Africa in particular, it is vital for the emerging economies to learn from their experience. Second, Africa's second most populous country, Ethiopia homes about 115 million inhabitants and thrives as one of the fastest-growing countries in the region, averaging 9.8% a year [15]. On the contrary, Ethiopia features as a common country in all globally recognized lists related to the severity of climatic vulnerability and its impacts on agricultural production and food security. Third, as an engine of the Ethiopian economy, agriculture employs 80–85% of the inhabitants, and contributes 80% to rural incomes, 40% to GDP and 90% to export earnings.
However, while shortages in water and recurrent droughts impede the production of agricultural products, the major challenges associated with food security in the country are posed by the degradation and vulnerability of environment. Fourth, Ethiopia ranks the second for sorghum, the third for maize and wheat, and the fourth for coarse grains in Africa [16]. Despite all these achievements including remarkable success in counteracting chronic food insecurity, malnutrition and stunting since the Millennium; the country still loses at least 16.5% of its yearly GDP to the long-term impacts of climate extremes, fueled by persistent regional conflicts, the recent pandemic, and so on [14]. It is evident that the severity of the climatic conditions in Ethiopia, such as floods, famines, intensifying temperatures, and unpredictable rainfall, has been documented in various studies over the last two decades.
However, most studies have highlighted a mixed picture of the climate impacts on agricultural production, and many others have offered inconclusive outline of the reasons behind the persistently widening inequalities in crop production. For instance, the study done by Fissihaye D the availability of water has been identified as the main factor influencing agricultural production. A similar study done by Mohammed claims that agricultural production and productivity were determined by climate factors like temperature, carbon dioxide emissions (CO2), the area under crop, and the labor force [17]. However, most of the studies were not focused on the impacts of climate change on specifically selected cereal crops which are mainly produced in a certain agro ecological region. In light of the above background, the researcher investigates the interconnectedness among changes in climate and agriculture using five major crops (i.e. pepper, Boloke, Degussa, maize, and sorghum) in Wera Woreda Halaba Zone, Central Ethiopian regional state.
Objectives of the Study
General Objective
The main objective of the study is to assess impacts of climate changes impacts on crop production in Wera Woreda, Halaba Zone, and Central, Ethiopia.
Specific Objectives
More specifically the study is aimed to:
- Assess the impact of climate change on Maize, Dagusa, pepper, Boloke and Sorghum
- Identify more vulnerable social groups to climate variability in the study area.
- Investigate the perception and adaptation of small holder farmers towards climate change
Research Questions
Based on the formulated specific objectives the study will answer the following questions
- What are the impacts of climate change on crop production in the study area?
- Who are more vulnerable social groups to impact of climate change?
- What is the perception and adaptation of small holder farmers towards climate change?
Significance of the Study
The study provides important information about patterns and impacts of climate change on crop production and provides options for the impact induced to vulnerability by climate variability. It contributes a better understanding of predicted impacts of climate variability on crop production. It also serves as base line information to facilitate and exchange of ideas among local community, researchers, policy makers, development actors etc. at different institutional level by creating awareness on how to keep up local knowledge and use it as input for further studies on the area under threat of climatic variability.
Scope of the Study
The study focused on assessing the impact of climatic variability on crop production on selected four sample kebeles of Wera Woreda in Halaba Zone, Central Ethiopia. These four sample kebeles are selected from kola, Woina Dega and Dega based on agro-ecological zones of the Woreda. And, Climate variability can affect all elements of livelihood resources (natural capital, human capital, physical capital, financial capital and social capital and crop production etc.) The study area is selected purposely based on the researcher’s previous and current knowledge. This study covers only four Kebeles namely Lay Arsho, Tach Arsho, Merab Gortancho and Mesrak Gortancho out of the 25 kebeles of the Woreda. Even if impact of climate change on crop production becomes a threat of many rural kebeles of the administration, due to time and resource constraints only four Kebeles would be selected.
Limitations of the Study
Difficulties may occur to get organized, well-developed, and evident data on the issues. Moreover, officials may give lengthy appointment for interview, absence of willingness of some officials and process owners to provide relevant and adequate data necessary to carry out the study, time and budget constraints and some household respondents did not give back appropriate responses to some questions and questionnaires. Furthermore, the study may limit in sample size and area coverage. Despite its limited scope, however, the findings of this study would provide useful information regarding the impact of climate change on crop production.
Validity and Reliability
The critical point is the study followed sound research methods; moreover, the triangulation of the methodology, that is, use of both quantitative and qualitative approaches to the study is useful in improving the validity, analytic power and relevance of the findings. Focus group discussions actually cross-check or triangulate themselves; the mixture of informants also gave balanced perspectives: professionals, the government officials and the targeted communities; so, by combining multiple respondents, methods and sources the investigator aimed to overcome the intrinsic bias that comes with a single source and single respondent research.
Organization of the thesis proposal
The study is organized in five chapters. The first chapter briefly describes the study's background, statement of the problem, objectives, significance of the study, and scope of the study. Chapter two present the relevant literature related to climate change's impact on crop production, temperature and rain fall. The third chapter covers research methodology. Chapter four indicates and discusses the results of the study. Finally, conclusions and recommendations are presented in sample kebeles were selected randomly. Some challenges had occurred while conducting this study. One of the main problems faced during the study was, some farmers were reluctant to give correct information on their socio economic and demographic situation, absence of the HHHs at their home during the survey and shortage of secondary data.
Definitions of Key Concepts
Agricultural productivity: - is the agricultural output per a given quantity of inputs or the reduction in inputs per a given level of outputs. In other words, it measures the efficiency with which inputs are used to produce agricultural output [18].
Impacts of climate change: - refers the visible ways that climate change is affecting the earth. For example, many places have experienced changes in rainfall, resulting in more floods, droughts, or intense rain, as well as more frequent and severe heat waves [19].
Climate variability: refers to the climatic parameter of region varying from its long-term mean. Every year in specific time period, the climate of location is different.
Crop: - is a plant or plant product that can be grown and harvested for profit or subsistence. By use, crops fall into six categories: food crops, feed crops, fiber crops, oil crops, ornamental crops, and industrial crops [19].
Crop failure: - is defined as the complete or near complete loss of marketable crop on farm. Unfavorable weather conditions and pest infestation can both lead to the damaging or destroying of fruits and vegetables, and lowering crop yields.
LITERATURE REVIEW
Impact of Climate Change on Crop Production in Ethiopia
At present, the aggregate impacts of climate change on global-scale agricultural productivity cannot be reliably quantified. The global climate change and the associated weather extremes continued posing considerable challenge both on developed and developing countries. Impact of climate induced food shortages and chronic diseases affected billions of people in developing countries. Many African scholars Deressa, Gbetibouo, has assessed climate change and variability to understand the level of smallholder farmers in the changes in temperature and rainfall [20]. Despite the low levels of education of the majority of smallholder farmers, they perceive climate change based on their local knowledge and farming experience.
Moreover, socio-economic factors such as age of the household, farm income have been mentioned to have influence on perception of climate change (Deressa et al, 2008). We can find out additional factors that influence farmers‟ perception on climate change but only little studies were revisited just to point out that it is possible for farmers to understanding changes in temperature and rainfall variability. According to reports of the IPCC, the projected yield reduction because of climate change in some poor countries could be as much as 50% by 2020. The rainfall and temperature variability are significant and negative impact on outputs of crop agriculture in Ethiopia. Climate phenomena specifically temperature and rainfall variability is significantly challenging small-scale farmers who depend on rain-fed agriculture in developing countries [23].
Impact of Climate Change on livestock production
Climate change and variability are already challenging Ethiopia by affecting food security, crop, cattle, water and energy supply, health, poverty reduction and sustainable development efforts [22]. Furthermore, extreme weather events, such as droughts, floods, or landslides, may cause death to domestic animals. Livestock suffering and death often means that farmer’s wealth is decreased and they lost much of their resources [23]. The adverse impact of climate change is not only these particularly climate change/variability also has significant impact on rain fed agriculture. Under climate change, much agricultural land would be lost, with shorter growing seasons and lower yields. National communications report that climate change will cause a general decline in subsistence crops, such as wheat and maize [18]. Ethiopia is one of the countries that are most vulnerable to the impact of climate variability and change on agriculture [24].
It can also impair on both livestock and crop production by altering pest incidence and plant- pest interaction [25]. However, several factors can determine the direction and magnitude of climate change impact on farms. First, as climate change manifests it-self in different ways across locations, the impact may likewise vary de-pending on the specific local climatic changes. Another important aspect is that different crops and livestock do not respond to climate change in the same way owing to variation in their sensitivity to temperature, rainfall and CO2 changes.
Impacts of Climate Change on Food Security
Climate change would be act as a multiplier of existing threats to food security many Ethiopia region. It would make natural disasters more frequent and intense, land and water more scarcity and difficult to access, and increases in productivity even harder to achieve. The implication for people who are poor and already food insecure and malnourished are immense. Particularly in the least developed countries and Sub-Saharan African countries, it is the livelihoods and lives of the poorest and most vulnerable, including women, children, older, disable and marginal communities, which are also at greatest risk to suffer from to the potential impacts of climate change. This is due to their high exposure to natural hazards, their direct dependence on climate sensitive resources such as plants, trees, animals, water and land, and their limited capacity to adapt to and cope with climate change impacts.
Impacts of Climate Change on Crop Production on the Study Area
Climate Change and Impacts of crop production in Halaba zone are highly interlinked being climate variability may be a primary controlling factor of agricultural productivity. It is expected to influence crop production, livestock rearing and water cycle negatively. In addition to also affects food security along with overpopulation, poor land and poor water management causing hunger and malnutrition. A major proportion of individuals within the crop dependent highlands are chronically food insecure. Moreover, temperature change places more pressure on the food security of millions by reducing crop yields, increasing land degradation, and lowering water availability.
Climate change affects crop production by directly impacting biophysical factors such as plant and animal growth and the physical infrastructure associated with food processing and distribution. In this section, we would be exploring on how climate change would affect crop production in the study area directly. Recent research has suggested that some impacts of climate change are occurring more rapidly than previously anticipated.
Risks of Climate change and Variability on Agriculture
Agricultural production variability is a main risk that is manifested in loss of crop yield and reduction of livestock, deterioration of product quality, and dramatic change of market price in crop and livestock products. The major sources of production risks in agriculture are variation in complex weather conditions such as erratic and variable rainfall, rise in temperature, change in humidity and precipitation patterns; pests and disease occurrence; application of outdated technology and practices; inefficiency of farm machinery and low quality of agricultural inputs. At the same time, marketing, financial, human resource risk caused by improper operation and application of production systems, and legal risks caused by inappropriate rule and policy are important sources that need focuses in managing and mitigating the consequences in agricultural production [26].
Ethiopia is frequently reported as the most vulnerable country in climate change and variability risks imposed on its rain-fed and subsistence agriculture [26]. Sub- Saharan African countries including Ethiopia are experienced by climate change and variability mainly by the rise in mean temperature and erratic rainfall. The climate change and variability risks have resulted in the occurrence of frequent drought, floods, pests and disease, and other risk extremes. On the other hand, the heavy dependency of the economy on subsistence and undeveloped agriculture; low level of transfer and adoption of improved agricultural technologies and practices have exposed the farming community to a high level of vulnerability and risk [26]. African countries including Ethiopia are more exposed to the risks of climate change and variability not only to their exposure to climate change but also due to the lack of their capacity to respond or adapt to the impacts of climate change [27].
Effects of increase in temperature
The global mean temperature is gradually increasing and agriculture continues to be the main responsible for emitting a large proportion of GHGs into the atmosphere [14]. According to the IPCC recent report, average global temperature increased between 1.8 and 4.00C from 1980 to 1999 and is expected to increase between 1.1 and 6.40C during the 21st century [3]. Other scholars substantiated that minimum temperature increased about two times (0.2040C per decade) as fast as maximum temperature (0.1410C per decade). Global warming to some extent could reduce markedly crop productivity in equatorial and tropical countries, but increase crop productivity in temperate countries where ambient temperature is lower than temperature existing in the regions surrounding by equatorial and tropical climate.
Farmers in rural areas where people depend on agriculture face substantial risk of crop failure and famine when drought hits.
Effects of changes in rainfall patterns
Rainfall patterns can increase crop yield or decrease depending on its intensity. About 20% of the world’s populations live in river basins that are likely to be affected by excess of precipitation. An increase in rainfall intensity could increase the risk of floods in wetlands occupied mostly by farming [3]. It is ascertained that a heavy and uncertain rainfall that can be translated into floods is a limiting factor for crop production in developing countries. This pushed farmers to adapt through switching crops, crop diversification and planting trees.
The regions surrounded by the tropics and hemispheres, where SSA countries located, experience decreased rainfall, of about 20%, due to a prolonged dry spell. This could result in loss of arable land that can be caused by decreased in soil moisture, increased aridity, increased salinity and groundwater depletion.
Rainfall Characteristics and Variability in Ethiopia
Onset of Rainfall
An onset of rainfall is the date which rainfall begins and accumulated for more than two days with at least 20mm when no dry spell lengths above 9 days occurred within the consecutive 30 days. Different researchers made the determination of rainfall onset date without evaporation data input by setting different criteria that can affect the rainfall onset and end Abiyot, Kassie reported that onset of a season as the date when the rainfall accumulated over 2 days is at least 20 mm and when no dry spell (exceeding 10 days) occurs within the following 30 days [24]. An onset of rainfall may vary in different parts of the country. According to Abiyot report that on average the rainy season started in DOY 84,117 and 92 at Gatos, Wolkite and Hosanna stations respectively in the Southern region of Ethiopia. According to Taye et al. (2013), reported that on average Kiremt rain start on 151th, 144th and 132th DOY) at Motta, Debra Marko’s and Dangla stations in Amahara region respectively.
End date of Rainy Season
The end date of rainy season is obtained when annual crops which grow during the rainy season can utilize stored moisture in the range of 75-125 mm by the time of maturity Mersha as cited by Fitsume, so that an average 100mm of soil moisture capacity might be utilized, despite the stoppage of rainy season [28]. Different researchers made determination of rainfall end date without evaporation data input by setting different criteria that can affect the rainfall onset and end. A cessation date of the main rainy season (Kiremt) is when the available soil moisture content goes down or falls to 10mm/m of the available soil water.
According to Kassiee, an end of rainy season (for Kiremt) as the date when the available soil water content drops to 10 mm/m of the available water after September 11. Based on this, cessation date was considered any date when water balance assumed to reach zero on 308 DOY or after November 3rd at Fonko and 304 DOY (October 30th) at Hosanna station respectively (for Kiremt) on average in the study area [24]. According to Abiyoetet, on average Kiremt rainy season ceased in DOY 146, 290 and 286 at Gatos, Wolkite and Hosanna stations respectively in the Southern region of Ethiopia.
Climate variability
The Earth's climate has changed throughout history. Just in the last 650,000 years there have been seven cycles of glacial advance and retreat, with the abrupt end of the last ice age about 7,000 years ago marking the beginning of the modern climate era-and of human civilization. Most of these changes are attributed to very small changes in the Earth’s orbit changing the amount of solar energy the Earth receives. The current warming trend is of particular significance because most of it is very likely human induced and proceeding at an unprecedented rate in the past 1,300 years. The climate of a place or region has changed over an extended period (typically decades or longer). There is a statistically significant change in measurements of either the mean state or variability of the climate for that place or region. Changes in climate may be due to natural processes or persistent anthropogenic factors that caused in atmosphere or in land use systems.
One of the most significant effects of climate change is the impact on the global food system as it changes rainfall patterns, reduces agricultural yields and affects food security. Developing countries across Asia, Africa and Latin America are forecast to see reductions in agricultural productivity of between 9 and 21 per cent by the 2080s due to climate change. In some places, the effects would be felt much sooner than that by 2020, rising temperatures and variable precipitation are likely to reduce the production of staple foods by up to 50 percent in some African countries, leading to declining yields and the abilities of families to feed themselves. Furthermore, the Intergovernmental Panel on Climate Change’s (IPCC) highlighted that agricultural production and access to food in many African countries is projected to be severely compromised by 2020. This would further adversely affect food systems and exacerbate malnutrition. The IPCC went as far to state that “malnutrition linked to extreme-climatic events may be one of the most important consequences of climate change. “Climate change is also increasing the frequency and severity of natural disasters. We know that children are hit hardest during natural disasters such as floods and droughts.
These disasters also damage food production, killing livestock, destroying crops and forcing people to abandon their land, less food and higher food prices increase the risk of children going hungry and becoming malnourished. The effects of climate change on livelihoods can be sudden, such as droughts and floods, or slower but cumulative, such as changing long-term rainfall patterns. This cumulative effect is particularly notable in the case of food security and nutrition. Figures quoted by the Stern Review suggest that, with temperature increases of 2°C, up to 200 million people would be at risk of hunger worldwide, rising to as many as 550 million with warming of 3°C in the next 50 years. By the end of this century, climate change is likely to double the frequency of extreme droughts and increase their average duration six-fold. The projected levels of greenhouse gas emissions and lack of action to reduce emissions through international action, indicate that these impacts would intensify to have a more profound and severe impact on the world’s food system than the current predicted scenarios. Governments therefore need urgent action to ensure that children are able to withstand the impact that climate change is having on the food system so that it does not negatively impact on their chance at future. For climate variables such as rainfall, soil moisture, temperature and radiation, crops have thresholds beyond which growth and yield are compromised. For example, cereals and fruit tree yields can be damaged by a few days of temperatures above or below a certain threshold.
Factors like deep rooted poverty, illiteracy and lack of skills, weak institutions, limited infrastructure, lack of technology and information, low levels of primary education and health care, poor access to resources, low management capabilities and armed conflicts have contributed and would have continue in negatively effecting the developing countries‟ ability to cope with climate change. The overexploitation of land resources including forests increases in population, desertification and land degradation pose additional threats. Africa is already a continent under pressure from climate change stresses and is highly vulnerable to the impacts of climate change. Many areas in Africa are recognized as having climates that are among the most variable in the world on seasonal and decadal time scales.
In the European heat wave of 2003, when temperatures were 6ºC above long-term means, crop yields dropped significantly, such as by 36 percent for maize in Italy, and by 25 percent for fruit and 30 percent for forage in France.
Climate Variability and Agriculture in Ethiopia
The most influential climatic variables affecting yields on a global scale are temperature and precipitation, as some studies indicating that they act nonlinearly. Year-to-year climate variability affects the growth, development and yield of crops. Interactions between temperature and precipitation might lead to reduced sensitivity to heat if enough water is available and thus higher relative importance of heat. An increase in maximum temperatures (as climate or weather) can lead to severe yield reductions and reproductive failure in many crops. Higher temperatures and CO2 levels will likely change the wheat growth patterns and duration by shortening the growth cycle and altering the phonological stages [5]. Increased CO2 levels reduce stomata conductance and transpiration rates. However, higher early spring temperatures and fewer frost days may improve the early growth and vigor of the plants. With higher CO2 levels, plants may transpire less. A combination of increased temperature with increased atmospheric levels of CO2 would modify crop water use patterns, affecting the soil water status and the moisture uptake by the crops [5]. In agriculture, variability or yield reduction is mostly influenced by rainfall and temperature variability. Climate variability accounts for up to 60% of yield variability in major parts of the world and is thus an important factor in food security. Low yield variability is desirable, because it leads to more stable food production and farmer income.
Causes and consequences of Climate Change in Ethiopia
Change in the intensity of sunlight reaching the earth cause cycles of warming and cooling that have been a regular feature of the Earth's climatic history. But, the main and direct cause of greenhouse gas (GHG) emissions is carbon dioxide (70%), primarily from burning of fossil fuel (petroleum) imported other countries, while the other sources of GHG are methane and nitrous oxide caused by deforestation and agricultural activities, particularly the use of pesticides. Ethiopia’s share to global GHG emission is very minimal. Mo FED reports indicate that, these two sectors are the major emitters in Ethiopia, accounting for 85% and 15% of the total gas emission respectively. This reflects the fact that livestock farming goes together with high methane emissions. The dominant position of livestock farming in Ethiopia’s economy also influences the relative contribution of GHG to the total emissions. These are dominated by methane emissions, which account for 80% of the warming potential. Ethiopia’s GHG emissions are closely linked to basic needs of the population; food production (through livestock farming) and heating. Therefore, the future GHG emissions would likely increase with the projected increase in population. The increasing average of temperature; deforestation is combustion of fossil fuels mainly in the transportation sector was responsible for 88 % of the total CO2 (BM Hashim 2016). Currently consequence of climate change is aggravated or devastation of natural and manmade phenomena; in its influence of leads to crop failure; decrease of yield; damage of plant and animal products; food shortage; drought; flood; famine and migration.
Anthropogenic Factor
Human lives are directly linked to climate change because we depend on fossil fuels for our energy needs. There has been a continuous rise in global temperature in the last 130 years, which has huge air pollution, resulting from incomplete burning of fuels such as coal, oil, petrol and wood. It is evident that carbon dioxide (CO2) and Methane are being dumped into the atmosphere at an alarming rate as a result of the advent of the industrial revolution. Apart from human activities, the gaseous pollutants (include; Sulphur dioxide, nitrogen oxides, carbon dioxide, and carbon monoxide) emitted into the air can also be by natural occurrences such as biological decay, forest fires or volcanic eruptions. The emission of greenhouse gases has increased dramatically mostly from burning fossil fuels for energy, agriculture, industrial process, and transportation.
Deforestation
Deforestation is the act of cutting down or burning the trees in an area. It is the loss/removal of tree cover, as a result of forests being cleared for other land uses such as farming or ranching, which affect carbon fluxes in the soil, vegetation, and atmosphere. Deforestation and forest degradation mainly affected by fuel wood collection/charcoal, farmland expansion, land fires and construction wood harvesting were caused due to population growth, insecure land tenure and poor law enforcement Removal of forest covers alters soil, plant composition, global and regional climate patterns [29]. Deforestation happens all over the world and the vast majority of deforestation occurs in rainforests, mostly concentrated in the tropics. It results soil degradation, carbon emission, plant decomposition left on the forest floor, albedo effect, and intensification of hydro-Meteorological hazards, carbon stores held in soil to be released. Deforestation on the other hand increases temperature, rates of carbon dioxide emission, soil degradation and surface runoff resulting in flash floods.
Agricultural Inputs
Rising demand for agricultural products such as food, feed and bio-energy is a primary driver of forest clearance globally. The expansion of agriculture into tropical forests releases substantial amounts of carbon to the atmosphere. Agriculture is responsible for 10–12% of the total global increase of anthropogenic emissions and greenhouse gas (GHG) emissions, Carbon emissions and sequestration from production of fertilizers and deforestation. Industrial agriculture contributes significantly to global warming, representing a large majority of total agriculture-related GHG emissions. Alternatively, ecologically based methods for agricultural production, predominantly used on small-scale farms, are far less energy-consumptive and release fewer GHGs than industrial agricultural production.
CO2 is emitted from agricultural systems through mechanisms, including plant respiration, soil efflux, using fossil fuels in machinery and producing agricultural inputs (e.g. Fertilizers and pesticides). Soil respiration rates are governed by factors similar to other soil functions: temperature, water content, microbial density, diversity and structure, and the biochemical composition of plant material decomposing in the soils. Between 2000 and 2010, around 13 million hectares of forest were converted to other uses or naturally lost, compared to 16 million hectares per year during the earlier decade.
Adaptation to Climate Change in Africa
Climate change is a big challenge of world that the current generation is facing. Africa is more vulnerable to climate change impacts than other continents. Long- term effective adaptation measures are required to tackle inevitable impacts caused by extreme weather events in Africa. However, agriculture is more sensitive sector to climate change and smallholder farmers are more vulnerable, the need for adapting to climate change impacts is too higher while the adaptive capacity is still limited in terms of human capacity and financial resources almost in all developing countries. The recent UNEP report revealed that some African states have undertaken and adopted various national, regional and international initiatives and programmers to reduce the vulnerability of climate change towards vulnerable community and systems.
Like in other developing countries, extreme weather events undermine agricultural productivity in SSA countries. The huge impacts are due to the low use of modern agricultural technologies and poor infrastructure that enhance adaptation to climatic change and increase productivity among smallholder farmers. As there no other option of making a living than agriculture, SSA countries has prioritized adaptation to climate change to sustain the living of smallholder farmers who depend on agriculture for their livelihoods. World Bank, asserted that the impact of climate change on human, environmental and economic systems is a cost that can to some extent be avoided by applying more effective adaptation strategies; however, the cost associated with adaptation measures to be undertaken is too high compared to the human and country’s capacity. recent study by Sherman estimated global adaptation costs for climate change impacts to be between USD 4 billion to USD 109 billion annually, of which USD 18 billion is for Sub-Saharan Africa countries. The impacts of climate change in Africa are increasing overtime due to the emissions of Western developed countries. This is a burden for African countries in adapting to the arising impacts of climate change as most countries still rely on foreign aid and assistance. In order to reduce vulnerability to climate change satisfactorily, African countries need at least US$ 20-30 billion per annum over the next 10 to 20 years. Therefore, international organizations need financial and technical assistance to support African countries to cope with the huge impacts of climate change.
Types of Climate Change Adaptation measures
Climate change impacts can be adapted at community or institutional levels depending on the severity of extreme weather event. In this regard, adaptation measures are divided into two types namely autonomous and planned adaptation measures. Autonomous adaptation refers to the response taken by vulnerable individuals and households to cope with climate change hazards and impacts without any external technical or financial assistance [30]. Whereas the planned adaptation measures refer to the strategies and decisions made by government institutions to lessen the impacts of climate change on vulnerable people.
Study by Ngigi indicated that the vulnerabilities of climate change occur at various scales and successful adaptation depend on actions taken at different levels either at national or farm levels. The agricultural sector is particularly vulnerable to climatic variability and extreme weather events. Adaptation in this sector is most likely a reflection of these extreme weather events rather than the cumulative effects of climate change [31].
This study outlined some examples of national climate change adaptation measures used in agricultural sector:
Technological innovations: improved crop varieties, early warning systems, land and water management, integrated pest management, etc.
Government subsidies: agricultural subsidy among other farmers‟ support services to cushion famers against the impacts of climate variability. Farm production practices: farm production, land use, land topography, irrigation, and timing of operations Farm financial management: crop insurance (in case of crop failure related to variations in weather conditions), crop shares and futures, income stabilization programs, and household income (diversification schemes).
Adaptation measures in East African Countries
The EAC region is more likely to be vulnerable to the changes in rainfall and temperature due to region’s topography. The main sector that significantly contributes to the region’s people’s livelihood and economies is very risky because of consequences of climate change. Changes in temperature and rainfall have negative seasonal effects on crop yields of subsistence crops, cash crops and on livestock production [14]. To address the adverse impacts of climate change on agricultural productivity in EAC member countries, several adaptation measures have been discussed and put in place by the governments in order to intensify agriculture sector and further improve economic growth.
Climate change adaptation strategies in Ethiopia
Climate change adaptation is the adjustment in natural or human systems in response to actual or expected climatic stimuli or their effects, which moderates harm or exploits beneficial opportunities but mitigation refers to reducing climate change by reducing the GHG emissions. The study conducted by Chinasho, shows that the adaptation and mitigation potential of developing coun-tries to climate change are weakened due to poor building designs, agriculture, food security, low income, deforestation, and conventional solid- waste management system.
According to Asrat and Simane, studies revealed that the use of improved crop varieties, agro forestry practices, soil conservation practices, irrigation practices, and adjusting planting dates are smallholder farmers' most important adaptation strategies. However, adaptation decision is location-specific and influenced by key drivers such as socioeconomic, environmental, and institutional factors. Dagne Climate Change and Variability: Smallholder Farmers’ Perceptions and Indigenous Adaptation Responses.
Crop Diversification
This strategy seeks to avoid risks of total crop failure rather than maximizing yields of one particular crop. In Ethiopia, crop diversification is widespread. Crop diversification Ethiopia's most commonly used method to overcome climate changes. Greater use of different crop varieties in the same season could be associated with lower expenses and ease of access by farmers. Legesse noted that crop diversification soil and water conservation, and harvesting practices were commonly used climate change adaptation strategies in eastern Ethiopia [32]. Wondim agegn, “Patterns, trend and determinants of crop diversification: empirical evidence from smallholder in Eastern Ethiopia” [33].
Soil and Water Conservation (SWC)
Ethiopia has often used different kinds of soil and water conservation strategies since around 1990, and soil and water conservation strategies have probably developed much since then. Soil and water conservation strategies are mainly used because of soil degradation and erosion, and because farmers want to rehabilitate their fields. These activities are increasingly important today because climate changes to some extents are accelerating these processes.
Adaptation Strategies of Farmers to Climate Variability
Adaptation is a process by which strategies to moderate, cope with and take advantage of the consequences of climatic events are enhanced, developed, and implemented. The adaptation measure for the changing climate depends on the level of understanding of the issue, consequences and technological capacity of farmers. Adaptation is an essential strategy to enable farmers to cope with the adverse effect of climate change and variability, increasing the agricultural production of the poor farm households [34]. In Ethiopia farmers have been practiced several adaptation mechanisms at local level. Different adaptation measures have been practiced to the ever-variable climate in different parts of the country among smallholder farmers. According to Glwadys, some farmers have adjusted their farming practices to overcome climate change and variability impacts. Adaptation measures such as; crop diversification, adjusting farming calendar, using physical and biological soil and water conservation practices using different types of crop varieties and other agronomic practices are most commonly used adaptation strategies in different crop producing areas of the country.
Changing planting dates, changing crop type, soil moisture conservation practices, expanding farmlands, crop diversification and farm income diversification are repeatedly reported adaptation options under small scale and subsistence farmers [20].
Also, according to Yirga, farmers of Ethiopia practicing important adaptation options such as crop diversification, using different crop varieties, using short growing crop varieties, applying small scale irrigation, changing planting date and involving off farm activities against climate impacts. Negash and Eshetu reported that SNNPRS' farmers practice different adaptation options against climate variability such as using different crop varieties, implementing soil and water conservation and using irrigation [35].
Therefore, integrating local indigenous knowledge with scientific approaches is important for successfully planning and developing appropriate adaptation decisions. A key component of climate adaptation includes building resilience, where resilience is the capacity of a system to tolerate disturbance without collapsing into a qualitatively different state that is controlled by a different set of processes [14]. Regarding Government or institutional adaptation strategies, there are a number of existing national policy initiatives, policies, programs and strategies that may directly or indirectly address climate change adaptation in Ethiopia. Accordingly, some of the most important policy and program documents that have relevance to climate variability or change adaptation include; environmental policy of Ethiopia particularly adaptation and mitigation to climate variability or change, agriculture and rural development policy and strategy, and national agricultural research policy and strategy.
The ultimate goal is to reduce climate variability/change impacts through short and long-term development programs, particularly in natural resource management, utilization, development and conservation. Accordingly, Ethiopian food security program (PSNP) and Ethiopian sustainable land management program (SLMP) are among Ethiopia's institutional adaptation strategies, particularly in the study area. Thus, considering the nature of the climate variability or change as a crosscutting issue, it would be useful to incorporate some of the climate variability or change adaptation interventions into the on-going national programs like poverty reduction as a sub component (Conway and Schipper, 2011).
Some of the national adaptation strategies on crop production planed by NAPA are; enhancing erosion control, improve and changing management practices and techniques such as planting date, seedling rate, fertilizer application rate, engagement in obtaining food from other sources and income generating activities in times of crises, proper use of climate information for land use planning and early warning systems, grow crops which require less water.
Rainfall and Temperature
Rain fall is the main determinates of growth and yield in the fed agricultural area in the main source of soil moisture; plant observe water their roots and transpire through small hocks in their leaves water loss via transportation has to be replaced by water available in the soil to sustain plant. To grow plants, have different water requirements depends on their physiological, phonological status and the climatic zone where they are grown some small than large plants, small plants transpire less and thus need less water other plants have particular water needs during critical growth stages for hot, dry windy and sunny areas.
Plants transpire more and thus require higher water than cool, humid, cloudy and windless water. Temperature is on the other hand measure of Vulnerability of crops to damage by high temperature varies with development stage. Crop responses to temperature depend on the temperature optima for photosynthesis leading to growth and yield, which may vary for different crops. The reproductive stage is very sensitive to temperature where low temperature may delay on these, which could affect final yields of crops.
Rain falls and Temperature variability in Ethiopia
Quoting IPCC Siri Ericson, 2008 wrote that Annual rainfall is likely to decrease throughout most of the African region, except Eastern Africa, where annual rainfall is projected to increase. These changes in the physical environment are expected to have an adverse effect on agricultural production, including staple crops such as millet and maize. Trend analysis of annual rainfall in Ethiopia shows maximum and minimum. In Ethiopia, annual temperature has rapidly increased in the last five decades (1951-2005). However, significant temperature difference was observed among different parts of the country. Highlands in the Central North of the country would be as cold as0.5 and the Southeast lowlands would be as warms as 37. This extreme temperature constrains crop production by limiting water availability and growth of many plants [5]. The recent years are the warmest compared to the early years. In the study conducted by, Ethiopia's climate change profile also shows that the mean annual temperature increased by 1.3 °C between 1960 and 2006. The frequencies of hot days and nights have also showed an increasing trend during these years. According to (NMA, 2007) report, the annual minimum temperature over the past 54 years has been increasing by about 0.37°C every ten years. The temperature increase has been most rapid from July to September (0.32°C per decade). Awetahegn, Yibrah, Tigray region found an increasing trend or a positive trend in the annual maximum temperature by 0.018°C per year but negative trend was observed in minimum temperature by -0.038°Cper year for period of record (1995-2014) [36-37]. In the coming 100 years, the average temperature in Ethiopia has projected to increase from 23.08°C during 1961-1990 to 26.92°C in 2070-2099 [15].
Precipitation shows two important rains in Ethiopia- the ‘Kiremt’ and Belg‘. The Belg rains usually begin March to May in South West and advancing northwards affecting most of the country from June to September. The Kiremt rain begins June to July and ends October and November in almost all of the country. There is seasonal, inter-annual and inter-decadal rainfall variability in Ethiopia. Geographical location and topography lead the country to be vulnerable to rainfall variability. The strong inter annual and inter-decadal variability in rainfall makes difficult to detect long term trends in the country. Studies showed that there is no statistically significant trend observed in mean rainfall in any season between 1960-2006. However, rainfall variability is considered major risk source for farmers who depend on crop production.
Precipitation like the temperature is expected to vary between different parts of the country. While it will be decreasing in the northern, the southern part of the country would see an increase of temperature as much as 20%. The rainfall variability measured by the coefficient of variation is common in Ethiopia. According to Agricultural economists, rainfall variability greater than 30 is risky for farmers who depend on crop production which is prevalent in most parts of Ethiopia. In rainfall anomaly, the year-to-year variation of rainfall for the period in between 1951 to 2005 over the country expressed in terms of normalized rainfall anomaly averaged for 42 stations. The country during those periods (1951 to 2005) has experienced both dry and wet years over the last 54 years. Historically the country has been prone to extreme weather events. Major droughts that led to dreadful famines and floods struck different parts of the country. It also exacerbated the transient poverty. At country level, the average precipitation rate has been 2.04 mm per day 1961 to 1990. This precipitation is projected to decrease to 1.97 mm from 2070- 2099. The problem is exacerbated by higher evaporation rates associated with increasing temperature.
Climate Change and variability in Ethiopia
Climate is a narrow sense usually defined as the average weather or more rigorously, as the statistical description in terms of the mean and variability of relevant quantities over a period of time from months to thousands or millions of years. Climate change to a change of climate which is attributed directly or indirectly to human activities that alter the composition of the global atmosphere and are in addition to natural climate variability observed over a comparable period. Africa is highly stressed, has a low adaptive capacity, and is easily vulnerable to climate change. The main consequences of this negative impact of climate change or current climatic hazards are poverty, unequal access to resources, food insecurity, globalization trends, social and political conflicts and incidences of diseases such as malaria, tuberculosis and HIV/AIDS. This impact of climate change presents a substantial challenge to regional agricultural development. The sub-Saharan Africa country is low adaptation mechanism and vulnerable to the widespread effect of climate change. With this bid serious problem, the coming 2100 year in most the continent GDP will predict loss.
The IPCC’s fifth report indicates that future climate change will lead to an increase in climate inconsistency and in the frequency and intensity frequency and intensity of extreme events in Africa including Ethiopia [10]. In Africa by 2020, between 75 and 250 million people are projected to be exposed to increased water stress due to climate change. Climate change is a climate change attributed directly or indirectly to human activity. It alters the composition of the global and/or regional atmosphere and natural climate variability observed over comparable time periods. Climatic variabilities are the types of changes (temperature, rainfall, occurrence of extremes); magnitude and rate of the climate change that causes the impacts on the area of public health, agriculture, food security, forest hydrology and water resources, coastal area, biodiversity, human settlement, energy, industry, and financial services. In Ethiopia, climate variability and change is mainly manifested through the variability and decreasing trend in rainfall and increasing trend in temperature. Besides, rainfall and temperature patterns show large regional differences [38]. Climate change is a key concern to Ethiopia in our time and need to be tackled in a state of emergency. It has brought an escalating burden to the country's existing environmental concerns, including deforestation and agriculture sector. According to National Meteorological Services of Ethiopia indicate that the average minimum and maximum temperatures have been increasing by about 0.25°C and 0.1°C, respectively over the past decade whereas the rainfall has been characterized by a very high level of variability over the past 50 years. Climate change is a climate change attributed directly or indirectly to human activity. It alters the composition of the global and/or regional atmosphere and natural climate variability observed over comparable time periods. Climatic variability are the types of changes (temperature, rainfall, occurrence of extremes); magnitude and rate of the climate change that causes the impacts on the area of public health, agriculture, food security, forest hydrology and water resources, coastal area, biodiversity, human settlement, energy, industry, and financial services. Changes in physical and socioeconomic system have been identified in many regions.
Vulnerability to climate change in Ethiopia is highly related to poverty (loss of copying or adaptive capacity) in most of the regions. Adaptive capacity is the ability or potential of a system to respond successfully to climate variability and change, in order to reduce adverse impacts and take advantage of new opportunities. Those societies that can respond to change quickly and successfully have a high adaptive capacity [39]. Ethiopia is vulnerable to climatic variability due to its low adaptive capacity, low socioeconomic development, high population growth, inadequate infrastructure, lack of institutional capacity and high dependence on climate sensitive natural resource-based activities.
The lesser vulnerability of SNNP was associated with its relatively higher access to technology and food market, its highest irrigation potential and its literacy rate. Afar, Somali, Oromia, and Tigray regions were highly vulnerable. The vulnerability of Afar and Somali was mainly associated with lower levels of regional development. Despite the fact that these regions were less populated than the other regions, the % age of people with access to institutions and infrastructure remains very low due to the lowest level of regional development. According to IPCC Fifth Assessment Report of Famine Early Warning Systems Network (FEWS NET), there has b. The average number of ‘hot’ days and ‘hot’ nights per year are also increased from time to time. Based on, McSweeney expression, there is no statistically significant trend in observed average rainfall in any season and also daily rainfall records are insufficient to identify current trend [32-40].
Conceptual Frameworks
The study aimed at examining climate variability trend, determining impact of climate change on crop production, establishing household food security status and evaluating effectiveness of crop production in the study area. The independent variable is climate variability (rainfall and temperature), natural and anthropogenic (human) drivers and social factor (awareness gap, skill; gap and less trend to mitigation and adaptation practice) and environmental change are dependent variables such variables assume to affect food security (food production). This can lead to seasonal crop failure and long-term production problem, leading to low yields and food insecurity. Climate variability as well can affect food access in a way that, as agricultural produce decreases, food prices shoot, and the purchasing power reduces. Environmental change in this case involves the extreme weather events such as droughts and floods.
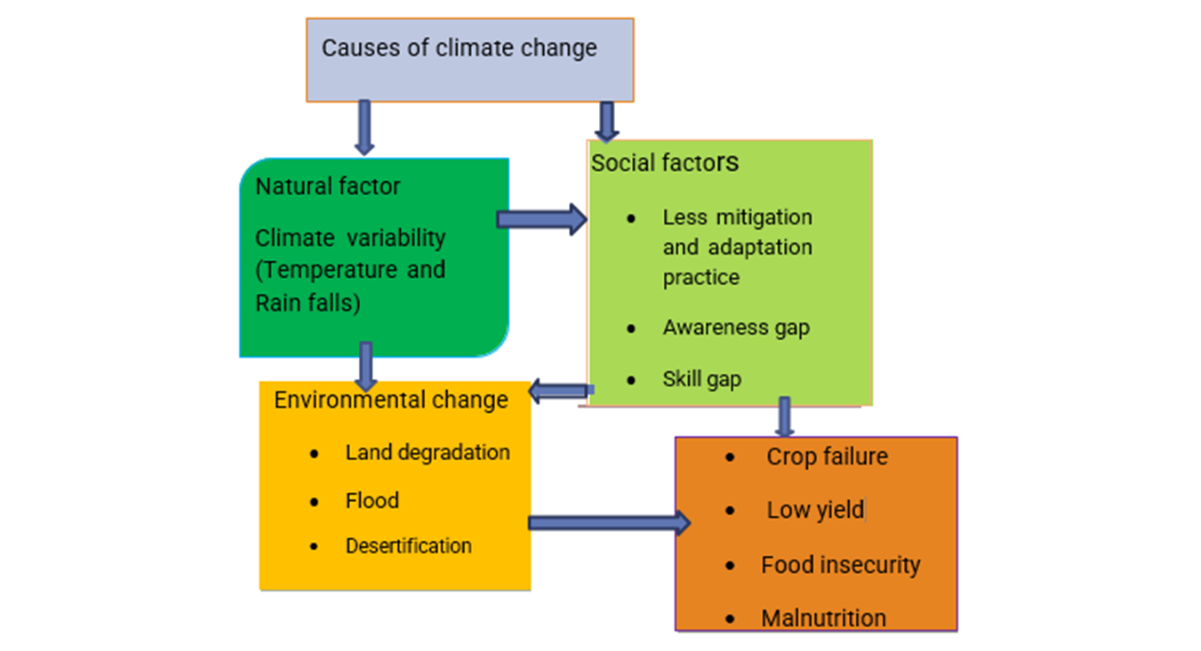
Figure 2.1: Conceptual frameworks of the climate change impact on crop production
Source: Adopted and modified [14]
MATERIALS AND METHODS
Descriptions of the Study Area
Location and Land Area
Halaba zone is a product of many years of interaction among people at the area in the Central Ethiopia region and it’s become zone in a very recent past year. Located in the Ethiopian great Rift valley bordered on the south west of Hadiya zone, on the north west Kembata zone, on the north east lake shalla and on the east by Oromiya region. It stretched between 7°18 '22’’ to 7°40’ 00’’North latitude and 38004'22” to 380 23'05’’ east longitude. Relatively Bilate River, which is its major water body, defines its western boundary. Halaba zone has total surface area of 994.66 square km, the highest point of the land is 2396 masl, and lowest point is 1500 masl. Regarding topographic features of zone are mountainous or elevation is 7%; slope or undulating land is 26% and plain or lowland levels is 67%. Halaba zone has been divided into 3 woreda (Wera woreda, Wera dijo woreda and Atot Ullo Woreda). The administrative town of Halaba zone is kulito Town, which is located distance of 245km south of AA through Butajra-wulbarag road; 315km through Mojo-shashmene roads; and 60 km northwest of the regional center Hosanna and the distance between Hosannas to AA is 354 km. The town of Halaba is sits on the left of Bilate River with different amenities including digital telephone access, postal, water, and electrical services. Economy is largely depending on subsistence agriculture. In the form of dry land farming and raising livestock with semi-agriculture, main cash crop includes pepper, maize, Teff, millet, sorghum and wheat.
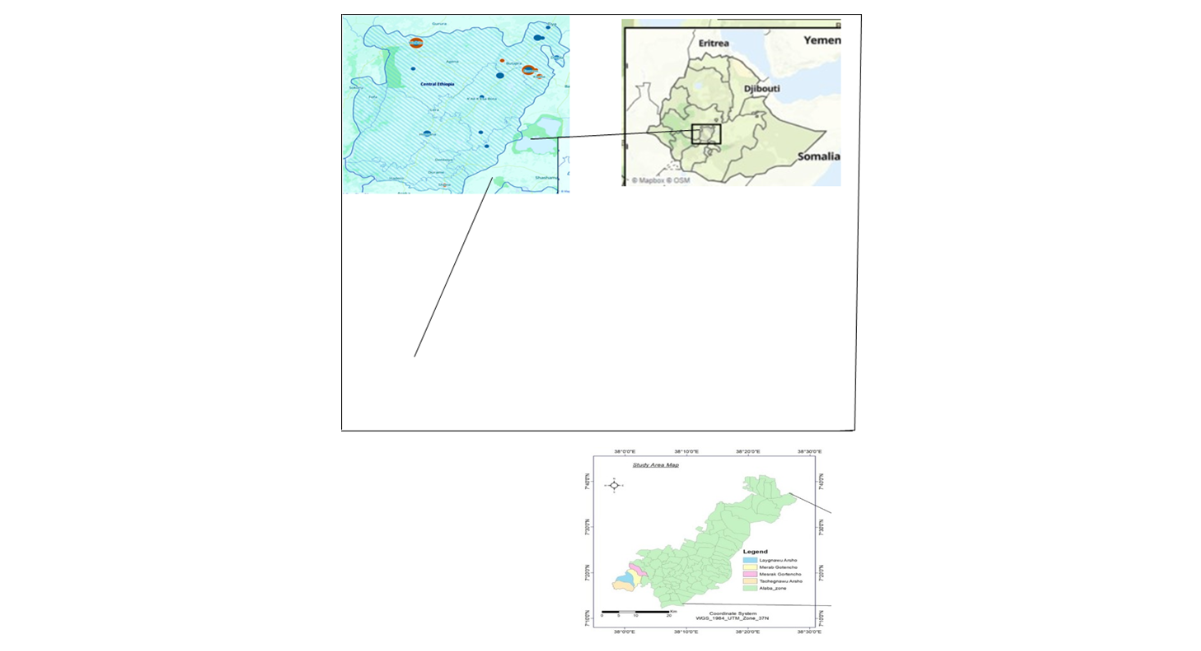
Figure 3.1: Map of study area Source Arc GIS 2024
Topography; Altitude and Climate summary of the study areas
Wera woreda yearly temperature is about 31-79 c° (890F), annual rainfall 857-1090mm, annual rainfall range 544-1271mm, daily temperature 23-24 c°, night 10c°, the highest annual temperature is 19c°, mean annual rainfall is 601-1200mm, mean annual temperature is 17.6-22.5 c°. The area is characterized as temperate or locally called woina Dega.The common agro-ecological climate zone is divided in to three, these are Dega 2%, Woina Dega 33% and Kola 65%. Regarding of topographic features of Wera Woreda consists of 3% is mountainous; 27% is slope or undulated land and 70% is total area is plain levels. The mea annual evapo transpiration is about 1379mm. The mean monthly evapotrspiration is low during the months July, August, and September. Mean monthly temperature is about 18-20 c°. Its highest altitude is 2396 and lowest 1500 from mean above sea levels. It is situated in the southern -tip of the zone and bordered by Northwest Kembata; on the south Oromiya regional states; on the east Wera dijo woreda and south-east Atot Ullo Woreda and on the South-west partial Hadiya zone Misrak Badawacho and Kembata Zone of Adilo woreda. Land area of the district is 33342 hectares which comprise of 25 rural kebeles. The administration of Wera woreda is kulito town.
|
No |
Purpose of land classification |
Area in hectare |
By % |
|
1 |
Cultivated/farm land |
3945 hr |
97.34 |
|
2 |
Forest and shrub land |
42.5 hr |
1.077 |
|
3 |
Grazing/grass land |
18.5 hr |
0.4689 |
|
4 |
Uncultivated fertile land |
26.5 hr |
0.671 |
|
5 |
Common popular land |
20 hr |
0.493 |
|
Total |
4052.5 hr |
100 |
Table 3.1: Physical condition of the Study areas
Note: Source of Survey: - HZAO, 2024
Population and Economic Activities in the study Areas
In the study area the total population number is 36594 from which 20253 were male and 16341 were female. From these total population number of house hold; male is 8465 and female are 3543 total number are 12008. In the study area, about 97% of people depend on agriculture; the remaining 3% are civil servants and merchants. The main production of study areas includes pepper; maize; Teff, Boloke, millet and the main cash crops are pepper. Pepper is economic backbone of the people and its exported weekly market day to Addis Ababa. Regarding to as people’s belief of mainly by Muslim 98 (58%) Orthodox 22 (13%) and Protestant are 47 (28%); information from the Woreda Cultural and tourism office.
Research Design
The study would employ descriptive research design. Descriptive researches are useful for gathering factual information. It is selected for the reason that enables the researcher to obtain current information about the impacts of climate change on crop production. Kothari explain that the main characteristics of descriptive survey are that it enables the researcher to come up with what has happened or what is happening. The strategy followed in research is constructed to explain concept, characteristics, descriptions, and measures to express situations of the issue identifying the assessing of impact of climate change on crop production and developing situation would be analyzed.
Sampling Procedure and Sample Size
Different stage of sampling techniques has been used for this particular study. In the 1st stage, four Kebeles were purposively selected from the whole Kebeles of Wera Woreda namely; Tach Arsho; Lay Arsho, Mesrak Gortancho and Merab Gortancho. The total households of the four Kebeles are 4516 based on the information obtained from each Kebeles administration office. In order to conduct this study, the size of sample households (HHs) would be determined from 4516 households (sample frames) of study. The formula given by Kothari (2004) was used to determine the sample size for this study.
Where, z = standard variation (95% confidence interval) =1.96
n= the sample size, q= 1-p
e= designates the level of precision or error 5% (0.05)
q = represent (q is 1-p. (p) (q) are the estimate of variance
p = sample proportion in the target population estimated to have the measured characteristics of 0.5%
Therefore,
= 167 households would be selected for this study
The numbers of sampled HH from each kebeles were selected with proportion to the population size of the associations by using the following formula
NH = (NH/N) *n
Where,
NH = sample size of each kebeles
N = total members of selected kebeles. NH = total members of each kebeles
n = total sample size of sample kebeles
However, by preparing the list of members of each sample kebeles every 27 th individuals were taken by using systematic random sampling.
|
No |
Names of Keble |
Household population of each kebeles |
Sample of each kebeles |
||
|
Male |
Female |
Total |
|||
|
1 |
Tach Arsho |
938 |
319 |
1257 |
46 |
|
2 |
Lay Arsho |
895 |
122 |
1017 |
38 |
|
3 |
Merab Gortancho |
1123 |
91 |
1214 |
45 |
|
4 |
Mesrak Gortancho |
866 |
164 |
1028 |
38 |
|
Total |
3822 |
694 |
4516 |
167 |
|
Table 3.2: Household population and sample size
Note: Source, each Kebeles administration office, 2024
Types and sources of data
In this study both primary and secondary data sources would be used. Data would collect at one particular related to Climate change's impact on crop production.
Primary Data Sources
Primary data for this study would be collected from participants using qualitative and quantitative surveys. Primary data include household’s socioeconomic and demographic characteristics and perceptions. They would be derived through using questionnaires, structured interviews, semi structured interviews, in depth face-to-face interviews with key informants and field observation.
Questionnaire
In order to collect relevant data that support the secondary data; the researcher would use questionnaires as supplementary data source. The researcher would prepare both open-ended and closed-ended type questionnaires. The structured and pre-tested questionnaires would be distributed to the systematically selected representatives (participants). The questionnaires for the participants will originally be constructed (prepared) in English and then translated into Amharic to make the questionnaires clearer and easier for the respondents.
Interview
The researcher as would use interview as supplementary data sources to secondary data. In order to minimize respondents’ communication barrier and keep their freedom and flexibility; the interview process will be constructed in Amharic language and then translated into English. The researcher systematically selected to gather relevant information are; ZAO (2); WAO (1) from each selected Keble Agricultural DA (2); Zone Natural and water conservation Office (2) and Woreda developmental Agent (2) total of 9 Participants would be involved for interview purpose.
Focus Group Discussion
Different stakeholders from various levels would be involved in FGD session. Institutions (including 1 chairman and 3 participants of kebeles, 2 religious leaders, 2 Agricultural DA 1 woreda development agent and 4 Idir representatives to be discuss on how to impact on climate change on crop production). Thus, open ended questions would be used to guide discussions one includes listing of participants to respective group discussion.
Filed Observation
Rabson, 1995 indicates that field observation is used as supportive in w techniques to collect data may complement or set obtained by other means. In the time staying in the study area, the researcher real observes impact of climate change on crop production, such as crop failure; decrease of production. There is focus on five main crops in the study area, mainly impacted by climate change. Such as Boloke, Maize, Pepper, Teff and Millet.
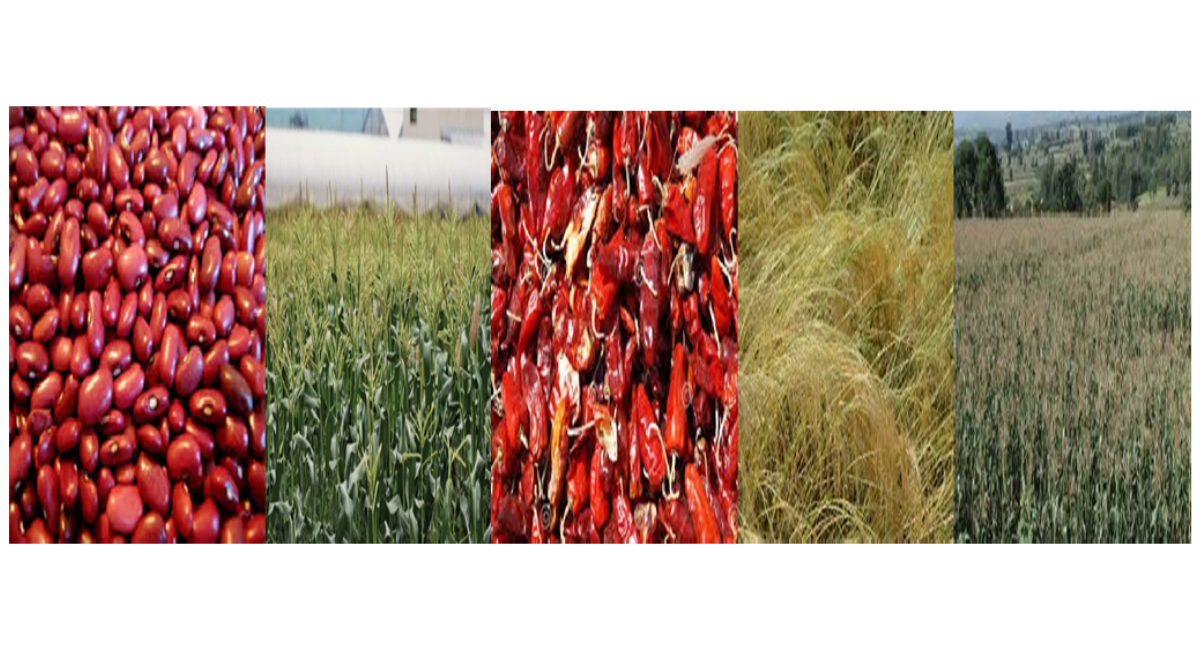
Figure 3.2: Field photograph of study area 2024
Secondary Data Sources
Secondary data sources would be collected from statistical abstracts, journal articles, books, policies belief, study reports, students’ thesis, and it also would be obtained from the internet, university, libraries, institutions and organizations. Assessing the impact of Climate change on crop production data system the previous findings related to similar researchers even used to compare and contrast the finding from the study.
Data Analysis Methods
The data would be analyzed by using qualitative and quantitative methods. The researcher would descriptive statics (frequency distribution, table percentage; ranges; mean; mode; standard deviation and variance) methods of data analysis by coding; cleaning and entering the data into the computer with the help of SPSS version 20. The precipitation concentration index which used to analyze the relative distribution of the rainfall patterns was used. Correlation would be used to examine the association between crop productivity and climate change in the study area. The climate and crop data will be taken from National Meteorological Agency and Halaba zone agricultural office. On the other hand; the primary qualitative data that would collect via questionnaires; interview and field observation (in the form of image; text and) would analyze through narration and the data derived from the multiple methods would triangulate to make the common perspective.
Ethical Consideration
Ethical consideration can be specified as one of the most important parts of the research. Dissertations may even be doomed of failure if this part is missing. Respondents should participate on the bases of informed consent. The principle of informed consent involves researcher providing sufficient information and assurances about taking part to allow individuals to understand the implications of participation and to reach a fully informed, considered and freely given decisions about whether or not to do so, without exercise of any pressure or correction. The use of offensive, discriminatory or other unacceptable language needs to be avoided in the formulation of questionnaire or interview or focus group discuss.
RESULTS AND DISCUSSION
Demographic and socio-economic Characteristics of the Households
Age and Sex of the respondents
Out of 167 sample household heads surveyed in the survey about 89.8% and 10.2% were male and female respectively (Table 4.1). This is because male household heads are most likely the ones engaged in crop production than households headed by females in the study area. Gender of the household head plays a critical role in farming decision making. Some studies have shown that gender is an important variable affecting access to information, affecting the level of understanding about climate change. Nhemachena, Hassan and Deressa confirmed that Male- headed households are more likely to get information about new technologies and undertake risky businesses than female-headed households [41-42]. Moreover, Tenge argued that having a female head of household may negatively affect the adoption of climate change measures, because women may have limited access to information, land, and other resources due to traditional social barriers. From the 167 sample respondents, 12%, 35.3%, 33% and 19.7% were found in the range of 15-30, 31- 45, 46-60 and above 61age status respectively. According to this survey result, age groups 46-60 and above 61 understand climate change's impacts on crop productivity better than the other age groups as elders have longer time weather information in the area. According to Madison, experience in farming increases the probability of adopting adaptation measures to climate change. As a result, the household might have better adaptation measures to adverse impacts on climate change. Similarly, this study was agreed that experience increases the probability of adapting to climate change increase.
|
Variable |
Category |
Frequency |
Percent |
|
Gender |
Male |
150 |
89.8 |
|
Female |
17 |
10.2 |
|
|
Total |
167 |
100 |
|
|
Age |
15-30 |
20 |
12 |
|
31-45 |
59 |
35.3 |
|
|
46-60 |
55 |
33 |
|
|
Above 61 |
33 |
19.7 |
|
|
Total |
167 |
100 |
Table 4.1: Sex and age composition of the respondents
Note: Source: - Survey result, 2024
Family Size and Marital Status of Sample Respondent
As the survey results indicate that, from the total respondents, 86.4% were married, 6.6% widowed, 5.3 % divorced and the remaining 1.7% are single (Table 4.2). With regard to family size of sample respondents over 60% of them have family size of 1-3 and 21% of them have family size of 4-6. Altogether, 81% of sample households have family size of 1-6, with low variability. This implies that the study area represents the highest family sizes. For this study, family size refers to the number of members in a household and measured in number.
The variable is continuous and assumed to represent the labor input to the farm. Nhemachena showed that large family size is mostly inclined to divert part of its labor force into non farming activities, which increases the chances of adapting to climate change. In addition, Deressa reported that large family size increases the probability of taking up of adaptation strategies to climate change as large family size is normally associated with labor endowment, which would enable a household to accomplish various agricultural tasks especially during peak season. Therefore, the variable was hypothesized to positively influence smallholder farmers' choice of climate change adaptation strategies. This implies that the differentiation of social status and family size affects their livelihood and adaptation to climate change.
|
Variable |
Category |
Frequency |
Percent |
|
Marital status |
Single |
3 |
1.7 |
|
Married |
144 |
86.4 |
|
|
Widowed |
11 |
6.6 |
|
|
Divorce |
9 |
5.3 |
|
|
Total |
167 |
100 |
|
|
Family size |
1-3 |
100 |
60 |
|
4-6 |
35 |
21 |
|
|
7-9 |
32 |
19 |
|
|
Total |
167 |
100 |
Table 4.2: Family Size and Marital Status of Sample Respondent
Note: Source: - Survey result, 2024
Education of the household heads
In Figure 4.1 below shows the average number of years in formal education of the heads of household. Overall, the results indicate that about 112 out of 167 farmers reported to attend formal education. About 33% of the household heads had no formal education and about 67% had at least form education. From those who attend formal education about 38% attained primary education, while about 18.4% attained secondary education and the remaining 10.6% attained diploma and above education. This shows that majority of the respondents in the study area were literate which is better to adopt and understand the effects of climate change on crop productivity. As confirmed by Deressa, education of the head of household increases the probability of understanding climate change also increase [42]. Also, Komba, have shown that farmers with more education are more likely to pursue the effects of climate change than those farmers with lower education levels.
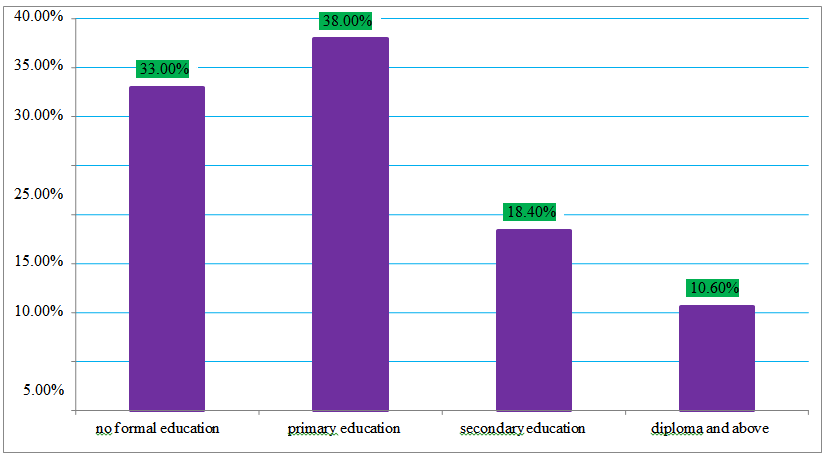
Figure 4.1: Respondents distribution based on education
Occupation
Regarding to occupation of inhabitants residing in the area; 83.8% were farmers that engaged their livelihood totally in agriculture (crop and livestock production), 9.6% were public servant, 5.4% were traders or merchants and the remaining 1.2% were engaged in other occupations like laborers (their life depends on daily labor work). Therefore, from the target respondents about 83.6% engaged in agriculture which is the highest percentage that means majority of the households were farmers in the area and significant number of them were public servants, merchants and participate in non- agriculture in their extra time to get additional income. This shows that, almost all of the respondents residing in the area were familiar with agriculture that and can consider every happening in climate change and its effect on crop production in the stud y area. As a result, most of the respondents were able to consider climate change based on their indigenous knowledge. They are adjusting themselves to adapt rainfall fluctuation, variability in onset, end date, and temperature increase for their production activity in the study area.
|
Variable |
Category |
Frequency |
Percent |
|
Occupation |
Farmers |
140 |
83.8 |
|
Traders |
9 |
5.4 |
|
|
Public servant |
16 |
9.5 |
|
|
Daily laborers |
2 |
1.2 |
|
|
Total |
167 |
100 |
Table 4.3: Distribution of respondents by their Occupation
Note: Source: - Survey result, 2024
Land holding size
The figure below that out of total sampled households, 16% have land size less than 0.5 hectare while 44% have land size of 0.51-1.0 hectare. The remaining 16% and 24% of them have land size-greater than 1.1-1.5 hectares and 1.51-2.0 hectares respectively. This implies that the majority of land holding size of the sampled household is averagely found between the intervals of 0.5-1.0 hectare. The study also signifies that the average total land holding is lower especially due to rapid growing population. There are also farmers less than 0.5ha land, which accounts for 16% of sampled households. Thus, they participate mainly in daily labor work and trading activities to live. The unbalanced land distribution is problem affecting the life of some households in study area. Some studies found farm size to positively influence farmers' understanding of climate change. For instance, Ehiakpor , noted that farmers with larger farm sizes are more likely to understand effects of climate change than their counterparts with smaller farm sizes. This is because households with large farm size due to dependence on other nonfarm activities. Tend to invest on agricultural activities continuously and regularly. But households with small farm size less likely to cultivate their land.
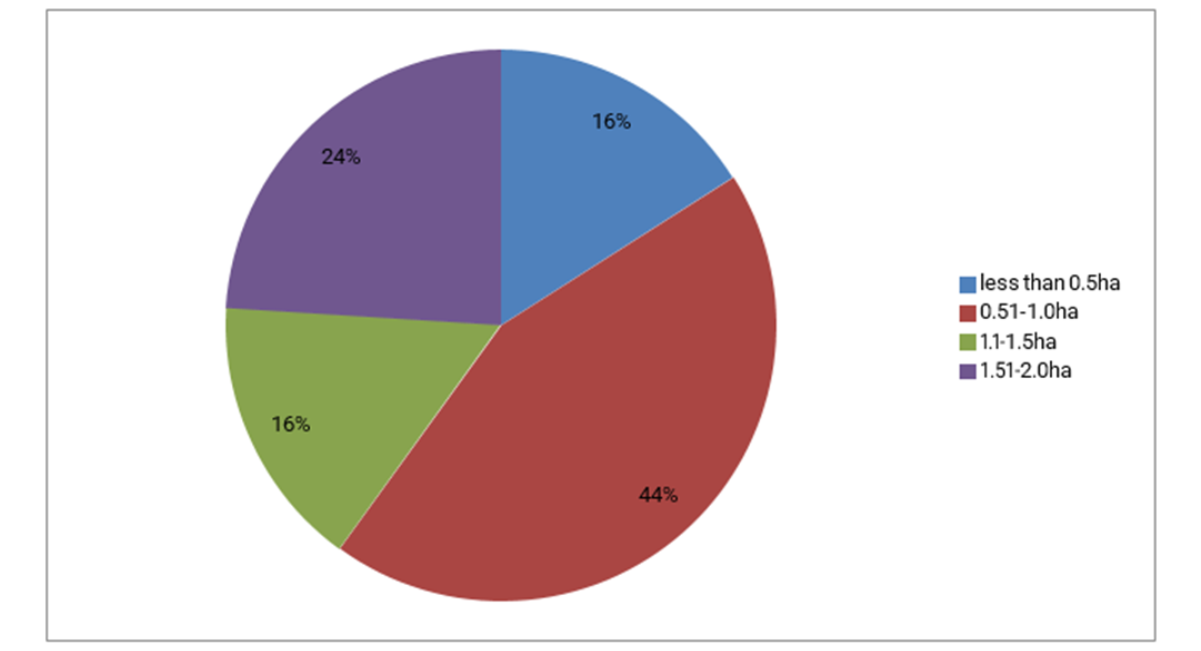
Figure 4.2: Respondents distribution by Land holding size
Livestock Production
This sub-section gives a summary of livestock owned by household. Results indicate that the majority of farmers own cattle, goats and poultry. The total number of farmers own cattle, goats and poultry are 128, 42 and 31 respectively. The average ownership of poultry and goats is higher than average ownership of other livestock. The minimum ownership of all livestock is 1while the maximum ownership for sheep, cow, goat and poultry is 2, 4, 5 and 6 respectively. The last column of Table 4.3 presents ownership proportion of livestock by farmers. Out of 167 farmers reported to own livestock, about 76.6%, 15.6%, 25.1% and 18.6% own cattle, sheep, goat and poultry respectively. The maximum and minimum ownership for donkey/ mule/horse is 1 and about 12% of household owned it.
|
Variable |
Min |
Max |
Frequency |
Percent |
|
Number of cattle |
1 |
4 |
128 |
76.6 |
|
Number of sheep |
1 |
2 |
26 |
15.6 |
|
Number of goat |
2 |
5 |
42 |
25.1 |
|
Number of poultry |
1 |
6 |
31 |
18.6 |
|
Donkey/mule/horse |
1 |
1 |
20 |
12 |
Table 4.4: Distribution of respondents by livestock production
Note: Source: - Survey result, 2024
The Income source of households
Table 6 shows that out of sampled households 33% of them engaged in crop production while 41.3% of them are engaged in crop production and cattle. The remaining 11.4% of them are cattle production. Some farmers are participating in nonfarm activities i.e. trade and daily laborer which accounts for 6.5% and 3% of the sampled households, respectively. The study implies that most households of study area participate in crop production and cattle rearing. Thus, farmers excessively rely on crop production and animal rearing, which is climate sensitive. Thus, the most crop production, and cattle respectively was impacted by impact of climate change.
The agriculture sector in Ethiopia is dominated by small scale farmers who employs largely rain fed and traditional practice stage which renders Ethiopian highly vulnerable to climate change. According to the World Bank WB, the Climate change is projected to reduce shield of maize staple crop by 3.19% in Ethiopia. These amounts seriously threaten food security and the achievement of the major development goals. The rain fall and temperature are important determinates of crop harvest and unfavorable realization of either the amount or of crop harvests, and unfavorable realization of either the amount or the temporal distribution of rain falls triggers food shortage and famine. Cycles of drought creates poverty traps for many households, country easy tasks to build ups assets and increase income. Survey data shows that between 2001 and 2004 more than half of all households in the country experienced at least one major drought shocks.
|
Variable |
Frequency |
Percent |
|
Crop production |
57 |
34.1 |
|
Cattle production |
19 |
11.4 |
|
Both |
69 |
41.3 |
|
Non-farm |
8 |
4.8 |
|
Trade |
9 |
5.3 |
|
Daily labor |
5 |
3 |
|
Total |
167 |
100 |
Table 4.5: Distribution of respondents based on income sources
Note: Source: - Survey result, 2024
Main Crop growing season of the study area
The following figure shows that; there are two main crop growing seasons in the study area. These are Belg and Meher. Belg is the shorter season from February to April, and Meher is the main season from May to September. Crop production (mainly, wheat, soybean, millet, pepper and teff) greatly depends on rainfall patterns during the Belg and Meher season. Most respondents (60%) replied that Belg and Meher season is the dominant crop growing seasons in Wera Woreda. However, significant number of respondents (12%, 21%, 6% and 2%) replied Belg, Meher, summer and winter respectively are crop growing seasons in the study area. According to CSA (2018) the two main crop seasons in many parts of the country are the Belg and meher seasons which receive rainfall from February to June and from June to October, respectively. The meher crop season is the main season and produces 90-95 percent of the nation’s total cereals output, and the Belg harvest provides the remaining 5-10 percent of cereal output. In some highland regions, the Belg and meher seasons merge into one extended growing period whereby both long-cycle grains (such as sorghum and corn) and short- cycle small grains (such as wheat, barley, and Teff) can be grown. To avoid confusion between these two growing seasons, the Ethiopian Belg crop season is officially defined as any crop harvested between March and August, while the meher crop season is defined as any crop harvested between September and February.
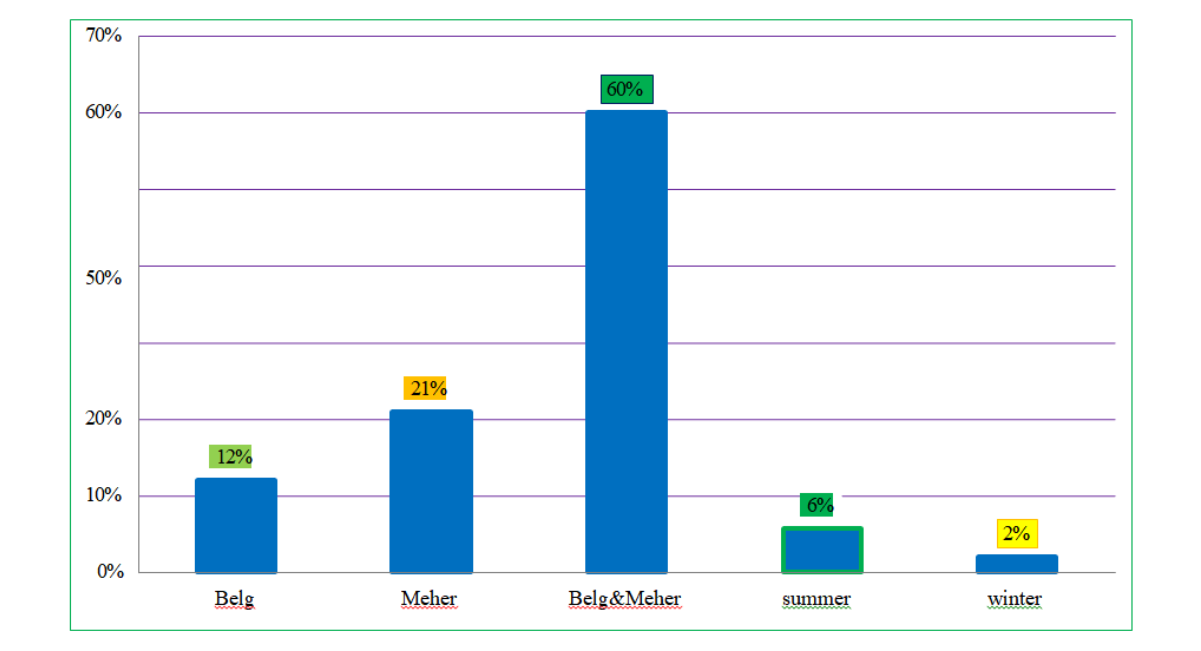
Figure 4.3: Main crop growing seasons in the study area
Respondent’s perception about climate change in the study area
From the table below, question number one; which asks whether the household have better understand about climate change and its impact or not. Out of the total sampled households, 95.8% of them replied that they have perceived climate change and its impacts, while 4.2% of them do not better understand climate change and its effect. It means that most farmers have access to climate change information and its impact from extension service and other sources such as media to understand climate change and its impacts. Regarding the second question about the pattern of rainfall majority (61.7%) of sampled households replied that annual rain fall decreased from year to year and 25.7% and 12.6% replied increasing and no change respectively.
This implies that rain fall pattern is one of the challenges of crop as well as livestock production. Farmers of the study area argue that late rain, early cessations and insufficient rains are rain fall-related problems affecting crop production. Regarding the third question about the pattern of temperature, again majority (76.6%) of the respondents replied increase, 23.4% replied no change. This also indicates that temperature has increased in the last 10 years. According to FGD report the households also can confirm that temperature increment can cause impact on health of human beings and livestock as well as crop production.
In view of this fact; households of the study area are exposed to the risk of several climates related hazards. The finding of this study is similar with the idea of FAO which concludes that agriculture production is affected by increasing temperatures, changing rainfall patterns, more frequent and intense extreme weather events [14]. These would directly affect crop growth and their need for water, soil fertility, water supply for irrigation, and prevalence of pests and diseases. Regarding livestock, climate change would also affect the quality and amount of feed supply and water.
|
Statement |
Alternatives |
Frequency |
Percent |
|
Understanding climate change |
Yes |
160 |
95.8 |
|
No |
7 |
4.2 |
|
|
Total |
167 |
100 |
|
|
Pattern of rainfall in the last 10 years |
Increase |
43 |
25.7 |
|
Decrease |
103 |
61.7 |
|
|
No change |
21 |
12.6 |
|
|
Total |
167 |
100 |
|
|
Patterns of temperature change in the last 10 years |
Increase |
126 |
75.4 |
|
Decrease |
5 |
3 |
|
|
No change |
37 |
22.1 |
|
|
Total |
167 |
100 |
Table 4.6: Distribution of respondents by their understanding of climate change
Note: Source: - Survey result, 2024
Trend of climate change in Wera Woreda
Temperature trend and variability
The climate data from 1995-2021 years was taken from National Meteorological Agency. The recorded average maximum annual temperature in the study area for the years 1995 to 2021 showed an increasing trend. As indicated in figure (4.4), the study areas' overall temperature continuously increased over time, especially after the early 2005s. Long-term mean maximum temperatures in the study area ranged from 24.4°C to 34.6°C, with an average of 29.5°C. According to National Meteorological Agency of Ethiopia the average annual maximum temperature in the country has increased by 0.180c per decade. However, as it is shown in figure 4.4 below the average maximum temperature increased at the rate of 0.26470c which is higher than the national trend. From year 1995-2000, the average maximum temperature is 28.70c, from year 2001-2005 the average maximum temperature is 31.40c, from the year 2006-2010 the average maximum temperature is 31.50c, from the year 2011-2015 the average maximum temperature is 33.90c and from the year 2016-2021 the average maximum temperature is 34.60c respectively. This indicates the temperature is varying within five and ten years.
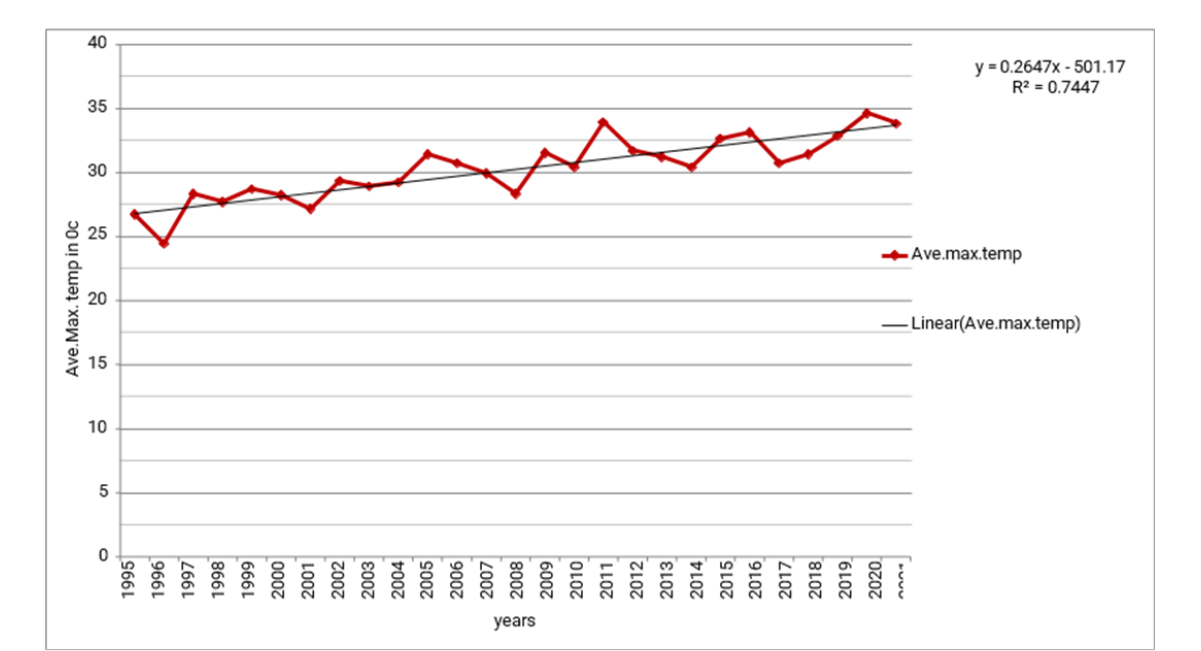
Figure 4.4: Patterns of average maximum temperatures in the study area
With regard to the minimum average temperature of the study area, it shows an increment from year to year. The long term annual minimum temperature ranges from 14.20c to 23.90c. Particularly starting from the year 2005 there was high annual minimum temperature variation began to record. From the year 1995-2000 the average minimum temperature was 14.20c, from the year 2001-2005 the average minimum temperature was 16.70c, from the year 2006-2010 the average minimum temperature was 19.50c, from the year 2011-2015 the average minimum temperature was 20.70c, from the year 2016-2021 the average minimum temperature was 21.70c respectively. The average minimum temperature is also continuously increased over the decade.
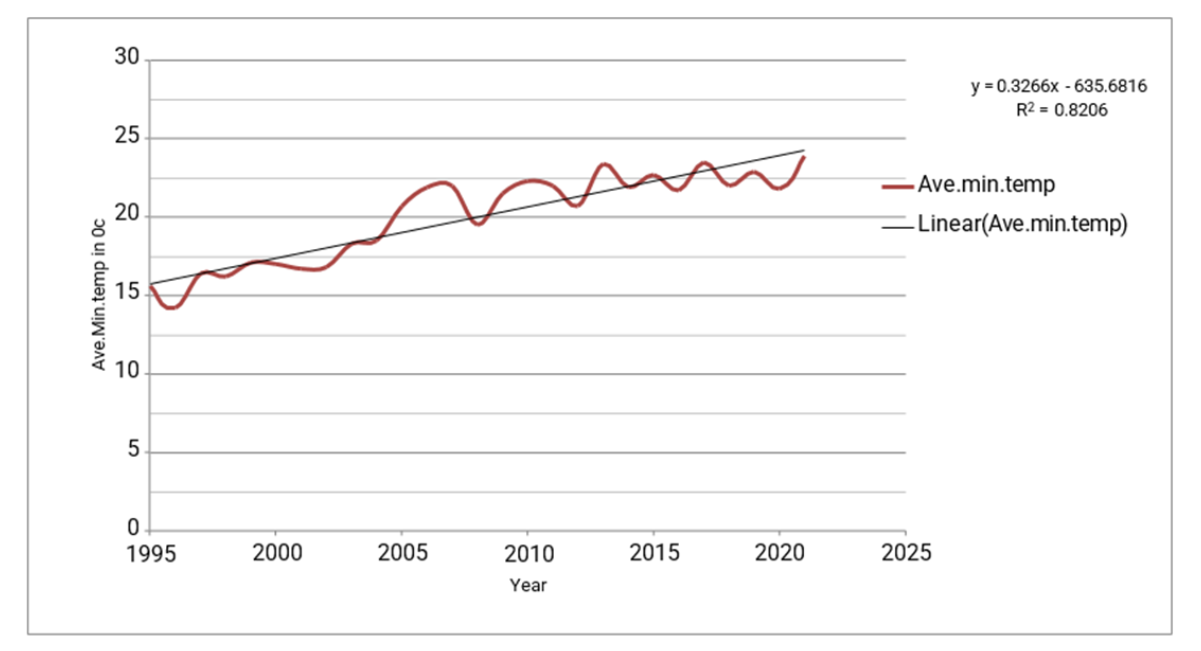
Figure 4.5: Average Minimum temperature of the study area
Annual, Seasonal and Monthly rainfall analysis
Annual Rainfall data
The rain fall data for 27 years was taken from national meteorological agency and computed. The annual total rainfall is somehow increasing and decreasing over the years in the study area. The rainfall of Wera Woreda ranges from 351.3 mm to 1250.2 mm with mean annual rainfall of those years is about 747.88 mm. As shown in figure 4.5 below the rainfall of the Woreda has shown inter annual changes over the last 27 years. The dries year was 2021, with a fall of 351.3mm, while the wettest year was 1996, with annual rainfall of about 1250.2 mm. Annual rainfall decreased by 16.48 mm per year.
By computing the precipitation concentration index which used to analyze the relative distribution of the rainfall patterns, the table 4.6 shows the precipitation concentration index (PCI) value of Wera Woreda is about 13.52. According to Oliver, value of PCI less than 10 indicate uniform monthly distribution while values between 11 and 20 signify high rainfall concentration and value greater than 20 represents very high concentration of seasonal rainfall distribution. This refers that the rainfall is concentrated towards certain year and the other years became low rain fall distribution.
|
Month |
Long term monthly rainfall (Pi) |
Mean Pi2 |
|
January |
46.25 |
2139.06 |
|
February |
45.54 |
2073.89 |
|
March |
56.20 |
3158.44 |
|
April |
68.36 |
4673.08 |
|
May |
57.37 |
3291.31 |
|
June |
83.67 |
7000.66 |
|
July |
116.22 |
13507.08 |
|
August |
88.51 |
7834.02 |
|
September |
49.05 |
2405.90 |
|
October |
49.41 |
2441.34 |
|
November |
47.86 |
2290.57 |
|
December |
25.87 |
669.25 |
|
∑pi = 834.31 |
∑pi2 = 51484.6 |
Table 4.7: Computation of PCI value
Note: Source: - NMA (2024)
PCI=
= 13.52
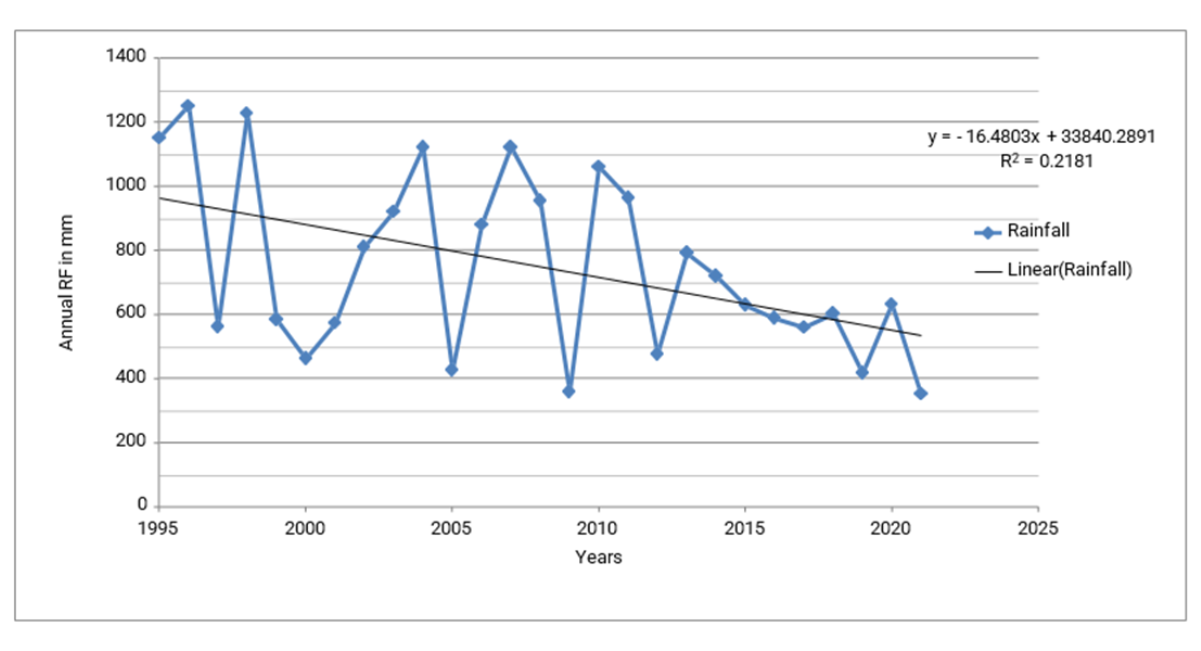
Figure 4.6: Total annual Rainfall of the study area
Seasonal rainfall analysis
The total seasonal rainfall and average data was computed on each season and decades are presented in table 4.7. As shown in Table 4.7, the summer rainfall distribution trend shows relatively constant trend throughout the years. The summer rain compared within different years; minimum amount of rain is received from duration of 2019-2021. Its amount has shown a range of 722.4 mm in 2019-2021 and 1117.7mm in 1995-1997.The total rainfall concentration from 1995-2021 this season is about 7787.2mm. Winter is the lowest rainfall season which receives rainfall of 496.4mm during period the period of 1995-1997 and receives rainfall of 195.7mm during period 2019-2021. It ranges from 195.7mm to 496.4mm which indicates scarce rainfall season. However, in the study area summer and winter are the two contrasting seasons in rainfall distribution. In spring there is also relatively decreasing rainfall trend during the decade. However, the decreasing rate is not much significant until 2012. But the variability significantly increased after the year of 2012. The maximum rainfall recorded in 1995-1997 which is about 747.5mm. On the other hand, the minimum rain fall is recorded in 2019-2021, about 246.mm. This shows that the spring rainfall ranges from 246.1mmto 747.5mm during the decade of (1995-2021). Generally, its trend shows relatively decreasing from the starting year to the ending year. In autumn the rainfall distribution seems uniform from 2001-2012 for consecutive 12 years. However, the maximum rainfall recorded in 1995-1997 and minimum rainfall recorded in 2019- 2021respectively. The general rainfall distribution shows decreasing trend within the last 27 years.
|
Year |
Summer (J, J & A) |
Winter (D, J & F) |
Spring (M, A &M) |
Autumn (S, O &N) |
|
1995-1997 |
1117.7 |
496.4 |
747.5 |
600.2 |
|
1998-2000 |
841 |
390.1 |
609.5 |
433.6 |
|
2001-2003 |
796.3 |
457.1 |
563.8 |
519.6 |
|
2004-2006 |
882.4 |
374.2 |
651.1 |
518.6 |
|
2007-2009 |
883.7 |
432 |
592.2 |
526.2 |
|
2010-2012 |
904.5 |
349.4 |
697.5 |
548.9 |
|
2013-2015 |
830.8 |
318.3 |
387.7 |
603.4 |
|
2016-2018 |
808.4 |
197.4 |
417 |
328.1 |
|
2019-2021 |
722.4 |
195.7 |
246.1 |
237.5 |
|
Total |
7787.2 |
3210.6 |
4912.4 |
4316.1 |
Table 4.8: Total seasonal rainfall data in decades
Note: Source: - Computed based on the raw data obtained from NMA (1995-2021)
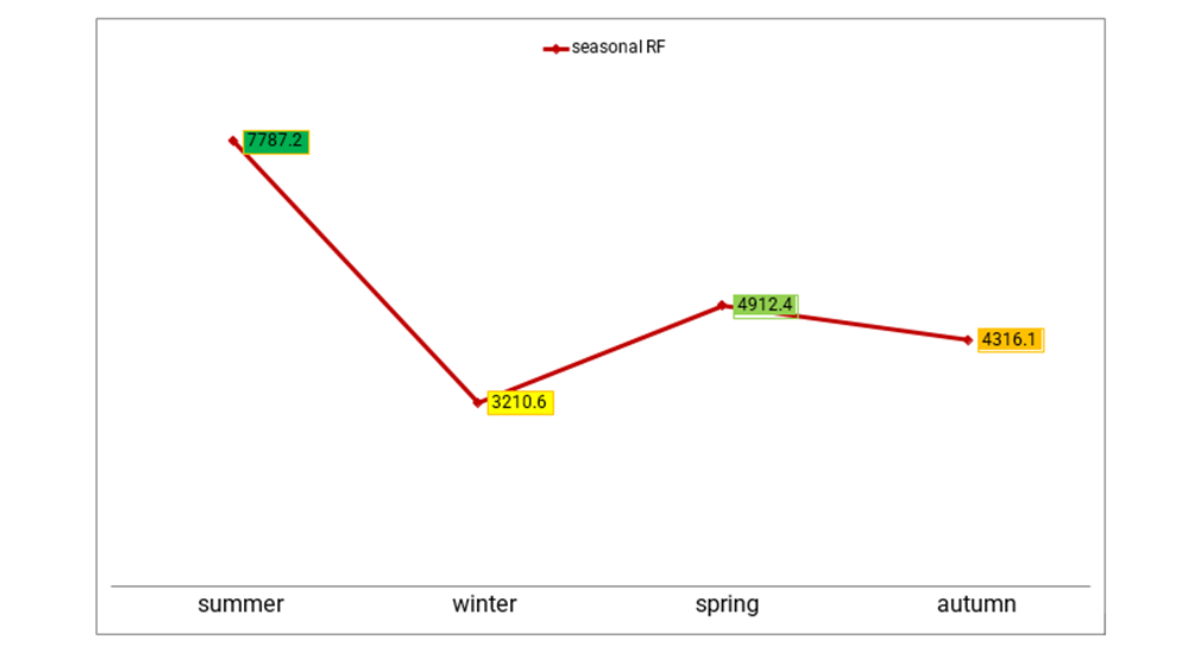
Figure 4.7: Total seasonal rainfall data in decade
Monthly rainfall analysis
The long-term monthly rainfall distribution also shows fluctuation from month to month with different years. In the study area December, January and February are months with low rainfall, while June, July, August are months with highest rain fall and finally the remaining six months (March, April, May, September, October and November are moderate rainfall months. The lowest month is December with the average rainfall amount of 25.87 mm and the highest month is July with the average rain fall amount of 116.22 mm. However, the long term mean monthly rainfall shows moderate coefficient of variation with CV value 24.37%.
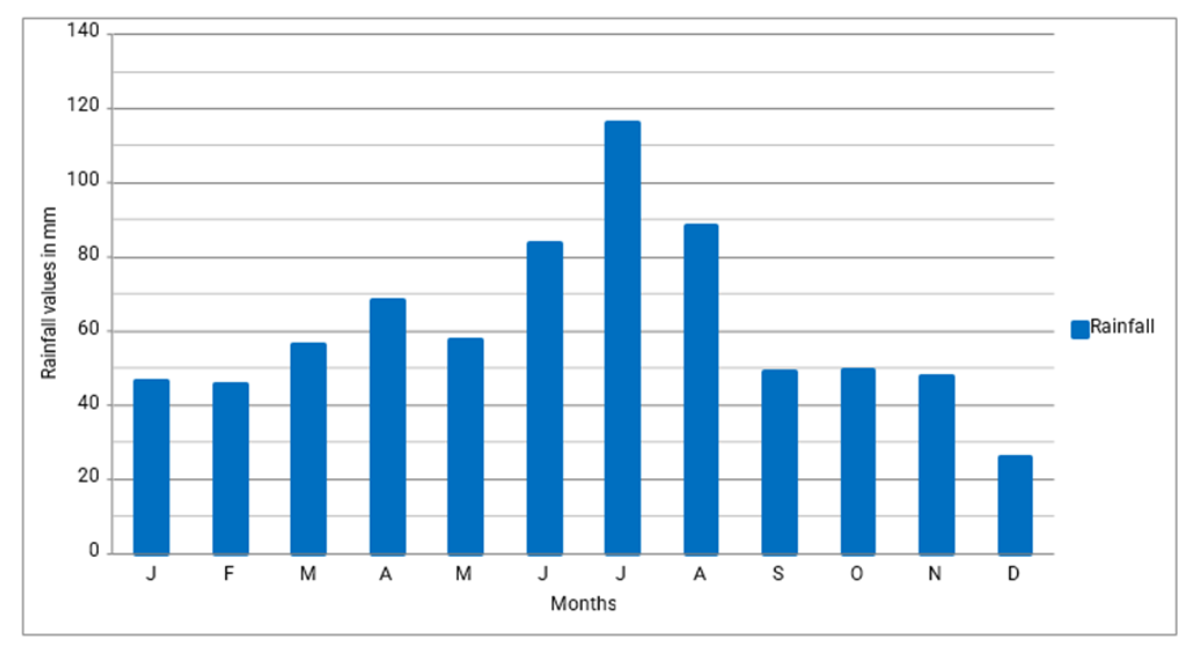
Figure 4.8: Monthly rainfall distributions in decades
Impact of climate change on crop production
Based on the table below 91.1% of the sampled households replied that climate change has indeed affected their crop production while 8.9% of themes indeed affected their crop production while 8.9% have not observed any impact of climate change. Regarding the second question about climate change impacts 53.3% of the sampled households observed that climate change causes crop production per hectares to decrease while 15.6% of them replied that it causes crop production totally to fail. The remaining 7.2%, 20.9%and 3% of them replied that climate change causes to livestock death, water scarcity and soil erosion/flooding respectively. This indicates that climate change had serious impacts on crop and water availability and cause agricultural productivity to decrease significantly. The FGD participants also indicated that rainfall and temperature in study area have been decreasing and increasing, respectively, thus negatively affecting the production and management of crop and livestock in the study area. Crop failure and water shortage for human and livestock is common problem in the study area due to shortage of rainfall. One of the respondents from Lay Arsho Kebeles said the following:
Climate affects all of us because our life is totally intertwined with crop production and livestock, they are our life. So, in the case of rainfall shortage, we are unable to cultivate any crop and our livestock has no grass/fodder. The other respondent also replied that Belg- crop (maize and Boloke) were our staple food for, but the frequent failure in Belg rain forced us to totally depend on autumn. In cases of both spring and Meher harvest fails, the situation is even worse.
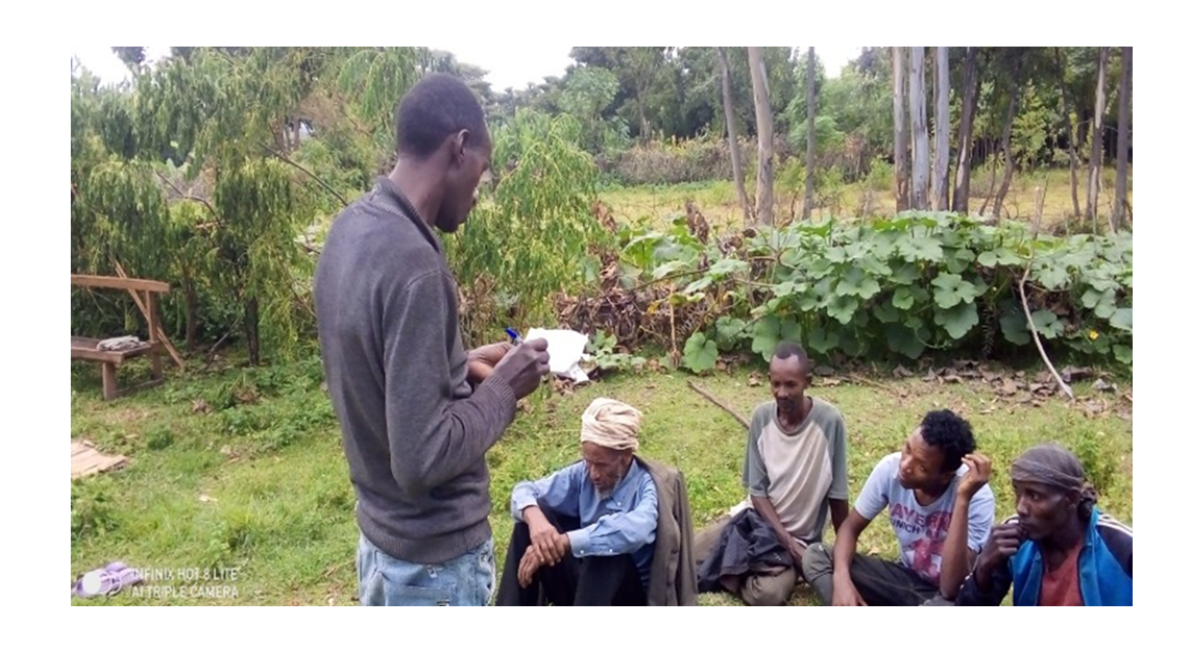
Figure 4.9: Field photograph
|
Alternatives |
Frequency |
Percent |
|
|
Observed impact of climate change |
Yes |
152 |
91.1 |
|
No |
15 |
8.9 |
|
|
Total |
167 |
100 |
|
|
What impacts did you observe |
Totally crop failure |
26 |
15.6 |
|
Livestock death |
12 |
7.2 |
|
|
Water scarcity |
35 |
20.9 |
|
|
Production per hectare decline |
89 |
53.3 |
|
|
Soil erosion & flooding |
5 |
3 |
|
|
Total |
167 |
100 |
Table 4.9: The impact of climate change on crop production
Note: Source: - Survey result, 2024
Decline in Production per hectare
The productivity trend of cereals in 1995 to 2021 showed different trends (Fig.4). Maize average productivity showed the highest in 1996 (32.3Q/ha) and lowest in 2021 (13.2Q/ha) and which is lower and lower than the national average 23.9 Q/ha (CSA, 2021-2022). However, from 1996-2021 maize productivity declined by 19.1Q/ha. This might be the result of long-term climate change that affects agricultural productivity in the study area. Teff productivity ranged from 6.7 Q/ha in 2020 to 28.9 Q/ha in 1995. According to the (CSA, 2020/2021) the national teff yield accounts about 24.6Q/ha and the current production of Teff in the study area is below the national average. This also shows that Teff productivity per hectare was decreased from year to year. In the four years (1995, 1996, 1998, 2004) its productivity seems relatively equal or higher than the countries national average teff yield. From the year 1995-2021 the production of teff decreased by 22.2Q/ha. Soybean or B“oloke” in local language is the other main production in the Wera Woreda of Halaba Zone. The productivity of soybean ranged from 7.3 Q/ha-1 in 2021 to 26.4 Q/ha in 1998. However, the current production of Soybean in the study area is yet lowers than the national average 26.75 Q/ha (CSA, 2021/2022). The production of Soybean decreased by 19.1Q/ha for the decade (1995- 2021).
Millet productivity ranged from 25.1Q/ha in 1996 to 6.4 Q/ha in 2019 in the study area, and it shows decreasing trend. This yield was lower than the national average 16.1Q/ha (CSA, 2021/2022). For the first four consecutive years (1995-1998) its production shows a relatively normal positive trend and is above the national average of 19.7Q/ha (CSA, 2000). Therefore, Halaba is one of the major finger millets producing area, and the annual yield is decreasing within the decades. Halaba in general and Wera woreda in particular is the potential producer of red pepper. The productivity trend in the first four years showed constant increasing trend up to 1998, and then it started to decline to 7.9 Q/ha in 2021. The productivity of red pepper reached its maximum (34.5Q/ha) in 1998 and the minimum 7.9Q/ha in 2016. The following figure also shows the decreasing trend of cereal crops over decades. Accordingly, the trend line showed that decrease in the amount of maize at the rate of 0.55 Quintal per year and 5.5 quintal per decade with R2of 0.5046. Similarly there is a decrease in the amount of Teff at the rate of 0.68 Quintal per year and 6.8 quintal per decade with R2of 0.69, Kidney bean at the rate of 0.64 Quintal per year and 6.4 quintal per decade with R2of 0.62, millet at the rate of 0.61 Quintal per year and 6.1 quintal per decade with R2of 0.65, pepper at the rate of 0.92 Quintal per year and 9.2 quintal per decade with R2 of 0.64 respectively.
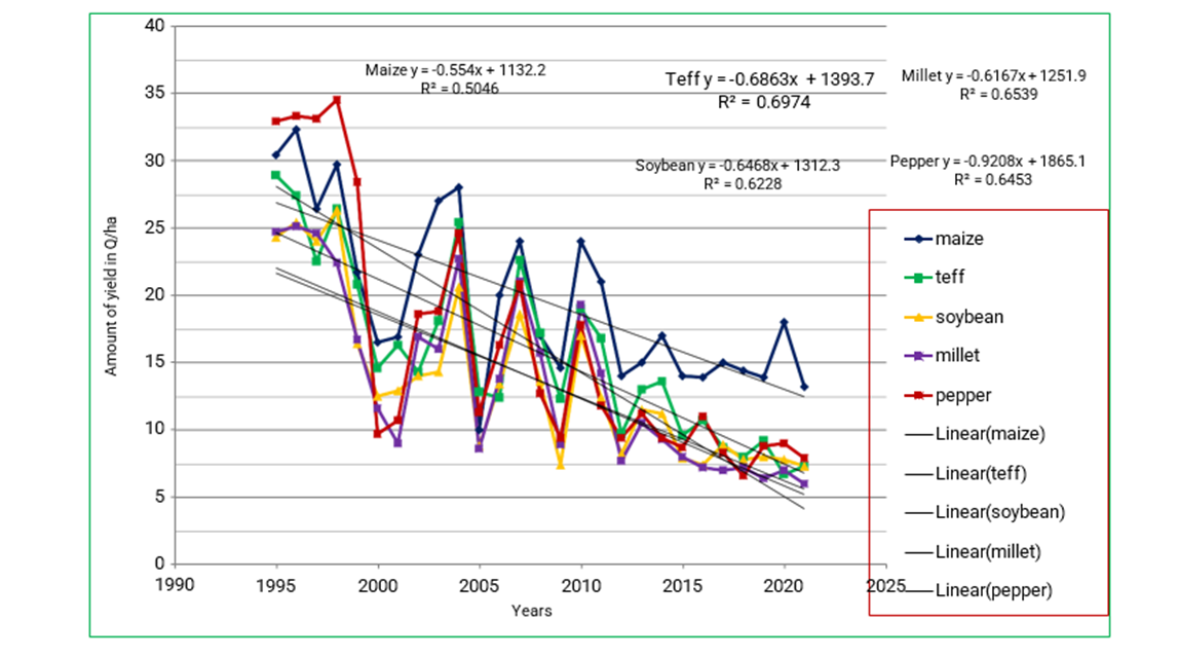
Figure 4.9: Number of cereal crops of study areas yield in Q/ha/decade
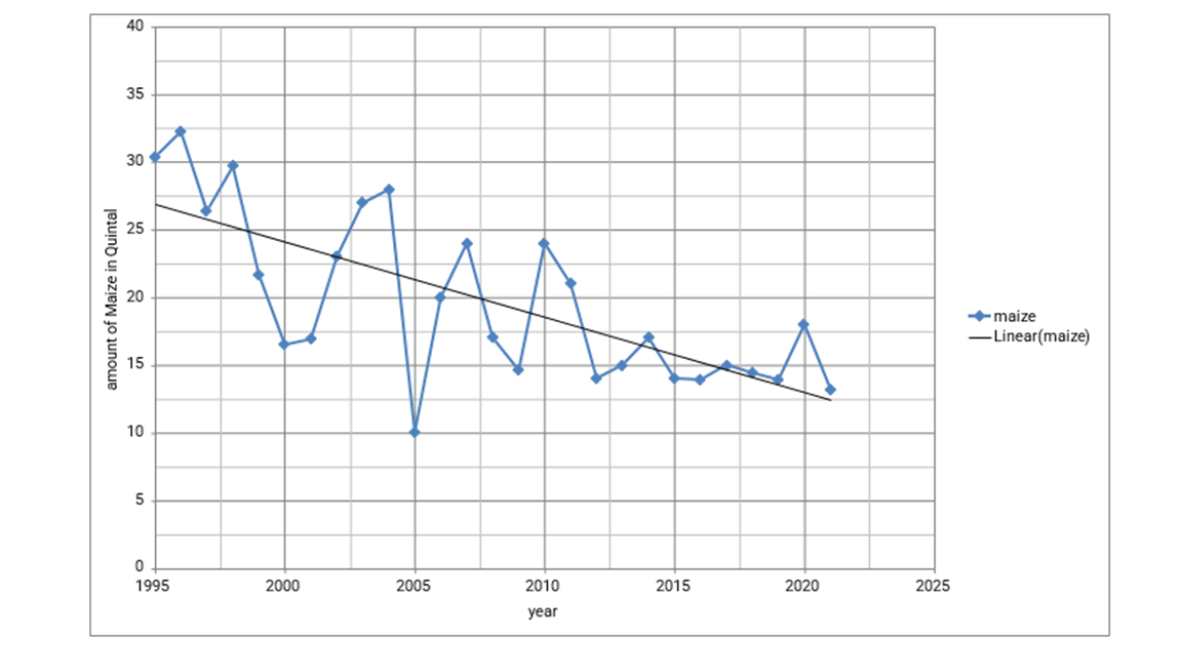
Figure 4.10: Amount of maize yield in Q/ha/decade
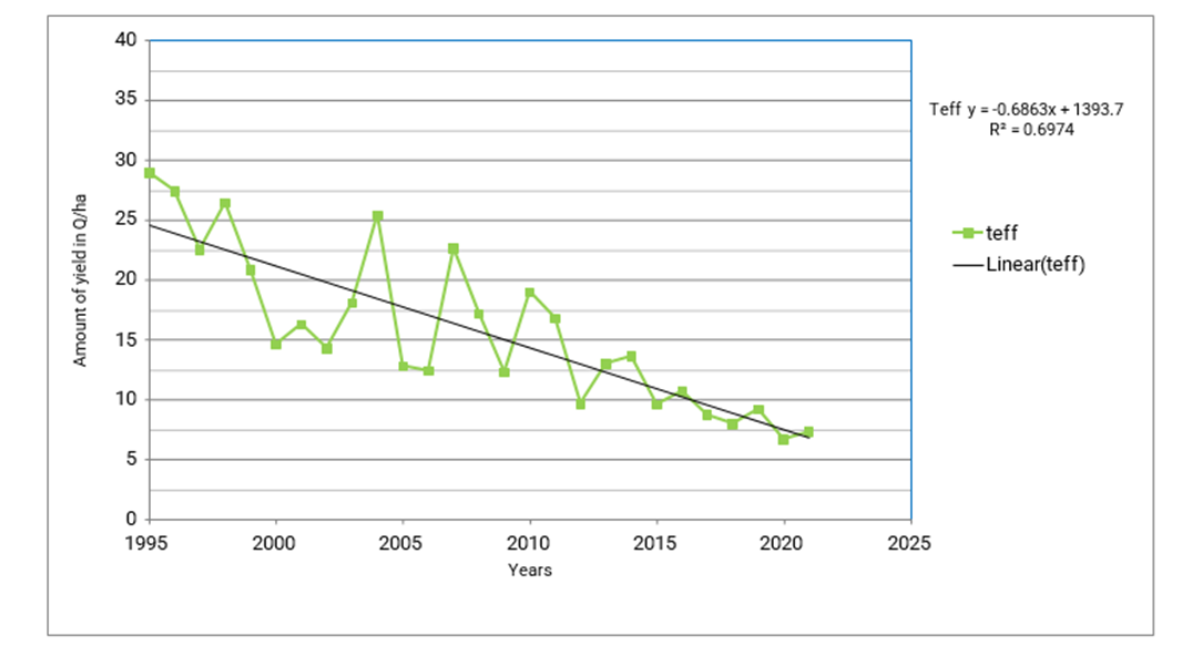
Figure 4.11: Amount of Teff yield in Q/ha/decade
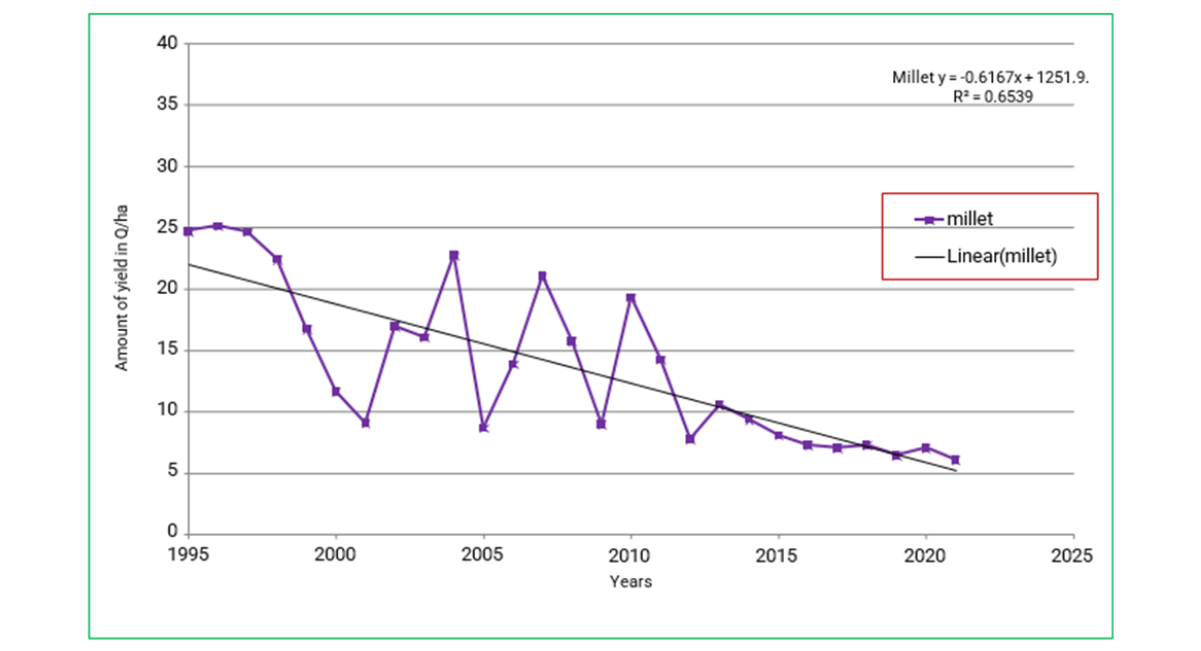
Figure 4.12: Amount of Millet yield in Q/ha/decade
Note: Millet yield in Q/ha/decade
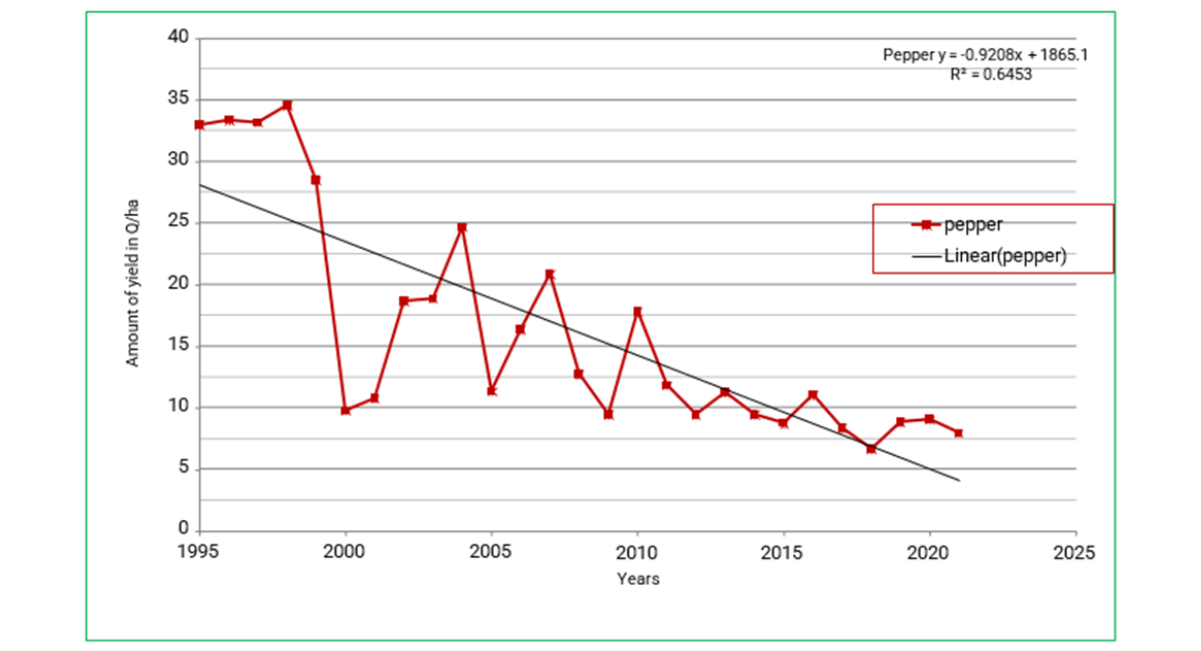
Figure 4.13: Amount of pepper yield in Q/ha/decade
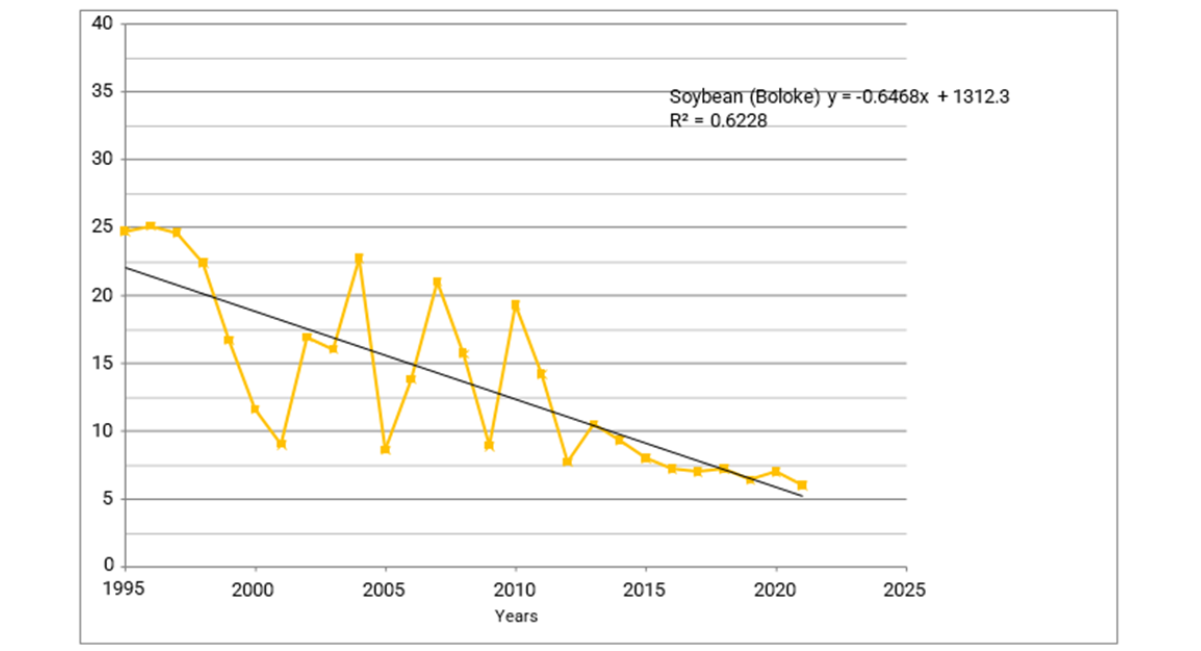
Figure 4.14: Amount of Boloke (Soybean) yield in Q/ha/decade
Rainfall and Temperature Correlation with Crop Yield
Rainfall and Temperature Correlation with Maize Yield
The relationship between climate and the yield of major food crops is analyzed through correlation with the null hypothesis (Ho) that there is statistically significant correlation between climate element (rainfall and temperature) and yield of the five major food crops. Regarding rainfall and maize, the correlation coefficient of 0.735 is interpreted as a strong positive relationship between the two variables. The significance 2-tailed gives p value of 0.002 which is less than 0.05, hence, the Ho is accepted, that the study provides enough evidence to conclude that there is statistically significant correlation between rainfall and maize yield.
In terms of regression, (Ho) is that, there was supported relationship between rainfall and maize yield. The results give R value of 0.435 and R square of 0.589 meaning rainfall explains about 58.9% of maize yield. The same Ho is assumed concerning the relationship between temperature and maize crop. The analysis uses maximum temperature values. Temperature and maize provide correlation coefficient of -0.322 interpreted as weak negative relationship. The significance 2-tailed is 0.023, hence, Ho is retained since 0.023 < 0.05. The regression indicates R value of -0.322 and R square of 0.189 indicating that temperature accounts for 18.9% of variation in maize yield.
Rainfall and Temperature Correlation with Teff Yield
Rainfall and Teff correlation provides coefficient of 0.408 representing there is weak positive correlation between the two variables. The significance 2-tailed shows 0.004, hence, Ho is maintained since 0.004 < 0.05. The regression analysis indicates R value of 0.208 and R square of 0.312 implying that rainfall accounts for only 31.2% of Teff yield while other factors explain 62.8% variation in the Teff yield. Temperature and Teff correlation gives coefficient of -0.688 denoting strong negative relationship. The significance 2- tailed is 0.006 which is lesser than 0.05, hence, Ho is also accepted. The regression results show R value of 0.688 and R square of 0.474 meaning temperature explains 47.4% of yield variation in teff.
Rainfall and Temperature Correlation with Boloke (kidney bean) Yield
The rainfall and Boloke relationship give a correlation coefficient of 0.814, which is a strong positive relationship. The significance 2-tailed is 0.000, hence, Ho is accepted since 0.00 < 0.05. The regression results provide R value of 0.114 and R square of 0.520, meaning rainfall accounts for 52% of Boloke yield variation. Temperature and Boloke show correlation coefficient of - 0.204 representing weak negative relationship. The significance 2-tailed is 0.484, hence, Ho is maintained because 0.004 <0.05. The regression model gives R value of 0.204 and R square of 0.142 implying that temperature is responsible for only 14.2% of variation in yield of Boloke (kidney bean).
Rainfall and Temperature Correlation with Degussa Yield
Rainfall and Degussa linkages by correlation provide coefficient of 0.576 interpreted as moderate positive relationships. The significance 2-tailed is 0.641, hence, Ho is retained but it is not statistically significant since 0.641 > 0.05. The regression coefficients are R value of 0.576 and R square is 0.029 suggesting that only 2.9% of variation in the yield of Degussa is explained by rainfall. Temperature and Degussa linkages provide correlation coefficient of -0.595 representing strong negative relationship. The significance 2-tailed is 0.025 which is lesser than 0.05, hence, Ho is accepted. The regression analysis indicates R value of 0.595 and R square of 0.354 suggesting that temperature accounts for 35.4% of the variation exhibited by Degussa yield.
Rainfall and Temperature Correlation with red pepper Yield
Rainfall and red pepper correlation shows coefficient of 0.541 representing moderate positive relationship. The significance 2-tailed is 0.000, hence, Ho is retained because 0.000 < 0.05. The regression shows R value of 0.441 and R square of 0.362 proposing that rainfall accounts for only 36.2% of the variations in pepper yield. Temperature and red pepper record correlation coefficient of -0.328 representing moderate negative relationship. The significance 2-tailed is 0.003 < 0.05, hence, Ho is retained. The regression analysis registers R value of 0.328 and R square of 0.107 suggesting that temperature is responsible for only 10.7% variation in yield of red pepper.
Vulnerable social groups to impact of climate change
Climate impacts and extreme weather events can affect anyone, but some people have the potential to be more affected than others. How badly a person or group will be affected will depend not just on their exposure to the event, but on their social vulnerability that is, how well they are able to cope with and respond to events like water scarcity, drought, crop disease, floods and heat waves. The respondents were asked to reply which social groups of people are more vulnerable to impacts of climate change. Accordingly, 11.6% of respondents replied men are more vulnerable, 32.3% replied that women were more vulnerable, 18.6% replied persons with disabilities were more vulnerable, 22.8% replied young girls were more vulnerable, 5.4% replied that young boys were more vulnerable and the remaining 9.5% replied that older people were vulnerable to climate change. However, most respondents replied that women, young girls and persons with disabilities are more influenced by climate in the study area. Women often face higher risks and greater burdens from the impacts of climate change in situations of poverty and due to existing roles, responsibilities and cultural norms. For example, in many societies, women are responsible for household energy, food, water and care for the young and elderly. The previous study done by Morchan stated that certain social groups are particularly vulnerable to climate related crises, for example, female-headed households, children, persons with disabilities, older people, and others tend to be sensitive to climate impacts like floods and heat waves. Studies have shown that women disproportionately suffer the impacts of disasters, severe weather events, and climate change because of cultural norms and the inequitable distribution of roles, resources, and power, especially in developing countries. Women make up the majority of the world’s poor and are more dependent than men on natural resources for their livelihoods and survival. Women tend to have lower incomes and are more likely to be economically dependent than men. When drought or unseasonable rain, for example, threatens agricultural production, men can use their savings and economic independence to invest in alternative income sources or otherwise adapt. In times of food scarcity and drought, women will often give priority to their husbands his nutritional needs will be met before hers. Women are also more vulnerable because they have less access to education and information that would allow them to manage climate-related risks to agriculture and livestock.
|
Alternatives |
Frequency |
Percent |
|
|
Most vulnerable group to climate change |
Men |
19 |
11.4 |
|
Women |
54 |
32.3 |
|
|
persons with disabilities |
31 |
18.6 |
|
|
Young girls |
38 |
22.8 |
|
|
Young boys |
9 |
5.4 |
|
|
Older people |
16 |
9.5 |
|
|
Total |
167 |
100 |
Table 4.10: The most vulnerable group to climate change
Note: Source: - survey result, 2024
In FGD session one of the respondents said the following:
In much of the area including my Kebeles, women are still engaged in traditional roles as mothers and family caregivers. Men may be able to migrate for economic opportunities, but women are more likely to remain home to care for children and elderly or sick family members. Climate change has a significant impact on securing household water, food, and fuel activities that usually are the responsibility of women and girls. In times of drought and erratic rainfall, women and girls must walk farther and spend more of their time collecting water and fuel. Girls may have to drop out of school to help their mothers with these tasks, continuing the cycle of poverty and inequity. Changing climates also affect the health of crops and livestock, and women, who are often responsible for producing the food eaten at home, must work harder for less food.
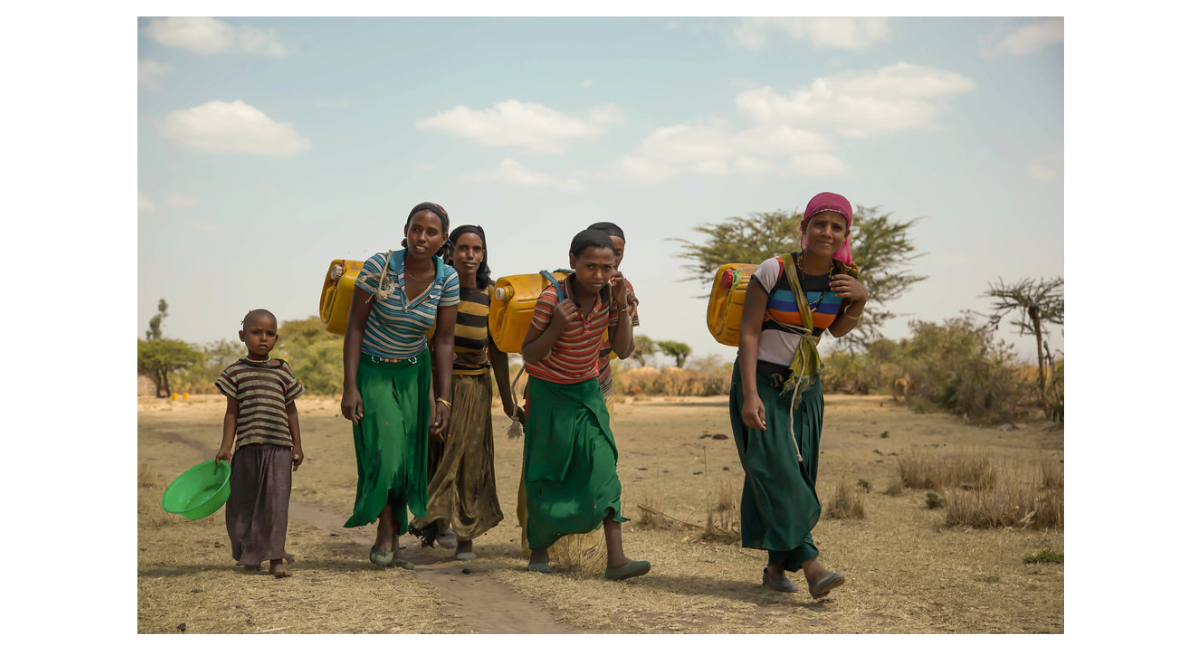
Figure 4.15: Women and girls who walk more than 2 hr. for search of drink water
In some rural areas, it is not uncommon to spend 2-3 hours day collecting water for the family, making it impossible for girls to attend school regularly. Fatima 24-year girl said the following:
“Most of the time I’m the one to fetch water for my family. During continuous dry seasons we are challenged by drinking water. Once school is finished, around 6pm, I go and fetch water. It takes me about one-and-a- half hours. I have to wait in a long line once I get there. If I have homework or studies, I can’t do it. If we had water near our home, I’d have more time to study after school. If we had water, I could focus on education. I could achieve more. This problem is more acute during dry seasons. The climate has been changed and lack of rain is commonly occurring in our Woreda. This situation is also aggravating our life”.
The response of small holder farmers towards climate change
Adaptation Response
Climate change in the form of higher temperature, reduced rainfall, and increased rainfall variability reduces crop yield and threatens the local small holder farmers in particular and agriculture-based economies in general. However, the farmers are not simply waiting to the problem but they were struggling to survive in the situation. The unreliable rainfall characteristics and increasing temperature makes difficult and less productive for smallholder farmers who depend on crop production as it directly and indirectly affects agriculture. Farmer’s views and opinions regarding climate change play a great role in responding by formulating adaptation strategies for the adverse impact of climate change. According to the survey result, various adaptation responses were being employed by farmers in response to climate change in the study area. The surveyed household heads that have been affected by climate change were asked about their response towards in face of climate change in the study area. The sample household heads in the selected four Kebeles (Lay Arsho, Tach Arsho, Misrak Gortancho and Mirab Gortancho kebeles) were asked either they were using adaptation measures or not against variable climatic conditions and they were requested to respond “Yes” or “No” (Table 4.9).
|
Kebeles |
Yes |
No |
||
|
Frequency |
Percent |
Frequency |
Percent |
|
|
Lay Arsho |
35 |
21 |
3 |
1.8 |
|
Tach Arsho |
40 |
24 |
6 |
3.6 |
|
Misrak Gortancho |
32 |
19.2 |
6 |
3.6 |
|
Mirab Gortancho |
43 |
25.7 |
2 |
1.1 |
|
Total |
150 |
89.9 |
17 |
10.1 |
Table 4.11: adaptation options of farmers to climate change by Kebeles
Note: Source: - survey result, 2024
The above table shows that about 21% from Lay Arsho Kebele had been taken different adaptation measures against climate change and the remaining 1.8 % respondents had not taken any adaptation options in the study area. While 24% of Tach Arsho respondents had taken adaptation measures and 3.6 % of the respondents had not taken any adaptation options to climate change in the study area. In Misrak Gortancho and Merab Gortancho 19.2% and 25.7% of the respondents had adaptation measures towards climate change and the remaining 3.6 % and 3.6% had not taken any adaptation options in the study area? In general, from the four sampled Kebeles 89.9% had taken an adaptation measure. Five-point liker scales is used to analyses the feeling and opinion of the respondents towards the types of adaptation responses towards climate change.
|
Types of adaptation measures |
SDA |
DA |
U |
A |
SA |
Rank |
|
Crop diversification |
- |
- |
- |
11% |
89% |
1st |
|
Tree planting |
- |
23% |
12% |
30% |
35% |
6th |
|
Adjusting crop planting dates |
- |
- |
- |
26% |
74% |
2nd |
|
Irrigation |
11% |
34% |
10% |
25% |
20% |
7th |
|
Mixed farming |
- |
29% |
- |
38% |
33% |
5th |
|
Migration |
34% |
29% |
- |
17% |
20% |
9th |
|
Off-farm activities |
- |
18% |
- |
42% |
40% |
4th |
|
Food aid |
48% |
12% |
- |
27% |
13% |
8th |
|
Selling asset |
- |
- |
- |
42% |
58% |
3rd |
Table 4.12: Types of adaptation measures to climate change
Note: Source: - survey result, 2024
According to the information from Table 4.10, 89% of respondents replied “strongly agree” on crop diversification and 11% replied “agree”. Majority of the respondents strongly agree on crop diversification as the major adaptation measure in the study area which ranks the first from the listed alternatives. The second important adaptation response towards climate change in the study area is “adjusting crop planting date” which is strongly agreed by 74% of the respondents and agreed by 26% of the respondents respectively. Selling asset during climate change difficulties is the other adaptation response of small holder farmers in sampled Kebeles. About 58% and 42% of the respondents “strongly agree” and “agree” respectively.
Similarly, the farmers tend to shift to off-farm activities during climate change difficulties for instead of crop cultivation. 40% of the respondents strongly agree, 42% agree and 18% disagree for the idea of participating in off farm activities. This shows majority of the respondents were show their strong agreement. Practicing mixed farm is replied by 33%, 38% and 29% of the respondents strongly agree, agree and disagree respectively. Tree planting is replied by 35% of the respondents strongly agree, 30% of the respondents agree, 12% of the respondents undecided and 23% of the respondents disagree respectively. The respondent’s opinion also inclined to support “tree planting” as the other adaptation response towards climate change in the study area. This is because when crop productivity decreased the farmers earn income from selling of trees to support their family life during difficulties. most respondents do not prefer irrigation, food aid and migration as adaptation response during climate change.
Crop diversification
According to findings from FGDs and KIIs, households in the study area received advice from extension agents to diversify their crops. For instance, farmers in Wera Woreda were reportedly encouraged to grow Finger millet locally known as Degussa. It is a self-pollinated, short-duration diploid legume crop with high nutritional properties, nitrogen-fixing potential, and a cash crop that pays better than cereals. Farmers in the area were also encouraged to adopt new varieties of sorghum and teff, both of which are said to be early maturing and adapted to moisture deficit conditions. Bunaye (red teff), an improved variety of teff that has good tolerance to both drought and water logging conditions and suffers relatively little from diseases and pests, has been grown by nearly half of the farmers in study area. This strategy seeks to avoid risks of total crop failure rather than maximizing yields of one particular crop. In the study area, crop diversification is widespread method of adaptation response of small holder farmers. Because some crop resists the climate change effects sufficiently than others. The previous study also confirms this finding in the same season could be associated with lower expenses and ease of farmer access (Kristiansen, 2011). Legesse B. et al. (2013) noted that crop diversification, soil and water conservation, and water harvesting practices were commonly used climate change adaptation strategies in many parts of Ethiopia.
Adjusting crop planting dates
According to FGD participants, onset and offset dates for both the main rainy season (June to September, called Kiremt) and the short rainy season (March to May, called Belg) had become highly variable in recent years, especially with remarkable delays in the onset times. Participants noted that the Belg production season had been lost, and the Kiremt rainfall had become insufficient for their agricultural production. The Belg rains are critical for Belg season production and land preparation for the main season crops (also known as Meher season). Hence, the decline in Belg rains has an impact on both Belg and Meher season production, especially long-cycle crops.
As a result of the changes in rainfall pattern, participants reported that crop planting dates had been adjusted, and land plugging frequency had been reduced. The reduction of plugging frequency often leads to increased occurrence of weeds. The timing of farmland preparation and sowing is adjusted to coincide with the arrival of sufficient rainfall. Land preparation for all Meher season crops, and planting dates for long-cycle crops like maize and soybean had been set for May from the earlier usual planting dates of April. Similarly, planting dates for teff had been shifted to late June, from its earlier usual planting date in the study area of early June. However, FGD and KII participants indicated that adjusting crop planting dates has become more challenging in recent years because the rainy season is unpredictable. Different studies also confirm the the idea of the respondents, for instance early sowing dates increase crop production compared to the base line planting dates and a delayed sowing date with rain fed or irrigation. However, early sowing dates were more effective when applied with irrigation than when applied with rain. A similar study found that early sowing dates are important for early maturing crops.
Selling asset
During the small group discussion they forward that when their crop fails, they use their asset to survive. In long term climate change seasons, the households sell their livestock, tree and land to escape from the difficulties. Sale of agricultural tools and other assets are identified as one of adaptive response to climate change and extremes in Wera Woreda of Halaba Zone. When farmers may sell some of their resources in market, and this can be an important income earning way, and can also function as a safety net and a adapting mechanism. Material assets within the household can be seen as a buffer against difficult periods, in the same way, for example, the most important asset is livestock. The previous study also confirms this finding. For instance, according to Amsalu (2009) using a household survey, about 33% in Central Ethiopia reported an increasing trend of livestock selling.
Off farm activities
As the respondents forward due to unproductive trend of their land, many farmers and their family members going to practice off-farm activities. Income from non-agricultural sources is positively associated with adaptation to climate change in the study area. This could be attributed to the fact that income from these sources may provide farmers with additional capacity to finance adaptation response. Farmer’s vulnerability to climate changes can be mitigated if the farmers have off-farm work on the side. Sale of labor was a successful adaptive strategy among farmers in the study area during unreliable rain and high temperature season. Off-farm activities can be selling honey, clothes, or home-made products like mattresses, hot food, beverages, whips, and ropes.
SUMMARY
The study aimed to investigate the impacts of climate change on crop production in Wera Woreda, Central Ethiopia. The study has three specific objectives these were: - i) To assess the impact of climate change on crop production ii) To Identify more vulnerable social groups to climate variability in the study area iii) To Investigate the response and adaptation of small holder farmers towards climate change. The sample household heads selected were 167 using systematic random sampling from the four selected sample kebeles. For this purpose, the primary data were collected through questionnaires, key informant interview, and focus Group Discussion (FGD) method. Secondary data sources; data on maize, teff, soybean, millet and pepper production (qt/ha) was collected from Wera Woreda Agricultural Office for 27 years (1995 – 2021). Monthly, seasonal and annual precipitation and temperature data for 27 years (1995- 2021) was collected from National Metrological Agency (NMA). Rainfall variability characteristics were assessed in terms of monthly, seasonal and annual rainfall totals. The data analysis shows that the average maximum and minimum temperature increased at the rate of 0.26470c and 0.32660cwhich is higher than the national average 0.180c. Annual rainfall decreased by 16.48 mm per year. The precipitation concentration index (PCI) value of Wera Woreda is about 11, showing high seasonal rainfall concentrations in certain months per decades. In addition, the long term mean monthly rainfall shows moderate coefficient of variation with CV value of 24.37%. Decline in productivity per hectare is the main impacts of climate change in the study area. The relationship between climate and the yield of major food crops is analyzed through correlation with the null hypothesis (Ho) that there is statistically significant correlation between climate element (rainfall and temperature) and yield of the five major food crops.
According to FGD participants, onset and offset dates for both the main rainy season (June to September, called Kiremt) and the short rainy season (March to May, called Belg) had become highly variable in recent years, especially with remarkable delays in the onset times. Participants noted that the Belg production season had been lost, and the Kiremt rainfall had become insufficient for their agricultural production. The Belg rains are critical for Belg season production and land preparation for the main season crops (also known as Meher season).
CONCLUSION
This study aimed at assessing the impact of climate change on crop production the case of area Wera Woreda of Halaba Zone central Ethiopia; thus, the following result have been concluded. As a result of demographic analyzes of the household shows majority (89.8%) of households who engaged in crop production are males. More than half (68.3%) of their age group is between 31 and 60. More than four fifth (86.4%) of them were married. More than four fifth (81%) of the households have 1-6 family size. Thus, this large house-hold size caused them to access cheap labor for agricultural related activities. The majority (67%) of households engaged in this activity have attended formal education. Concerning occupational status of the households more than four fifth (83.8%) engaged in crop cultivation and animal husbandry. With regard to landholding size of the households nearly half (44%) of them has land size of 0.51-1.0 hectare. This show that climate change impacts land scarcity and determines the amount of production per year in the study area. Possession of livestock asset is important at the time of climate change risk to earn income and survive, thus majority of farmers own cattle, goats and poultry in the study area. Regarding crop growing season in the study area, most (60%) respondents replied that Belg and Meher seasons are the dominant crop growing seasons. Almost all (95.8%) of the households perceived climate change and its impact on crop productivity. This refers that there the households better understand the existence of climate change in their surroundings. The analysis of temperature data from National Meteorological Agency (1995-2021) the average maximum temperature increased at the rate of 0.26470c which is higher than the national trend (0.180c). The data also revealed that the temperature shows significant variation in every five or ten year’s intervals. The annual rain fall data shows decreasing trend over the decades. According to the analyzed data, annual rainfall decreased by 16.48 mm per year. Based on the precipitation concentration index (PCI) analysis used to examine the relative distribution of the rainfall patterns, it shows high concentration with PCI value of 11. This refers that the rainfall is concentrated in certain years and the other years has low rain fall distribution. With regard to the seasonal rainfall distribution, it does not show uniform concentration. For instance, summer and winter are the two contradicting seasons in rainfall distribution per decades; (7787.2mm in summer and 3210.6mm in winter) while the other two seasons are relatively moderate rain fall season. With regard to the monthly rainfall distribution, its concentration is inclined towards June, July and August. But these months are not main crop growing month in the study area. Such rainfall and temperature variability is influencing the farmer’s crop productivity. Decrease crop production per hectare is the main impact of climate change in the study area. Decrease in the maize yield is 0.55 Quintal per year and 5.5 quintal per decade, decrease in the Teff yield is 0.68 Quintal per year and 6.8 quintal per decade, decrease the Soybean at the rate of 0.64 Quintal per year and 6.4 quintal per decade, decrease millet yield at the rate of 0.61 Quintal per year and 6.1 quintal per decade and pepper at the rate of 0.92 Quintal per year and 9.2 quintal per decade respectively. Majority (55.1%0 replied that women and young girls were more vulnerable to climate change in the study area. This is true that women and girls walk more than 2hrs for search of drinking water during none rainfall seasons; due to that girl’s dropout their school in the study area. However, the small holder farmers practice some adaptive response towards climate change impact. More than four fifth (89.9%) of the respondents had taken an adaptation response. Crop diversification, adjusting crop planting dates, selling assets, being involved in off-farm activities, and practicing mixed farming are the most adaptive response to climate change in the study area. The FGD participants also indicated that rainfall and temperature in study area have been decreasing and increasing, respectively, thus negatively affecting the production and management of crop and livestock in the study area.
During the small group discussion they forward that when their crop fails, they use their asset to survive. In long term climate change seasons, the households sell their livestock, tree and land to escape from the difficulties. Sale of agricultural tools and other assets are identified as one of adaptive response to climate change and extremes in Wera Woreda of Halaba Zone. When farmers may sell some of their resources in market, and this can be an important income earning way, and can also function as a safety net and a adapting mechanism. Material assets within the household can be seen as a buffer against difficult periods, in the same way, for example, the most important asset is livestock. The previous study also confirms this finding.
RECOMMENDATION
On the bases of the main finding of the study, the following recommendations have been drawn to reduce the impact of climate change on crop production of study area.
- Empowering peoples with education and information; youth education program should be continued that stopped before five years ago and give training on impact of climate change and its adaptation strategies in addition to modern farming and inputs utilization. Create awareness about climate change, its impact on rural livelihood and providing reliable and early warning weather information for farmers help to take appropriate copping and adaptive measures. And also build the capacity of women in all decision-making process, women’s both households headed or others should be informed and participated in governmental or social group meeting, to be aware in all aspect equal to men’s.
- The Ethiopian Government, particularly agricultural research institutes should generate and supply drought resistant and early maturing improved seed varieties that match with current climate system for smallholder farmers to adapt to adverse impact of climate change.
- The local farmers should build water harvesting, adaptive livestock breeding, fodder production on small land, selection and management system to minimize these challenges.
- The government in all level with the experts from disaster prevention and preparedness, crop and animal production offices and farmers have to integrate in the update information of weather and climate conditions and there should be recognized; well organized weather forecasting and meteorological stations.
- The local NGOs and government need to provide technical support to dig water harvesting deep ponds and open wells using as much as possible with tractor.
- The Woreda education office has to advance already started integrated adult education by giving due attention and with adequate follow up, since it increases the level of community understanding towards adopting adaptive technologies.
- Policy makers and development planners should design strategies and plans by taking into account a declining annual and seasonal rainfall and increasing temperature on rural livelihoods.
- Irrigation activities should be implemented in study area to grow some grain to support rain fed agricultural sector. Thus, the government or concerned body should give awareness and support them to enable to use irrigation system.
- The Woreda natural resource conservation office should strengthen intensive natural resource conservation and rehabilitation activities. Particularly measures that conserve the environment and at the same time can generate income to support farmers.
- The majority of sampled house-holds have large family size; this shows rapidly growing population. Therefore, the Wera Woreda health office measures against the prevailing high population growth should be targeted strongly.
- Further study should be undertaken to understand an existing causes and consequences of climate change to improve the future adaptive capacity of household.
- Access to credit is considered as one of the several factors that can affect adaptive capacity of households. Thus, to minimize the effects of CCV, the local government should facilitate long term credit service with low interest rate for landless, poor, women and young to invest in farm and off farm activities.
DECLARATION
I declare and affirm that this thesis is my own work. I have followed all ethical principles of scholarship in the preparation, data collection, data analysis and completion of this thesis. All scholarly matter that is included in the thesis has been given recognition through citation. I affirm that I have cited and referenced all sources used in this document. Every serious effort has been made to avoid any plagiarism in the preparation of this thesis. This thesis is submitted in partial fulfillment of the requirement for a degree from the Graduate Studies Directorate of Wolaita Sodo University. The thesis is deposited in the University Library and is made available to borrowers under the rules of the library. I solemnly declare that this thesis has not been submitted to any other institution anywhere for the award of any academic degree, diploma or certificate. Brief quotations from this thesis may be used without special permission provided that accurate and complete acknowledgement of the source is made. Requests for permission for extended quotations from, or reproduction of, this thesis in whole or in part may be granted by the Dean of the School or Head of Department or the Director of the Graduate Studies when in his or her judgment the proposed use of the material is in the interest of scholarship. In all other instances, however, permission must be obtained from the author of the thesis.
ACNOWLEDGEMENTS
Above all I would like to thank the Almighty God without whose support, it would have not been possible all my wishes to come in to reality. I would like to express my deepest gratitude to my advisor Dr. Addisu Damtew for his supervision, valuable guidance, and intellectual encouragement, critical and constructive comments from the early design of the proposal to the final write up of the thesis. I, really, appreciate their kind and tireless effort. My special thanks go to my all teachers at Wolaita Sodo University who taught me courses with their critical methodologies which I should practice them throughout my life. I am very much grateful to my wife Medina kedir, my friend Temesgen Makuria; Melaku Mintasinot, Mulgeta Hamamo, Melase Abakan and Teshome Elias to my daughter son Hekima Merafu for their support, encouragement, love and care during my stay in the study area and during attending class. I would like to give my sincere thanks to for his paper support and kindness, and also I want to express my deepest thanks and respect for Jemal Edao and his staff for their unlimited support includes printing of household questionnaires, to Ato Ahmed Dubach and Mohamednur Hibso for his support and all my friends who supported me in all aspects. Finally, I would like to thanks Mrs. Manano Awol, team leader of Natural resource conservation extension in Wera Woreda Agricultural development office, Hussein yasin, Halaba zone head of Agricultural officer. Mohammed has an officer in Wera woreda Administration office and Wera woreda Environmental conservation and Climate change office worker for their genuine response and support in providing necessary information, guide and assisted the data collection method from selected kebeles. I also would like to thanks all other who participated in this research process.
ACRONYMS
AC: Adaptive Capacity
CC: Climate change
CP: Crop Production
CCVL: Climate Change Variability
DA: Developmental Agent
FEWS NET: Famine early warning system Net work
FAO: Food and Agriculture Organization
FGD: Focus Group Discussion
HZAO: Halaba zone Agricultural office
HZNRCCO: Halaba zone Natural Resource conservation and climate change Office
GHG: Greenhouse gases
GDP: Gross Domestic production
IPCC: Inter-governmental panel convection Climate change
MAT: Mean Annual Temperature
MAR: Mean Annual Rain fall
MoFED: Model of Farmers and Environment
NMA: National Metrological Agency
NOAA: National Organization Adaptation Agency
NPA: National Program Adaptation
NAPA: National adaptation program assistace
SSA: Sub Saharan Africa
SNNPR: Southern Nation Nationalities and peoples region
SWC: Soil and water conservation
UNCCD: United Nation Climate change Drought
UNDP: United nation development program
UNFCCC: United Nation Climate change Convection
UNPE: United Nation Envirpmental Program
WWAO: Wera Woreda Agricultural Office
WASPO: Woreda Agricultural and Seftinate Program
REFERENCES
- Gashaw T, Mebrat W, Hagos D, Nigussie A. Climate change adaptation and mitigation measures in Ethiopia. Journal of Biology, Agriculture and Healthcare. 2014;4(15):148-52. [Crossref] [Google Scholar]
- Singh R, Devi G, Parmar D, Mishra S. Impact of rainfall and temperature on the yield of major crops in Gujarat state of India: a panel data analysis (1980-2011). Curr J Appl Sci Technol. 2017;24(5):1-9. [Crossref] [Google Scholar]
- Pachauri RK, Allen MR, Barros VR, Broome J, Cramer W, Christ R, et al. Climate change 2014: synthesis report. Contribution of Working Groups I, II and III to the fifth assessment report of the Intergovernmental Panel on Climate Change. Ipcc; 2014. [Google Scholar]
- Porter J, Xie L, Challinor AJ, Howden M, Iqbal MM, et al. Food security and food production systems. [Crossref] [Google Scholar]
- Tadesse W, Bishaw Z, Assefa S. Wheat production and breeding in Sub-Saharan Africa: Challenges and opportunities in the face of climate change. International Journal of Climate Change Strategies and Management. 2019;11(5):696-715. [Crossref] [Google Scholar]
- Thompson HE, Berrang-Ford L, Ford JD. Climate change and food security in sub-Saharan Africa: a systematic literature review. Sustainability. 2010;2(8):2719-33. [Crossref] [Google Scholar]
- Paulos Asrat PA, Belay Simane BS. Farmers' perception of climate change and adaptation strategies in the Dabus watershed, North-West Ethiopia. [Crossref] [Google Scholar]
- Ringler C, Zhu T, Cai X, Koo J, Wang D. Climate change impacts on food security in Sub-Saharan Africa: Insights from comprehensive climate change scenarios. [Google Scholar]
- ETHIOPIA O. Federal Democratic Republic of Ethiopia. Enhancing Economic Development and Job Creation in Addis Ababa: the Role of the City Administration. [Google Scholar]
- Field CB, Barros VR, editors. Climate change 2014–Impacts, adaptation and vulnerability: Regional aspects. Cambridge university press; 2014. [Google Scholar]
- Mesfin ME, Matusala BA, Teketel MI. Assessing the challenges of irrigation development in Ethiopia: a review. Int J Eng Rese. 2020;9(01):215-21. [Crossref] [Google Scholar]
- Kebede D, Adane H. Climate change adaptations and induced farming livelihoods. Dry lands Coordination Group Report No. 2011;64. [Google Scholar]
- Amdu, B. (2010). Analysis of farmers’ perception and adaptation to climate change and variability: The case of Choke Mountain, East Gojjam, Ethiopia.
- Ojwang GO, Agatsiva J, Situma C. Analysis of climate change and variability risks in the smallholder sector. 2010. [Google Scholar]
- World Bank. (2010). Economics of Adaptation to Climate Change: Ethiopia. Washington, DC: World Bank
- Central Statistical Agency (CSA). (2018). Agricultural Sample Survey 2017/18 (2010 E.C.): Volume I – Report on Area and Production of Major Crops (Private Peasant Holdings, Meher Season).
- Mohammed Y, Yimer F, Tadesse M, Tesfaye K. Variability and trends of rainfall extreme events in north east highlands of Ethiopia. Int. J. Hydrol. 2018;2(5):594-605. [Crossref] [Google Scholar]
- Abebe G. Long-term climate data description in Ethiopia. Data in brief. 201; 14:371. [Crossref] [Google Scholar] [PubMed]
- WGII I (2014). Climate Change 2014: Impacts, Adaptation, and Vulnerability: Summary for Policymakers.
- Deressa T, Hassan RM, Alemu T, Yesuf M, Ringler C. Analyzing the determinants of farmers' choice of adaptation methods and perceptions of climate change in the Nile Basin of Ethiopia. Intl Food Policy Res Inst; 2008. [Google Scholar]
- Moyo M, Mvumi BM, Kunzekweguta M, Mazvimavi K, Craufurd P, Dorward P. Farmer perceptions on climate change and variability in semi-arid Zimbabwe in relation to climatology evidence. African Crop Science Journal. 2012;20:317-35. [Google Scholar]
- Abebe E (2013). Impact of climate Variability and change on food security and local adaptation strategies in Arsi-Negel Woreda central rift valley, Ethiopia.
- Pettengell C. Climate Change Adaptation: Enabling people living in poverty to adapt. [Google Scholar]
- Kassie BT, Rötter RP, Hengsdijk H, Asseng S, Van Ittersum MK, Kahiluoto H, et al. Climate variability and change in the Central Rift Valley of Ethiopia: challenges for rainfed crop production. The Journal of Agricultural Science. 2014;152(1):58-74. [Crossref] [Google Scholar]
- Juroszek P, von Tiedemann A. Climate change and potential future risks through wheat diseases: a review. European Journal of Plant Pathology. 2013;136(1):21-33. [Crossref] [Google Scholar]
- Tessema YA, & Simane B (2019). Vulnerability analysis of smallholder farmers to climate variability and change in Ethiopia.
- Berck CS, Berck P, Di Falco S. Agricultural adaptation to climate change in Africa. TAYLOR & FRANCIS Limited; 2018. [Google Scholar]
- Senbeta AF, Olsson JA. Climate change impact on livelihood, vulnerability and coping mechanisms: A case study of West-Arsi Zone, Ethiopia. Lund University, Lund. 2009 May;54. [Google Scholar]
- Bennett (2017). Deforestation happens all over the world and the vast majority of deforestation takes place in rainforest around the globe, mostly concentrated in the tropics. Vol. 7(1); pp. 43 – 53-74.
- Intergovernmental Panel on Climate Change. (2012). Managing the Risks of Extreme Events and Disasters to Advance Climate Change Adaptation (SREX). Cambridge University Press.
- Ngigi SN. Climate change adaptation strategies: water resources management options for smallholder farming systems in sub-Saharan Africa. New York, NY: The Earth Institute at Columbia University; 2009. [Crossref] [Google Scholar]
- Legesse B, Ayele Y, Bewket W. Smallholder farmers’ perceptions and adaptation to climate variability and climate change in Doba district, west Hararghe, Ethiopia. Asian Journal of Empirical Research. 2013;3(3):251-65. [Crossref] [Google Scholar]
- Mesfin W, Fufa B, Haji J. Pattern, trend and determinants of crop diversification: empirical evidence from smallholders in eastern Ethiopia. Journal of Economics and Sustainable Development. 2011;2(8):78-89. [Google Scholar]
- Dadi Dk, Alemayehu Y, Getnet M. Analyses and Evaluation of Management Options for Adapting Maize (Zea Mays L.) To Climate Variability and Change in Ethiopia. [Google Scholar]
- Wagesho N, Yohannes E. Analysis of rainfall variability and farmers’ perception towards it in agrarian community of Southern Ethiopia. Journal of Environment and Earth Science. 2016;6(4):99-107. [Google Scholar]
- Yibrah M, Dandesa T, Sego B, Kebebe B. Analyzing Preciptation at Quiha District, Southeastern, Tigray, Ethiopia. International Journal of Research. 2018;4:22-6. [Google Scholar]
- Yibrah M, Korecha D, Dandesa T. Characterization of rainfall and temperature variability to guide wheat (Triticum Aestivum) and barley (Horduem Vulgare) production in Enderta district, south eastern Tigray, Ethiopia. International Journal of Research in Environmental Science. 2018;4(2):35-41. [Google Scholar]
- Zerga B, Gebeyehu G. Climate change in Ethiopia variability, impact, mitigation, and adaptation. IJRDO-Journal of Social Science and Humanities Research. 2016 Apr 30;1(4):66-83. [Google Scholar]
- Smit B, Pilifosova O. Adaptation to climate change in the context of sustainable development and equity. Sustainable Development. 2003;8(9):9. [Google Scholar]
- Mcsweeney C, New M, Lizcano G, Lu X. The UNDP Climate Change Country Profiles: Improving the accessibility of observed and projected climate information for studies of climate change in developing countries. Bulletin of the American Meteorological society. 2010;91(2):157-66. [Google Scholar]
- Nhemachena C, Hassan R. Micro-level analysis of farmers adaption to climate change in Southern Africa. Intl Food Policy Res Inst; 2007. [Google Scholar]
- Deressa TT, Hassan RM. Economic impact of climate change on crop production in Ethiopia: evidence from cross-section measures. Journal of African economies. 2009 Aug 1;18(4):529-54. [Crossref] [Google Scholar]
Article Processing Timeline
| 2-5 Days | Initial Quality & Plagiarism Check |
| 25-35 Days |
Peer Review Feedback |
| 45-60 Days | Total article processing time |
Why Publish with us?
Ethics & Policies
Editorial & Management
Useful Links
Journal Highlights
Open Access Journals
Membership
Journal Flyer