ABSTRACT
Background
Porcelain aorta (PA) presents a major technical challenge in cardiovascular surgery due to the risks associated with aortic cross-clamping. Both open and endovascular surgical approaches have been utilized to manage this condition, yet comparative outcome data remain limited and fragmented.
Objective
This systematic review and meta-analysis aimed to evaluate perioperative and mid-term outcomes of open and endovascular strategies in patients with coexisting porcelain aorta and to summarize the available evidence regarding these treatment approaches.
Methods
A comprehensive literature search identified 350 studies, of which 20 met the inclusion criteria, encompassing 1249 patients. Among them, 385 underwent open surgery and 864 received endovascular interventions. The primary outcomes analyzed included 30-day mortality, stroke, bleeding, and other complication rates. Secondary outcomes comprised ICU stay duration, technical success, 1- and 5-year survival, and re-intervention rates. Sensitivity analyses and publication bias assessments were conducted. Study quality was appraised using the ROBINS-I v2 tool and the Joanna Briggs Institute (JBI) checklists.
Results
The pooled 30-day mortality rate was 3.1% (95% CI: 0.7%–6.7%) in studies of open surgery and 5.4% (95% CI: 2.7%–8.9%) in studies of endovascular procedures. The pooled complication rate, excluding stroke and bleeding, was 26.3% (95% CI: 13.3%–41.4%) and 40.4% (95% CI: 27.0%–54.5%), respectively. Stroke and bleeding rates were similar across both groups. ICU stay was longer in studies of open surgery, while technical success rates were high in both approaches. One-year survival estimates were comparable, whereas long-term survival data remained limited. Re-intervention rates were low in both groups. A single study evaluating hybrid approaches reported favorable short-term outcomes. Sensitivity analyses identified studies contributing to heterogeneity, and publication bias was detected in selected outcomes.
Conclusion
Both open and endovascular strategies for the management of porcelain aorta demonstrated acceptable outcomes in separate single-arm meta-analyses. However, because pooled estimates were derived from non-comparative analyses and substantial clinical heterogeneity and selection bias were present across studies, no conclusions regarding the superiority of one approach over the other can be drawn. Hybrid approaches appear promising but remain supported by limited evidence. Treatment decisions should be individualized based on patient characteristics, anatomical considerations, and surgical expertise.
Keywords: Porcelain Aorta; Hostile Aorta; Endovascular; Surgical; SRMA; Single Arm Meta-Analysis; Outcomes
INTRODUCTION
Porcelain aorta (PA), characterized by severe circumferential calcification of the ascending aorta and arch, presents formidable challenges in cardiac surgery. This extensive calcification renders aortic cross-clamping hazardous during open procedures, restricts cannulation opti ons, and significantly elevates embolic risk during surgical aortic valve replacement (SAVR) [1,2,3]. These technical limitations have established PA as a relative contraindication to conventional SAVR in patients with severe aortic stenosis (AS), highlighting the urgent need for alternative strategies [4].
While hybrid procedures such as transcatheter aortic valve implantation (TAVI) combined with off-pump coronary artery bypass grafting (OPCAB) have been described in selected high-risk patients, this analysis focuses on comparing standalone open SAVR and endovascular approaches. Current guidelines from the European Society of Cardiology and the European Association for Cardio-Thoracic Surgery recommend TAVI over SAVR in AS patients with PA, citing TAVI’s ability to avoid aortic manipulation and its proven feasibility in high-risk cases [5,6,7,8,9]. Similarly, transcatheter aortic valve replacement (TAVR) has gained traction as a viable alternative [9,10]. While large-scale studies have established benchmarks for SAVR outcomes across risk strata, comparable multicenter data for endovascular approaches in porcelain aorta patients remain limited [11].
This systematic review and meta-analysis aim to address these evidence gaps by: evaluating perioperative outcomes of open and endovascular strategies including mortality, stroke, and aortic injury rates between open SAVR and endovascular TAVI/TAVR; evaluating secondary endpoints such as ICU stay duration, reintervention rates, and quality-of-life outcomes; and identifying patient-specific and procedural factors that may influence outcomes.
Through this rigorous analysis, we aim to provide evidence-based guidance for clinical decision-making in this high-risk population and to highlight key areas for future research.
MATERIALS AND METHODS
This meta-analysis was conducted following the Preferred Reporting Items for Systematic Reviews and Meta-Analyses (PRISMA) 2020 guidelines. The protocol is registered on PROSPERO under the ID number CRD420251040976 and can be accessed at:
https://www.crd.york.ac.uk/PROSPERO/view/CRD420251040976
Research Strategy
A comprehensive electronic literature search was performed on April 20, 2025, using Embase, PubMed, and Scopus. The search terms included: (“Porcelain aorta” OR “severe calcified ascending aorta” OR “heavily calcified aorta”) AND (“transcatheter” OR “endovascular” OR “open surgery” OR “sternotomy” OR “hybrid approach” OR “combined surgical and endovascular”) AND (“outcomes” OR “mortality” OR “postoperative complications” OR “stroke” OR “perioperative results” OR “survival”). The PRISMA flow diagram illustrating the study selection process is presented in Figure 1.
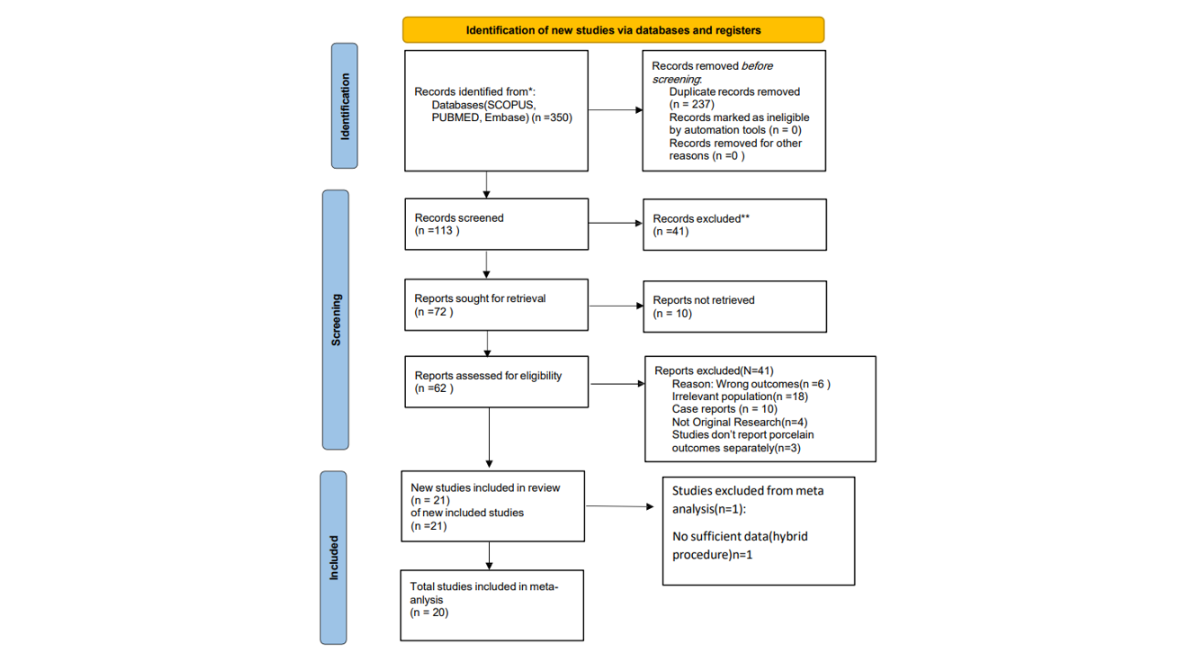
Figure 1: PRISMA Flow Diagram
Data Extraction and Quality Assessment
Studies were selected by two independent reviewers according to the inclusion and exclusion criteria. Any disagreement was resolved through group discussion and consensus. The following data were extracted from each study: first author name, year, journal, study design, country, type of operation (e.g., CABG, valve replacement), operative indications (e.g., stenosis, regurgitation, CAD), presence of concomitant procedures (%), sample sizes for hybrid, endovascular, and open groups, study duration, follow-up duration, patient age (mean), sex (% male), comorbidities (n, %), NYHA class (mean), logistic EuroSCORE (mean), porcelain aorta classification (IA, IB, II), and calcium distribution pattern. Details on diagnostic imaging, modifications to avoid aortic cannulation and clamping, access sites (transcatheter and surgical), arterial cannulation techniques, and aortic clamping approaches were also collected. Intraoperative variables such as cardiopulmonary bypass time, aortic clamp time, and cerebral perfusion time were included.
Postoperative outcomes were extracted, including 30-day mortality, stroke rate, incidence of aortic rupture, and other complications (n, %). Additional outcomes included ICU stay duration, procedural success rate, reintervention rate, and 5-year survival. If a study reported results for a broader patient population but presented a separate subgroup analysis for porcelain aorta patients, only the latter data were extracted and analyzed.
Statistical analysis and interpretation
Data analysis was conducted according to the guidelines of Cochrane Handbook for Systematic Reviews of Interventions [12]. values of primary and secondary outcomes were calculated and expressed as proportions or mean difference with 95% confidence intervals in a single arm meta-analysis. Freeman-Tukey variant of the arcsine square root transformed proportion and Der Simonian-Laird weights of random effects model were used to express proportions and mean difference as pooled percentage proportions and mean difference. Chi2 and I2 tests were conducted for heterogeneity. Meta- analysis was conducted using open meta [analyst] software and metaanalisisonline.com webpage [13]. Sensitivity analyses were done to detect any high risk or biased studies. Funnel plots and Egger's tests were done to detect possible publication bias among included studies.
RESULTS
Study Characteristics
A total of 350 studies were identified through database searches. After the removal of duplicates and screening by title, abstract, and full text, 77 studies remained. Of these, 10 could not be retrieved. Following the eligibility assessment of the remaining 67 studies, 21 were deemed suitable; however, one hybrid study was excluded from the meta-analysis. Consequently, 20 studies were included in the final systematic review and meta-analysis, encompassing a total of 1249 patients. Of these, 385 patients underwent open surgery for the management of porcelain aorta, while 864 underwent endovascular procedures. Detailed patient characteristics are provided in Table S1(Supplementary).
|
Study |
Year |
Country |
PA patients number |
Age in years (MN ± SD) mean ± SD) |
Male % |
Key Comorbidities (examples) |
NYHA III–IV (%) |
Logistics EuroSCORE% |
Porcelain-Aorta Type |
Imaging |
|
|
Abe et al.[23] |
2010 |
Japan |
4 |
73.4 |
25 |
NA |
100 |
NA |
NA |
NA |
|
|
Asami et al.[24] |
2022 |
Switzerland |
114 |
79.4 ± 7.4 |
52.6 |
DM 35.1% |
73.7 |
23.5 ± 16.3 |
NA |
||
|
CAD 77% |
|||||||||||
|
CKD 60.5% |
|||||||||||
|
Buz et al.[25] |
2011 |
Germany |
16 |
77.4 ± 10.3 |
32.6 |
PVD 60.8% |
37 |
45 ± 22 |
Grade 4: circumferential; Grade 3: severe but non-circumferential |
CT, TEE. Echo |
|
|
CAD 59% |
|||||||||||
|
AF 39% |
|||||||||||
|
Campanella et al.[18] |
2025 |
Germany/ USA |
161 |
77.2 |
66.5 |
NA |
11.6 |
Non-circular vs circular |
Multi-slice CT |
||
|
PAD 22% |
|||||||||||
|
CAD 18% |
|||||||||||
|
Prior PCI 32.9% COPD 13% |
|||||||||||
|
Chang et al.[15] |
2017 |
South Korea |
32 |
74 ± 7 |
66 |
HTN 75% |
28 |
21.4 ± 19.0 |
Extensive circumferential of ascending aorta |
CT + epiaortic |
|
|
US |
|||||||||||
|
DM 53% |
|||||||||||
|
CKD 16% |
|||||||||||
|
AF 22% |
|||||||||||
|
De Paulis et al.[26] |
2009 |
Italy |
3 |
75 |
100 |
NA |
NA |
NA |
severe ascending aortic calcification |
Echo, Angio, CT |
|
|
Del-Val et al.[18] |
2018 |
USA |
184 |
TAVI: 77.5 ± 10.3 |
TAVI: 36.5 SAVR: 34.6 |
CAD: TAVI 57.7%, SAVR 65.4% |
TAVI 43 (82.7%) SAVR 36 (69.2%) |
NA |
Diffuse circumferential calcification of the ascending aorta |
CT, epiaortic |
|
|
SAVR: 78.8 ± 6.3 |
CKD: TAVI 28.8%, SAVR 13.5% |
US |
|||||||||
|
PVD: TAVI 30.8%, SAVR 40.4% |
|||||||||||
|
DM: TAVI 36.5%, SAVR 38.5% |
|||||||||||
|
Hartert et al.[27] |
2018 |
Germany |
42 |
AVR: 81.3 ± 6.4 |
AVR: 42.4 MVR: 55.6 |
CAD 64.3% |
AVR = 81.8 |
AVR: 29.2 ± 16.5; MVR: 28.4 ± 14.1% |
Circumferential entire ascending aorta |
CT, TEE |
|
|
MVR: 80.3 ± 5.7 |
COPD 50% |
MVR = 100 |
|||||||||
|
DM 38.1% |
|||||||||||
|
Kempfert et al.[28] |
2010 |
Germany |
29 |
79 ± 7.8 |
34.5 |
Renal failure 58.6% |
NA |
37.7 ± 18.1 |
Entire ascending aorta |
CT, chest X-ray |
|
|
COPD 62.1% |
cardiac cath |
||||||||||
|
Carotid stenosis 34.5% |
epiaortic echo |
||||||||||
|
Kramer et al.[14] |
2023 |
USA |
164 |
77 (7.7)* |
SAVR 48 |
HTN 86% |
NA |
NA |
NA |
3D CT |
|
|
TAVR 41 |
COPD 38% |
||||||||||
|
PAD 41% |
|||||||||||
|
Lauten et al.[29] |
2025 |
Germany |
141 |
78.2 |
57.4 |
74.1 |
9.4 ± 10.4 |
Ascending aorta to arch, Partial (78.7%), Circular (21.3%) |
Non-contrast |
||
|
HTN 82.3% |
axial CT |
||||||||||
|
DM 46.8% |
|||||||||||
|
PAD 9.9% |
|||||||||||
|
COPD 11.3% |
|||||||||||
|
AF 31.2% |
|||||||||||
|
CAD 60.3% |
|||||||||||
|
Leyh et al.[30] |
1999 |
Germany |
23 |
71.6 ± 6.8 |
73.91 |
DM 57% |
NA |
NA |
circumferential calcification of the entire ascending aorta and proximal aortic arch |
Chest X-ray |
|
|
PVD 52% |
Cine-angio |
||||||||||
|
prior MI 35% |
|||||||||||
|
prior CVA 9% |
|||||||||||
|
Nakasu et al.[31] |
2018 |
USA |
36 |
81 (70-84)* |
58 |
PAD 81% |
89 |
NA |
Extensive circumferential calcification |
CT, TEE, Echo |
|
|
Diabetes 25% |
|||||||||||
|
Nishi et al.[32] |
2010 |
Japan |
11 |
70.2 ± 6.2 |
54.5 |
HTN 64% |
≈ 64 |
NA |
NA |
Non-contrast CT |
|
|
DM 27% |
|||||||||||
|
CKD 45% |
|||||||||||
|
Dialysis 36% |
|||||||||||
|
Salem et al.[16] |
2019 |
Germany |
74 |
73 ± 7 |
71.6 |
Diabetes 41.8% |
NA |
9.1 (6.3–11.6)* |
Entire ascending aorta |
Non-contrast CT, X-ray, angio |
|
|
PVD 41.8% |
|||||||||||
|
HTN 79.7% |
|||||||||||
|
Sasajima et al.[33] |
2002 |
Japan |
9 |
66.3 ± 9.2 |
88.89 |
Diabetes |
NA |
NA |
NA |
CT |
|
|
dialysis (DM/ GN/ PKD) |
|||||||||||
|
Sirin et al[17]. |
HTN 66.7% |
Chest x-ray, CT |
|||||||||
|
DM 55.6% |
|||||||||||
|
PAD 33.3% |
|||||||||||
|
COPD 33.3% |
|||||||||||
|
CAD 77.8% |
Supplementary Table 1: Shows Patients Demographics and Characteristics in Included Studies
Note: Data Reported In Median & IQR / HTN= Hypertension, DM= Diabetes Mellitus, PVD: Peripheral Vascular Disease, PAD= Peripheral Artery Disease, MI: Myocardial Infarction, CVA: Cerebrovascular Accidents, COPD= Chronic Obstructive Pulmonary Disease, CKD= Chronic Kidney Disease, CAD= Coronary Artery Disease, GN= Glomerulonephritis, PKD= Polycystic Kidney Disease, AF: Atrial Fibrillation, SAVR: Surgical Aortic Valve Replacement, TAVI: Transcatheter Aortic Valve Implantation, CABG: Coronary Artery Bypass Graft, AVR= Aortic Valve Replacement, MVR: Mitral Valve Replacement, TA: Transapical, TA: Transaortic, CT: Computed Tomography, US: Ultrasound, ECHO: Echocardiography, Angio: Angiography
Primary Outcomes
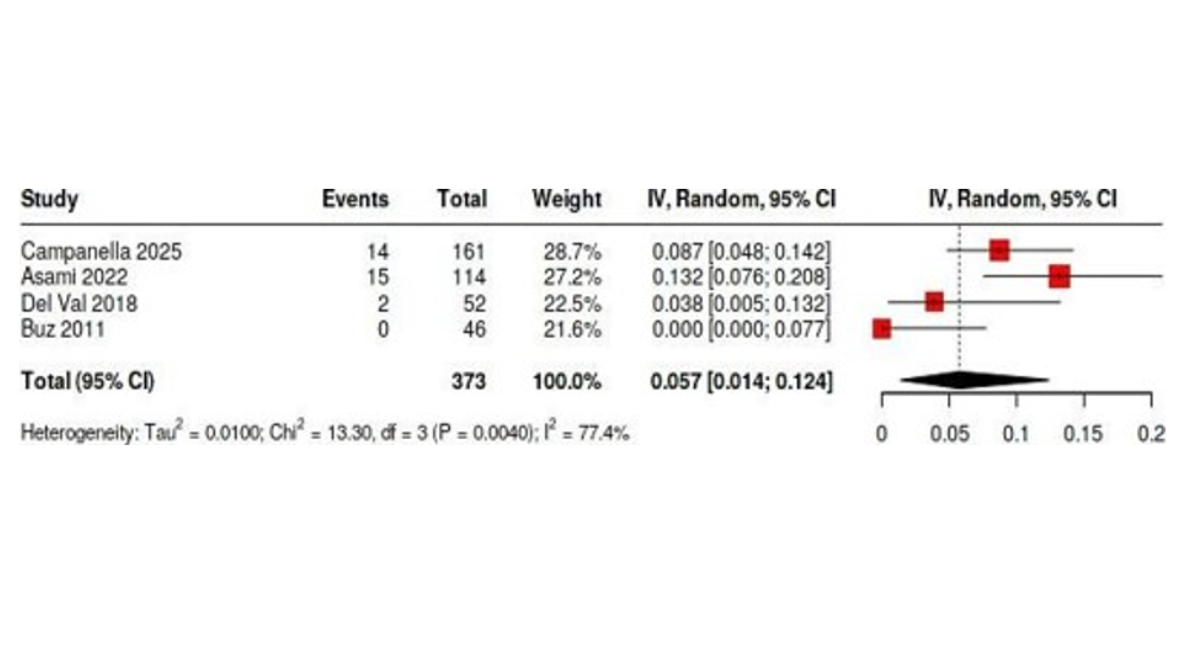
The pooled 30-day mortality rate for patients who underwent open surgery was 3.1% (95% CI: 0.7%–6.7%), compared to 5.4% (95% CI: 2.7%–8.9%) in the endovascular cohort. The pooled complication rate, excluding bleeding and stroke, was 26.3% (95% CI: 13.3%–41.4%) in the open surgery group, while it reached 40.4% (95% CI: 27%–54.5%) in the endovascular group. Stroke rates were similar between both cohorts, with the open surgery group having a rate of 3.7% (95% CI: 1.5%–6.5%) and the endovascular group 3.5% (95% CI: 2.2%–4.9%). Likewise, pooled bleeding rates were comparable, at 4.5% (95% CI: 0.5%–10.9%) in the open group and 5.7% (95% CI: 1.4%–12.4%) in the endovascular group. (Figure 2-9).
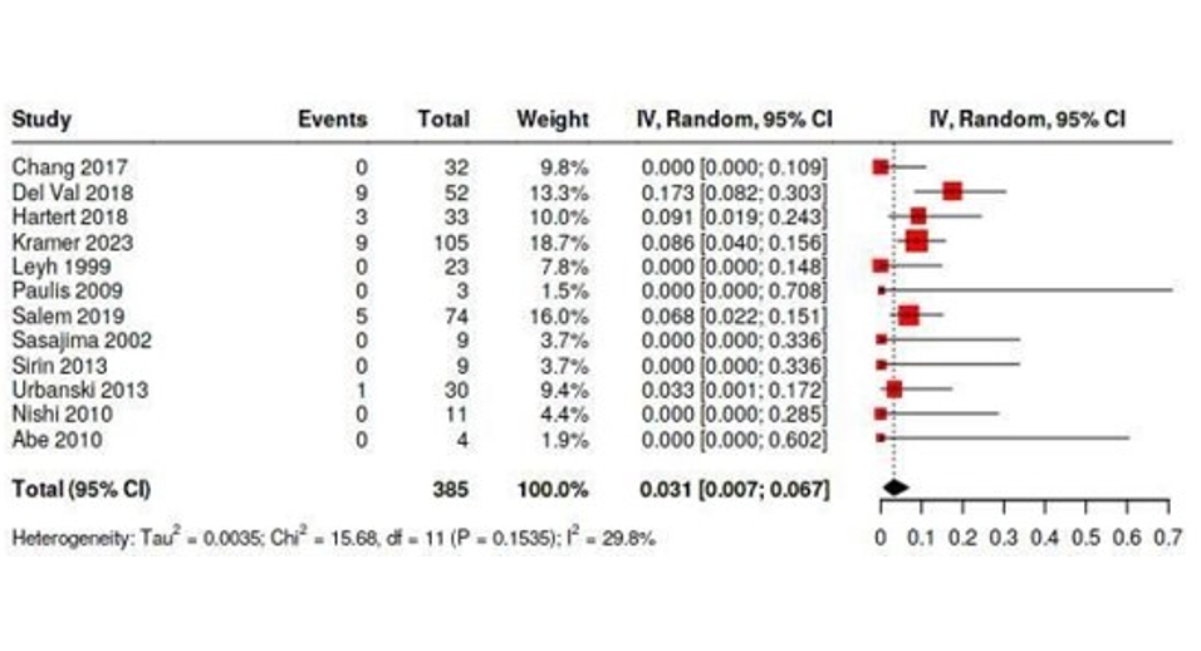
Figure 2: Forest Plot Shows Pooled 30-Day Mortality Rate for Open Surgery Cohort
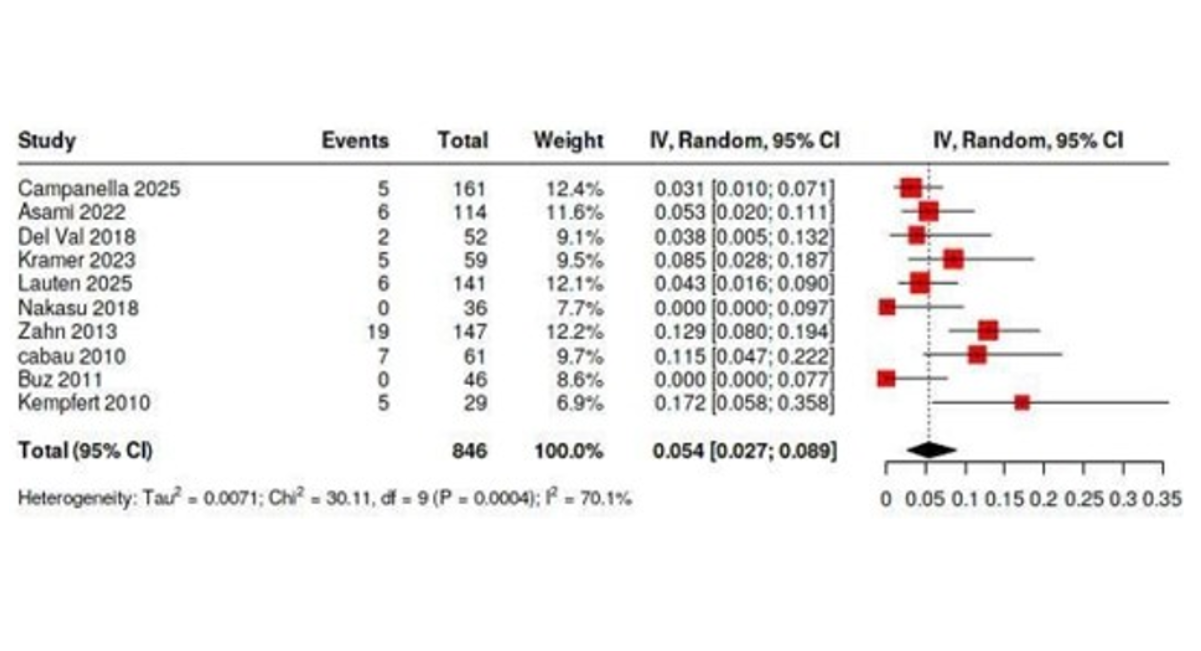
Figure 3: Forest Plot Shows Pooled 30-Day Mortality Rate for Endovascular Procedure Cohort
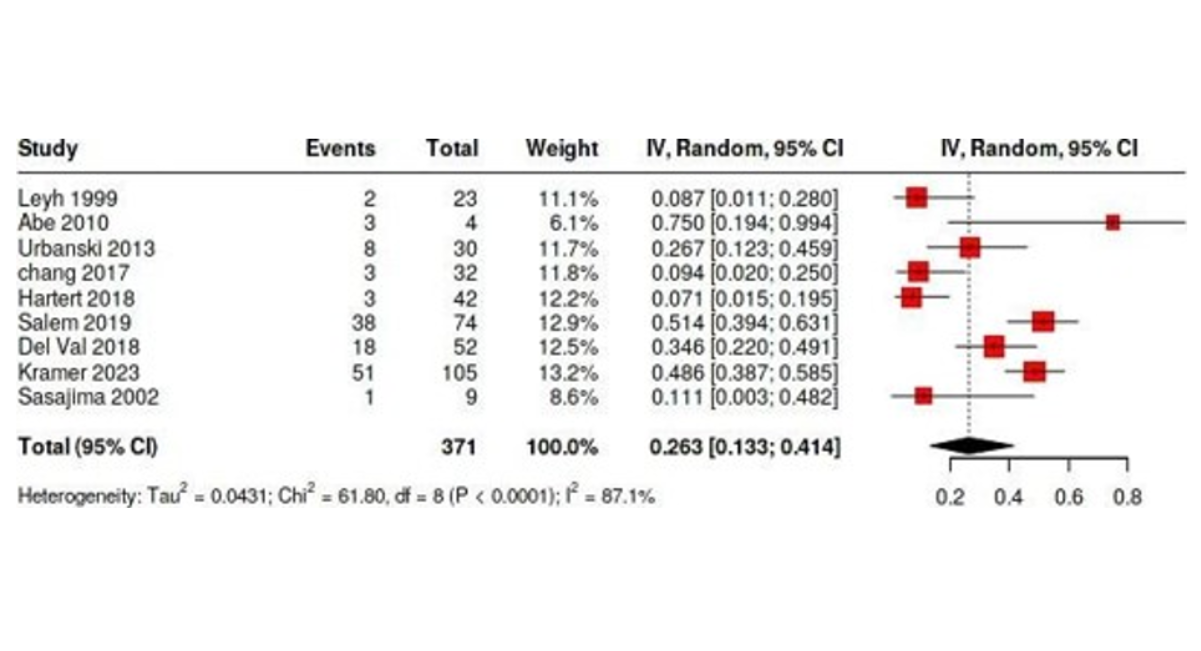
Figure 4: Forest Plot Shows the Pooled Rate of All Complications (Excluding Bleeding or Stroke) In the Open Surgery Cohort
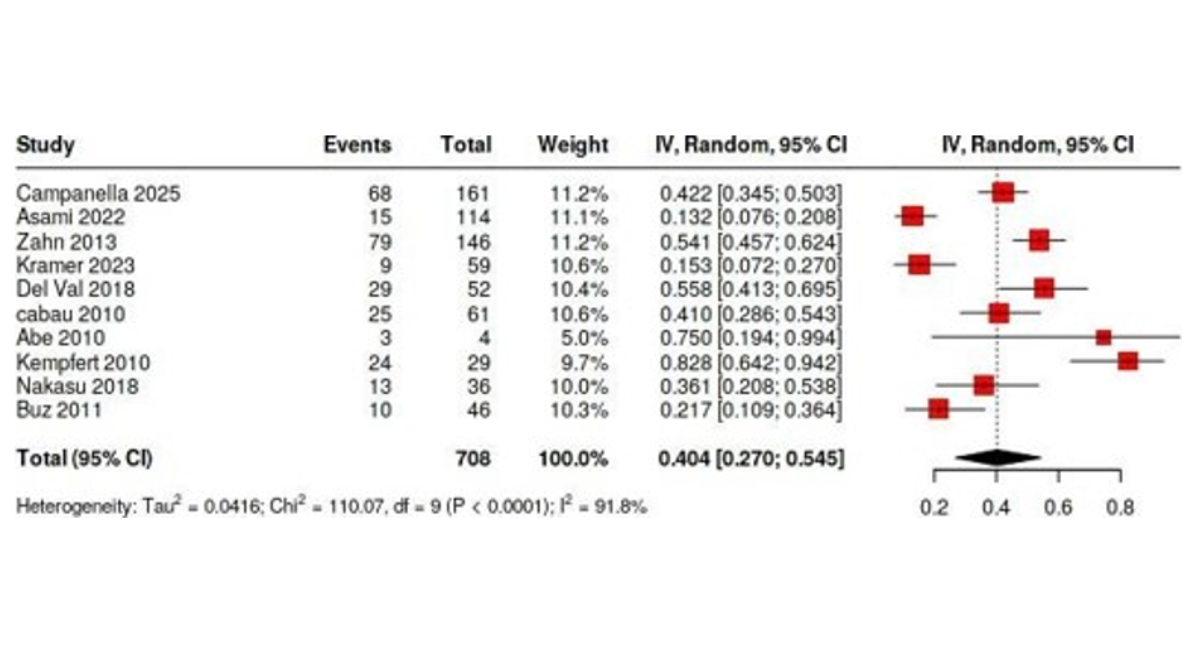
Figure 5: Forest Plot Shows the Pooled All Complications Rate (Other Than Bleeding or Stroke) In the Endovascular Procedure Cohort
Figure 6: Forest Plot Shows Pooled Stroke Rate in Open Surgery Cohort
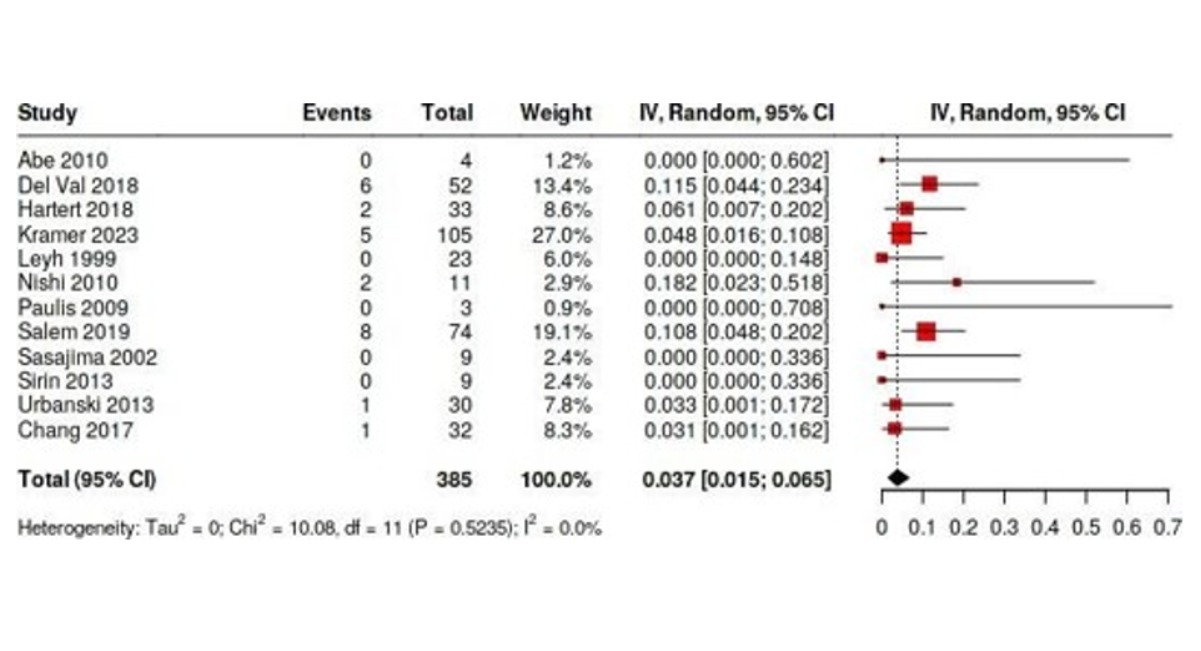
Figure 7: Forest Plot Shows Pooled Stroke Rate in Endovascular Surgery Cohort
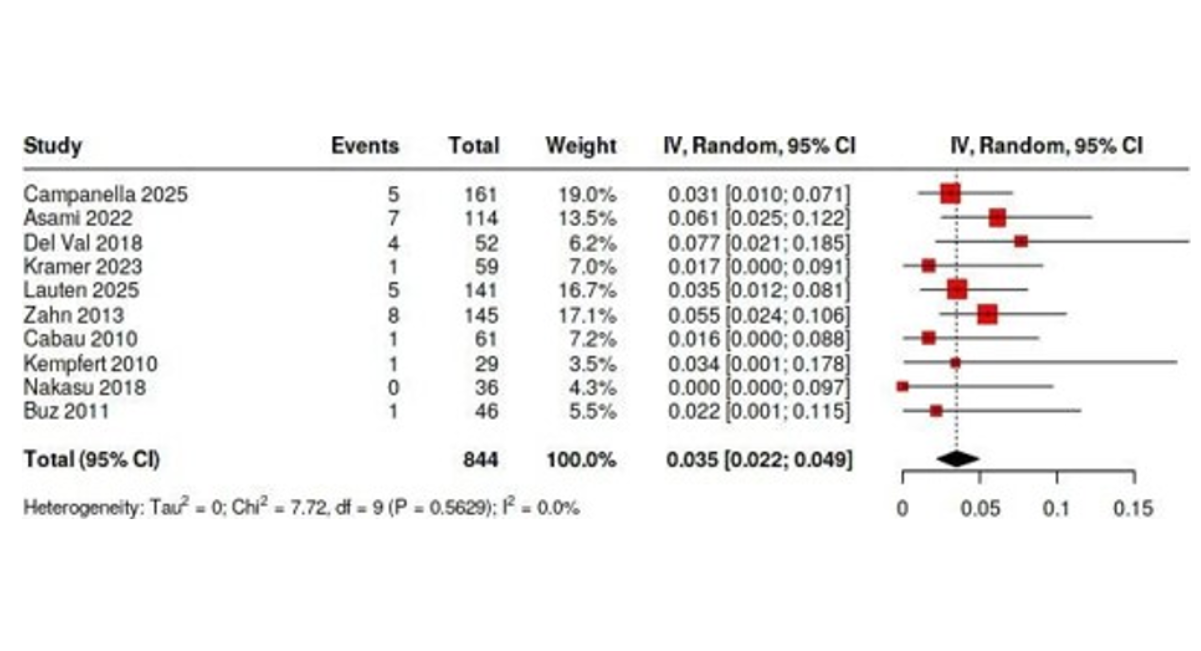
Figure 8: Forest Plot Shows Pooled Bleeding Rate in Open Surgery Cohort
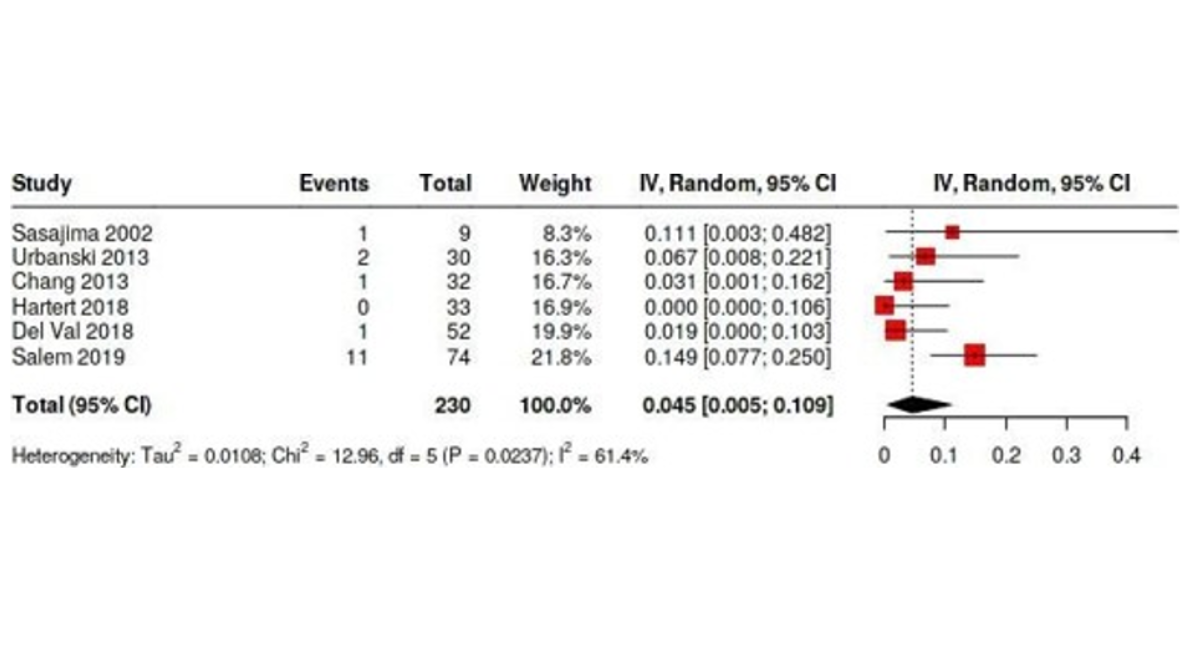
Figure 9: Forest Plot Shows Pooled Bleeding Rate in Endovascular Surgery Cohort
Secondary Outcomes
The pooled estimated mean duration of ICU stay was longer in the open surgery group at 109.0 hours (95% CI: 81.6–136.4), compared to 60.2 hours (95% CI: 44.8–75.5) in the endovascular group. The technical success rate in the open surgery group was 100% (95% CI: 99.8%–100%), whereas it was slightly lower in the endovascular group at 93.8% (95% CI: 88.2%–97.8%). Data on survival were limited and inconsistently reported across studies. However, the pooled estimated 1-year survival rate based on three studies for each group was 79.5% (95% CI: 59.1%–94.4%) for the open surgery cohort and 82.8% (95% CI: 76.4%–88.5%) for the endovascular cohort. Regarding 5-year survival, only three studies for the open cohort reported data, yielding an estimated pooled survival rate of 75.9% (95% CI: 52.6%–93.3%). While sufficient 5-year survival data for the endovascular group were lacking, one comparative study by Kramer reported a 5-year survival rate of 56% for open surgery versus 82% for endovascular procedures [14]. The pooled re-intervention rate was higher in the open group at 3.9% (95% CI: 0.4%–9.7%) compared to 1.3% (95% CI: 0%–7.3%) in the endovascular group, although data for the latter were limited (Figure 10-18).
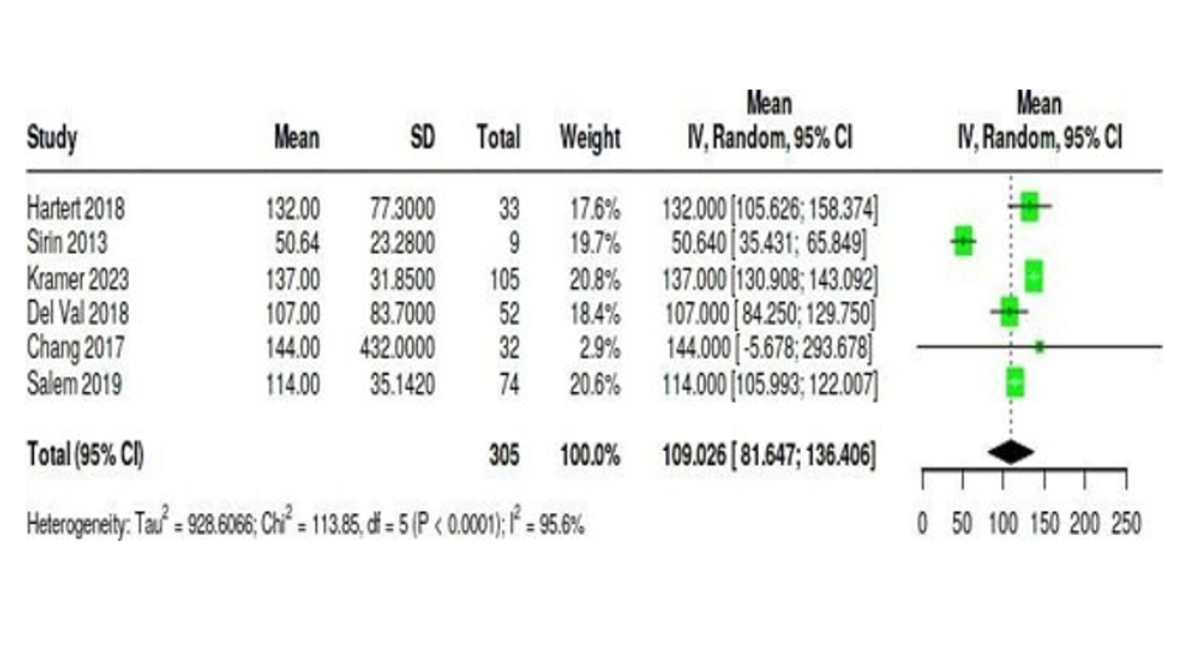
Figure 10: Forest Plot Shows Pooled Estimated Mean of ICU Stay in Hours for Open Surgery Cohort
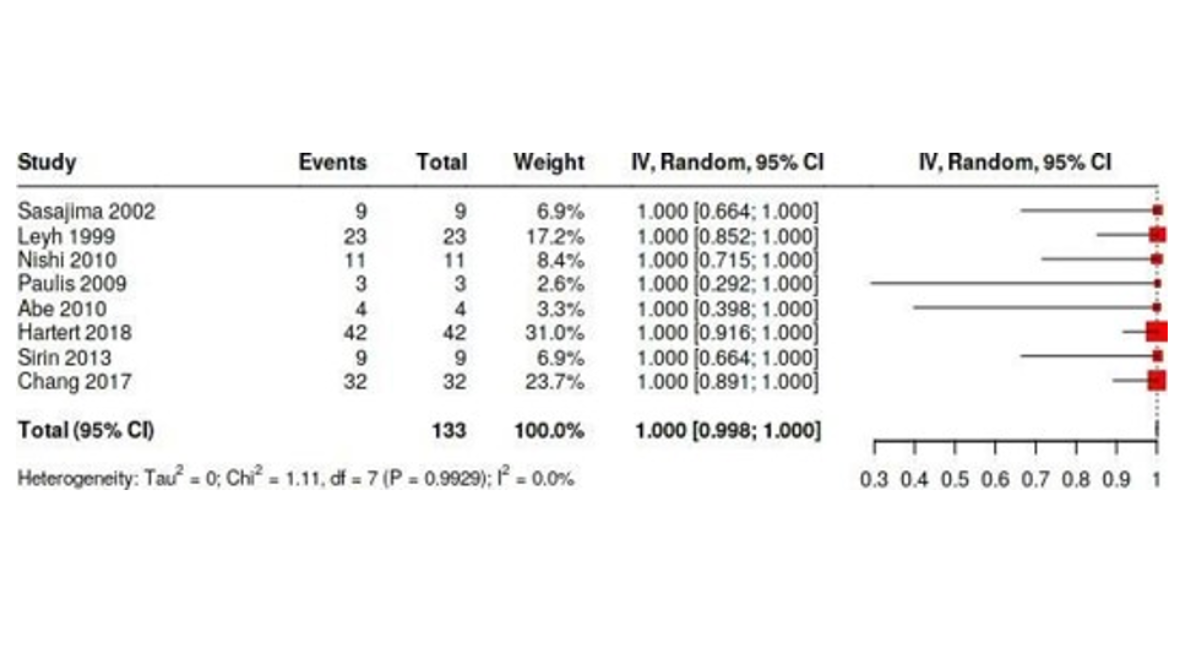
Figure 11: Forest Plot Shows Pooled Success Rate for The Open Surgery Cohort
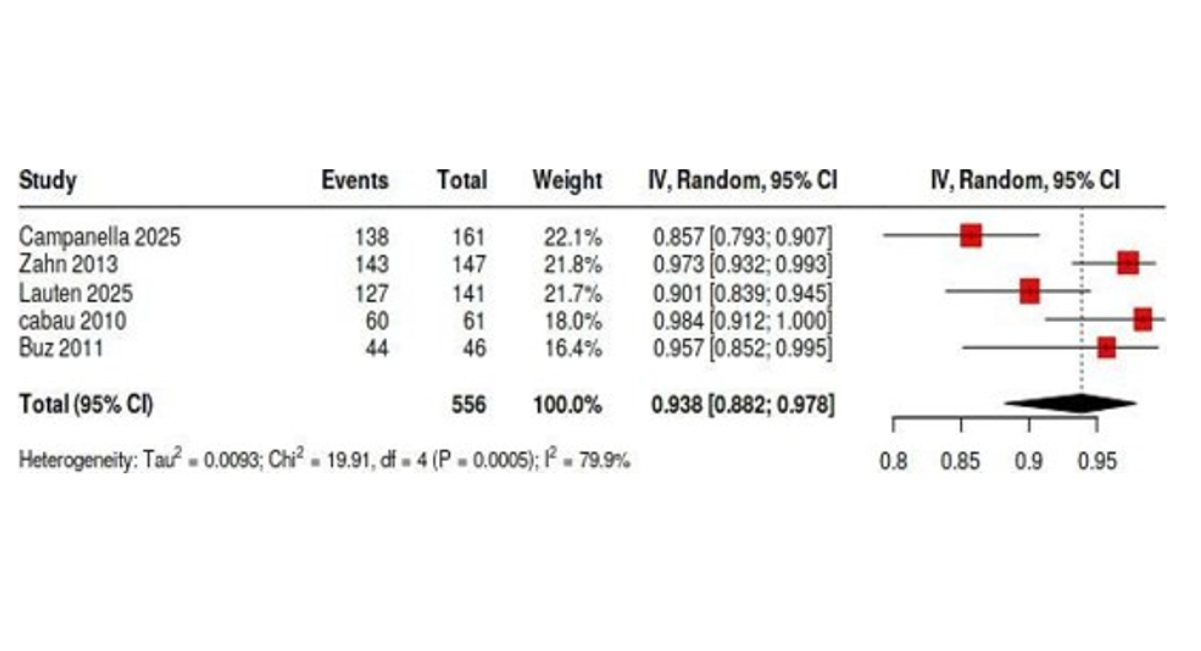
Figure 12: Forest Plot Shows Pooled Success Rate for Endovascular Surgery Cohort
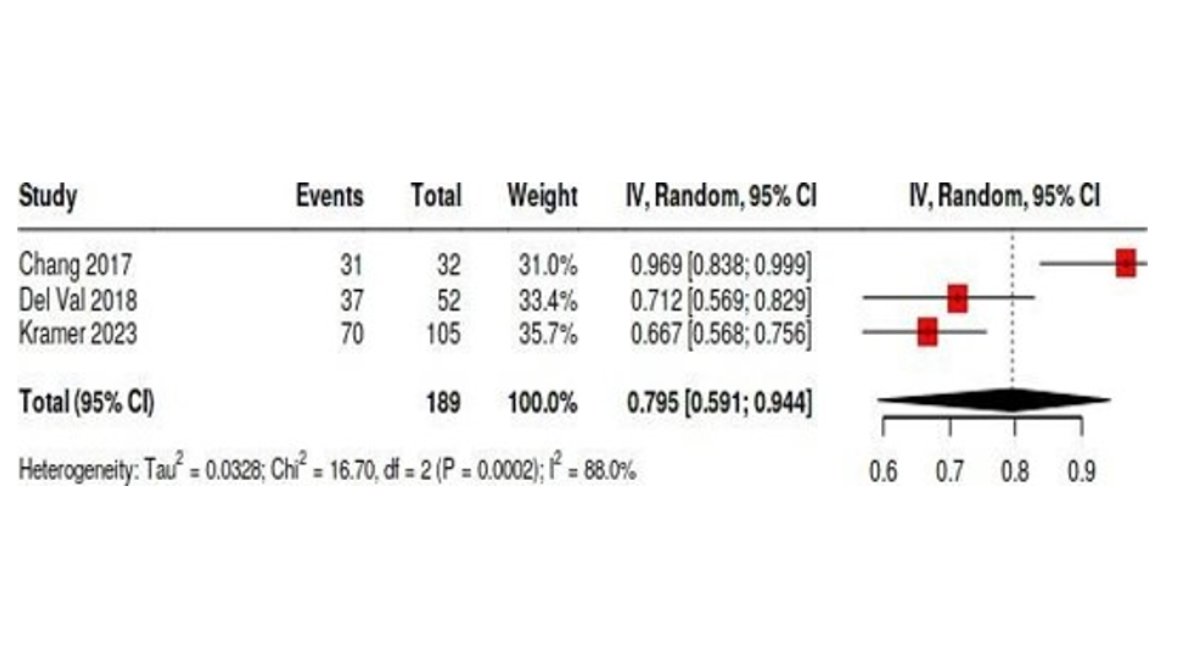
Figure 13: Forest Plot Shows the Pooled Estimated Available 1-Year Survival Rates in The Open Surgery Cohort
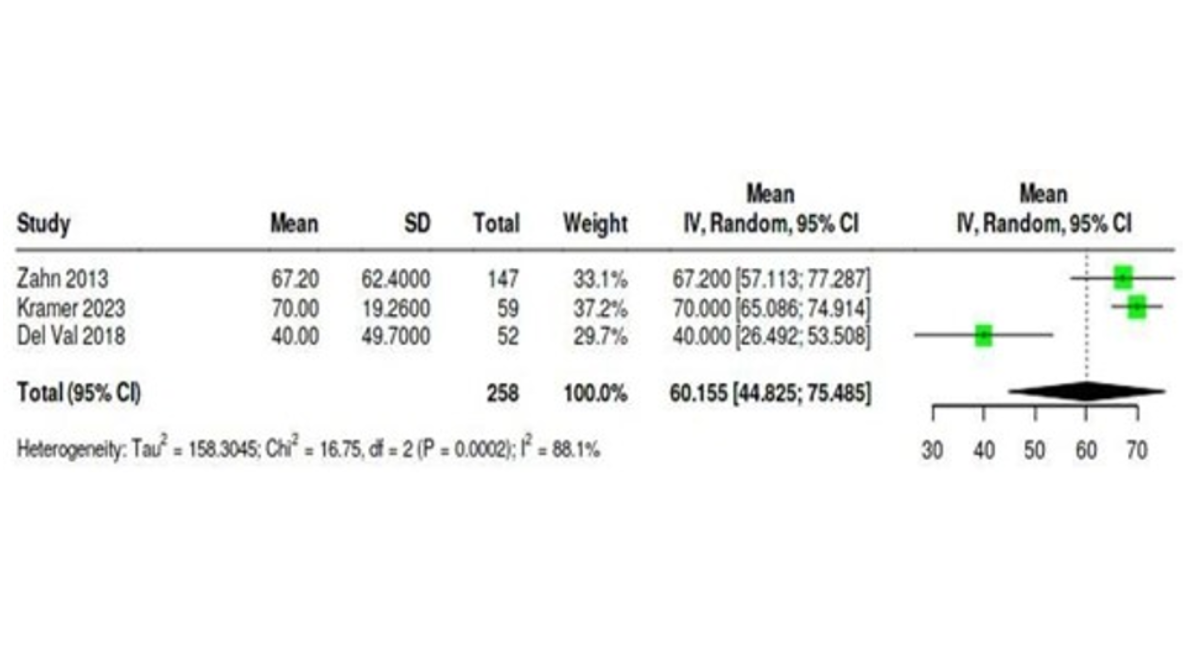
Figure 14: Forest Plot Shows Pooled Estimated Mean of ICU Stay in Hours for The Endovascular Surgery Cohort
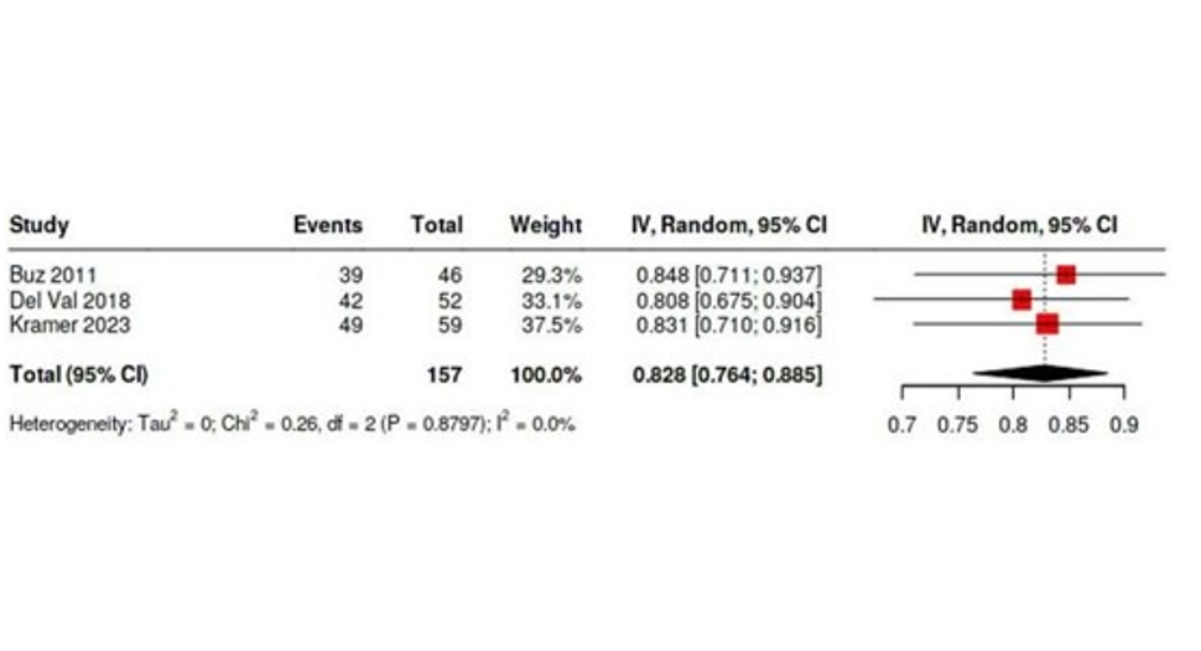
Figure 15: Forest Plot Shows the Pooled Estimated Available 1-Year Survival Rates in the Endovascular Surgery Cohort
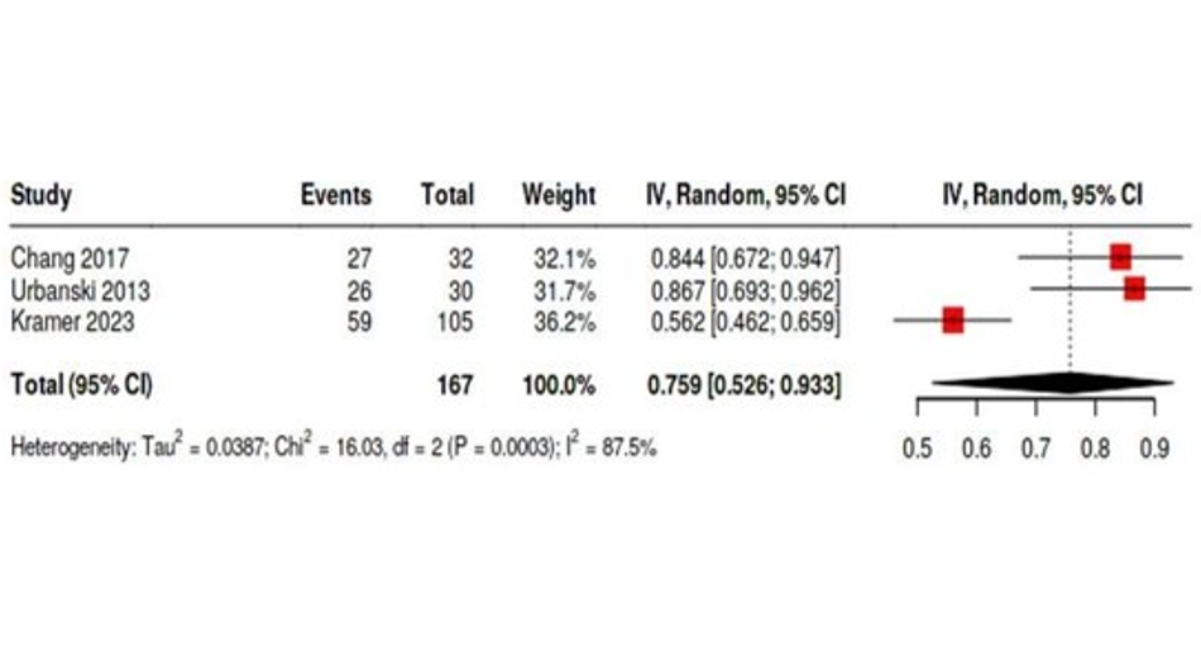
Figure 16: Forest Plot Shows the Pooled Estimated Available 5-Year Survival Rates in Open Surgery Cohort
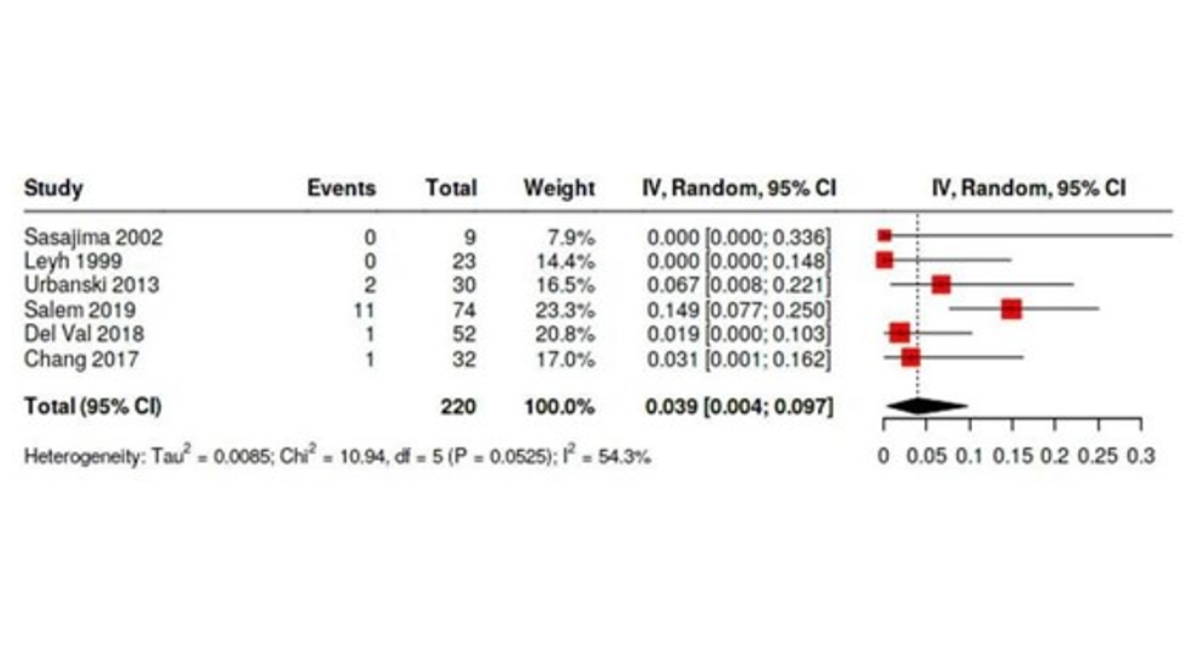
Figure 17: Forest Plot Shows Pooled Estimated Re-Intervention Rates in Open Surgery Cohort
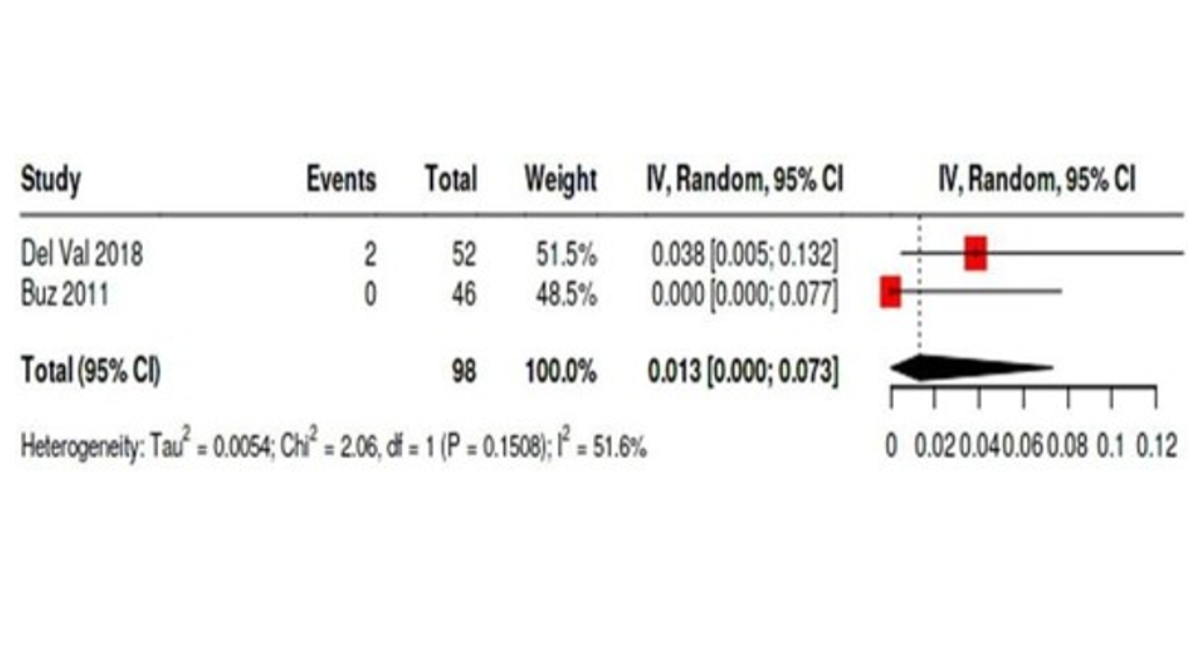
Figure 18: Forest Plot Shows the Pooled Estimated Re-Intervention Rates in the Endovascular Surgery Cohort
Hybrid Procedure Outcomes
The only identified study reporting hybrid procedures in porcelain aorta patients was conducted by Mayr, a retrospective single-center study from Germany [5]. The cohort included 20 patients undergoing hybrid interventions (12 simultaneous TAVI + OPCAB, 6 MIDCAB + TAVI, 2 staged TAVI/OPCAB), of whom 15 (75%) had a porcelain aorta. Device success was achieved in 100% of cases. There were no 30-day mortalities, strokes, myocardial infarctions, or vascular complications. Re-exploration for bleeding was required in one patient (~7%), and the median ICU stay was 4 days (IQR: 2–7 days).
Publication bias
Funnel plots and Egger's tests were done to assess publication bias (figures19-33). Success rate of open surgery cohort figure (3) and 5-years survival rates in the same cohort figure (33) shows probable publication bias.
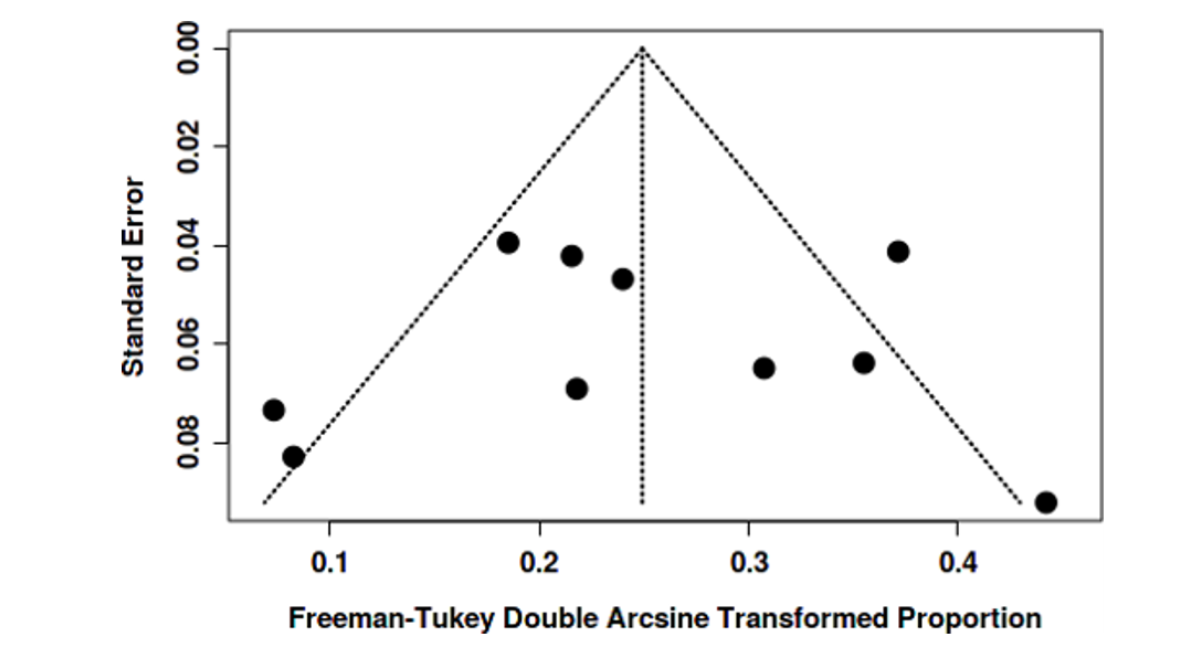
Figure 19: 30- Day Mortality Rate of Open Surgery Cohort's Funnel Plot Does Not Indicate a Potential Publication Bias. The Egger's Test Does Not Support the Presence of Funnel Plot Asymmetry (Intercept: -1.14, 95% CI: -2.59 - 0.32, T: -1.531, P-Value: 0.157)
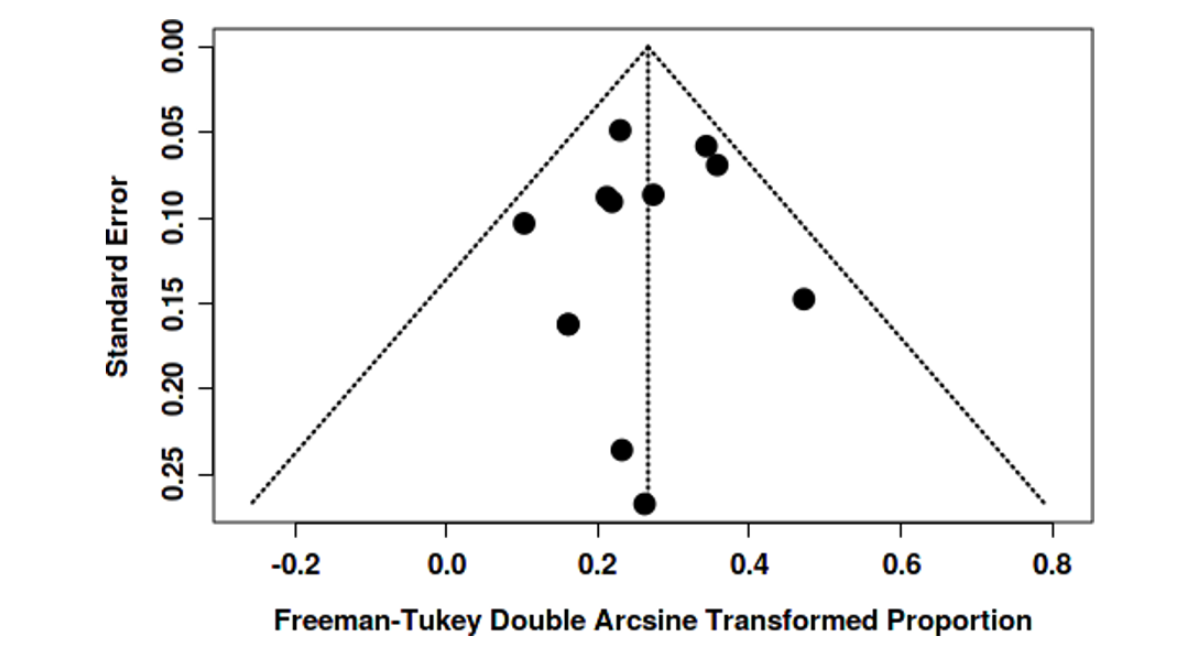
Figure 20: 30-Day Mortality Rate in Endovascular Surgery Cohort's Funnel Plot Does Not Indicate a Potential Publication Bias. The Egger's Test Does Not Support the Presence of Funnel Plot Asymmetry (Intercept: -0.26, 95% CI: -4.54 - 4.02, T: -0.121, P-Value: 0.907)
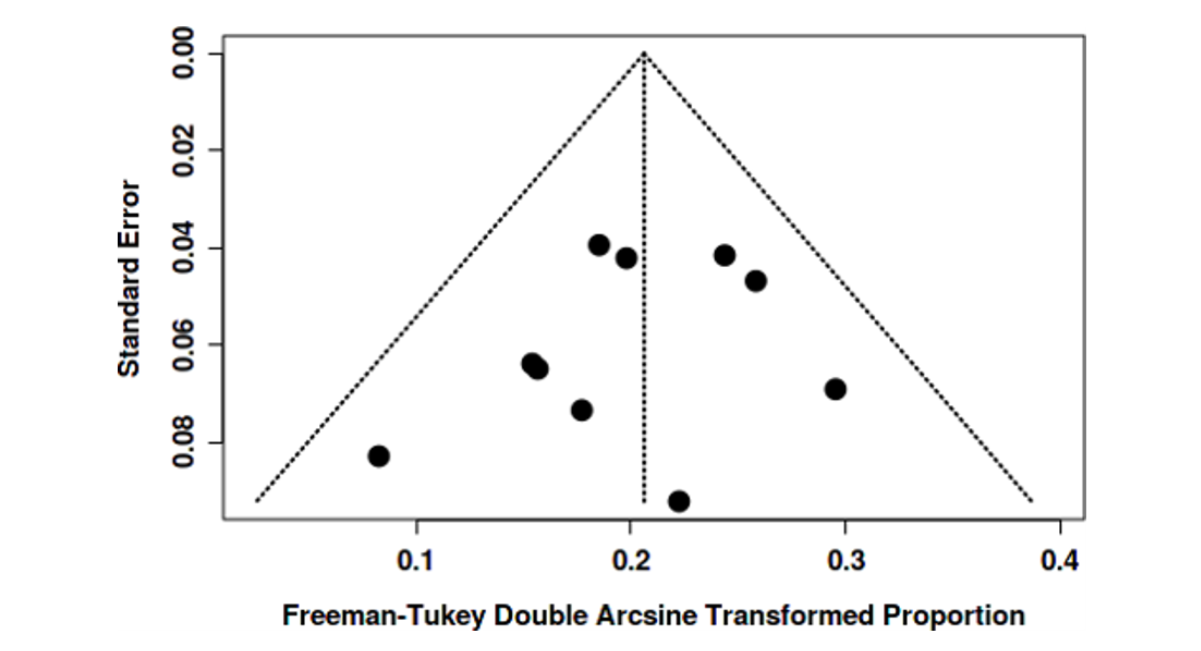
Figure 21: Stroke Rates of Open Surgery Cohort's Funnel Plot Does Not Indicate a Potential Publication Bias. The Egger's Test Does Not Support the Presence of Funnel Plot Asymmetry (Intercept: -0.36, 95% Ci: -1.63 - 0.92, T: - 0.549, P-Value: 0.595)
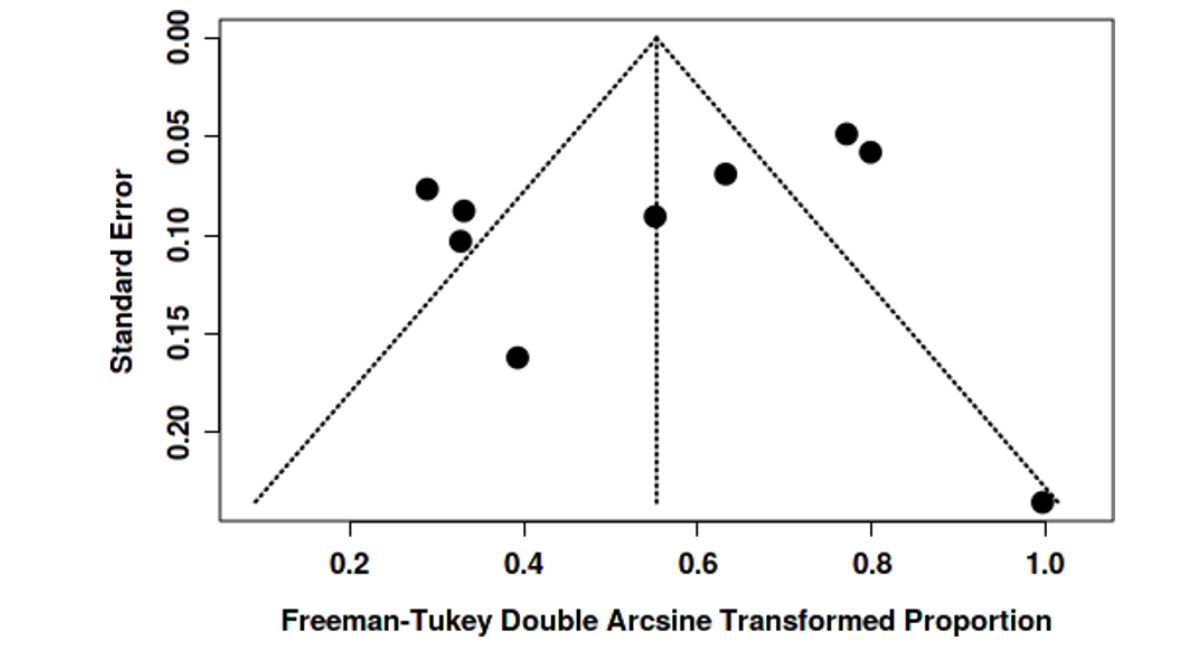
Figure 22: Stroke Rates of Endovascular Surgery Cohort's Funnel Plot Does Not Indicate a Potential Publication Bias. The Egger's Test Does Not Support the Presence of Funnel Plot Asymmetry (Intercept: -0.91, 95% CI: -2.99 - 1.17, T: - 0.859, P-Value: 0.415)
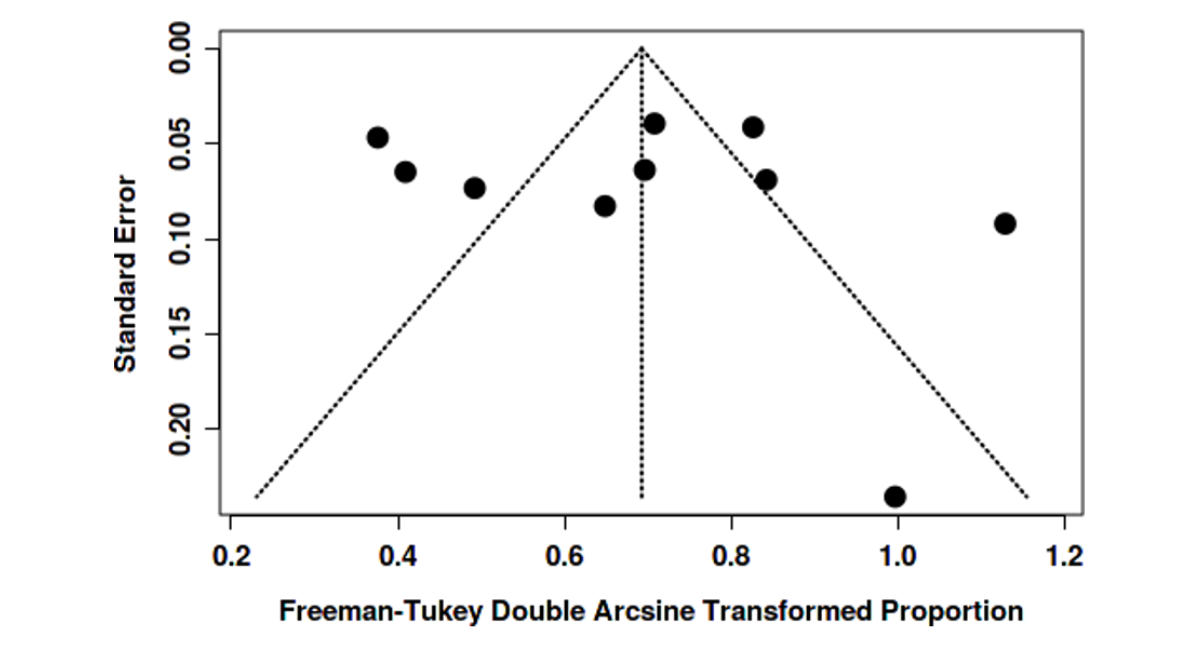
Figure 23: Complications Rates (Other Than Bleeding and Stroke) Of Open Surgery Cohort's Funnel Plot Does Not Indicate a Potential Publication Bias. The Egger's Test Does Not Support the Presence of Funnel Plot Asymmetry (Intercept: -3.03, 95% CI: -7.73 - 1.67, T: -1.262, P-Value: 0.247)
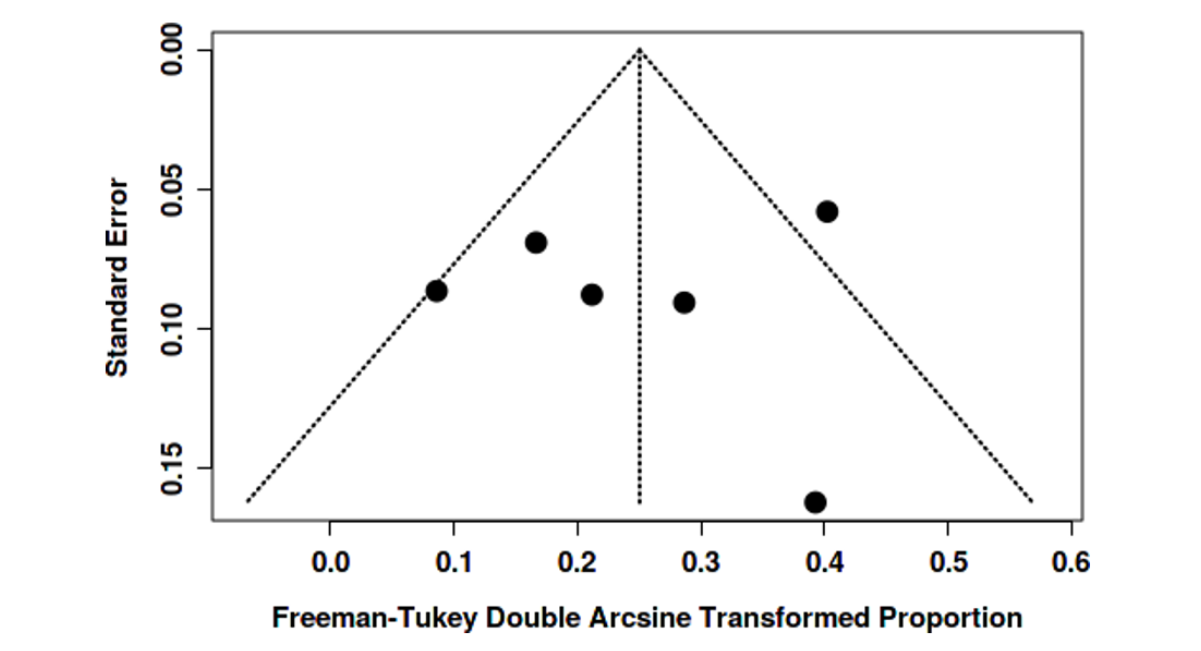
Figure 24: Complications Rates (Other Than Bleeding and Stroke) In Endovascular Surgery Cohort's Funnel Plot Does Not Indicate a Potential Publication Bias. The Egger's Test Does Not Support the Presence of Funnel Plot Asymmetry (Intercept: 1.38, 95% CI: -4.9 - 7.67, T: 0.431, P-Value: 0.678)
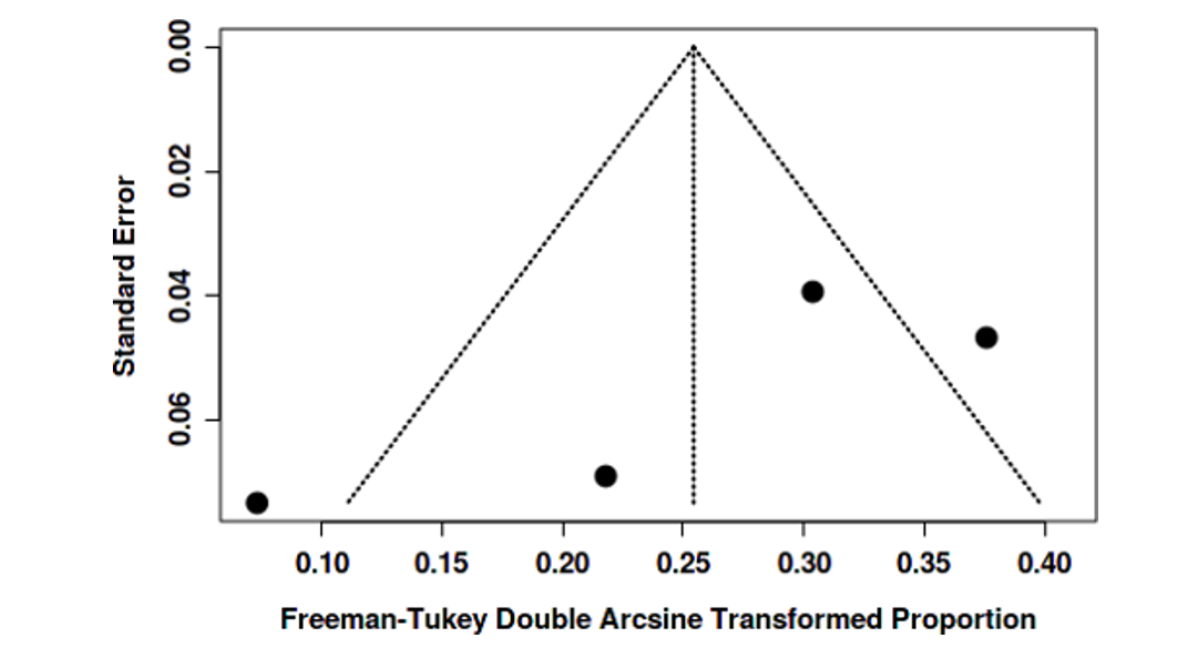
Figure 25: Bleeding Rates in Open Surgery Cohort's Funnel Plot Does Not Indicate a Potential Publication Bias. The Egger's Test Does Not Support the Presence of Funnel Plot Asymmetry (Intercept: -1.04, 95% CI: -6.22 - 4.14, T: - 0.393, P-Value: 0.714)
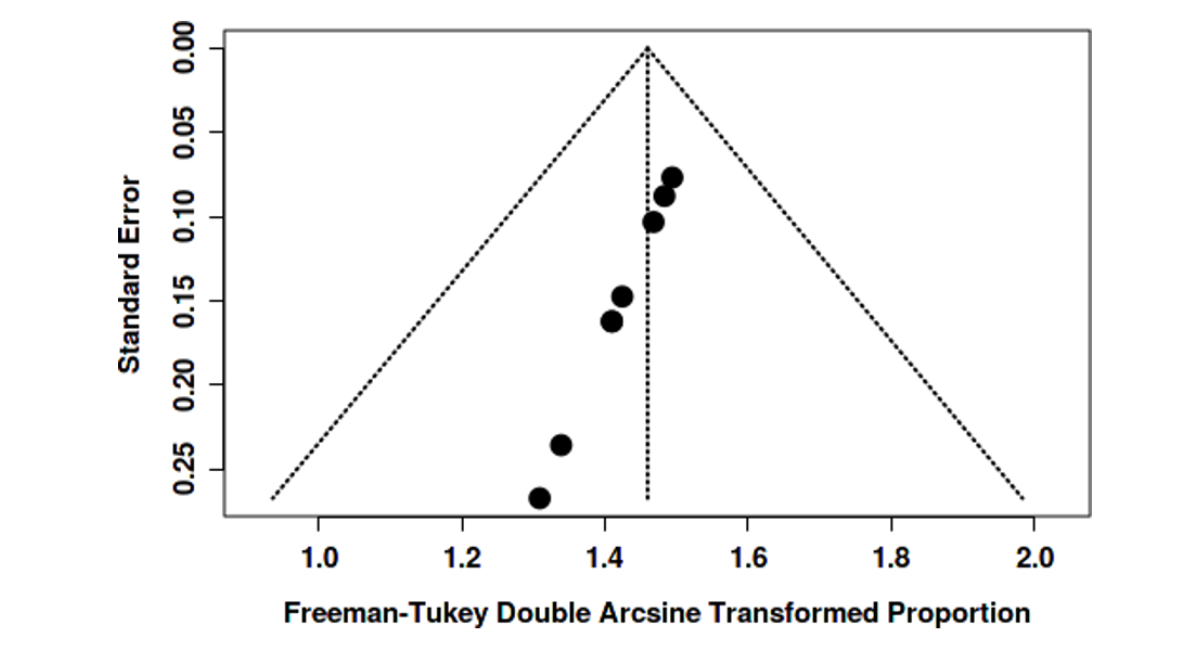
Figure 26: Bleeding Rates in Endovascular Surgery Cohort's Funnel Plot Does Not Indicate a Potential Publication Bias. The Egger's Test Does Not Support the Presence of Funnel Plot Asymmetry (Intercept: -5.69, 95% CI: -11.85 - 0.47, T: -1.811, P-Value: 0.212)
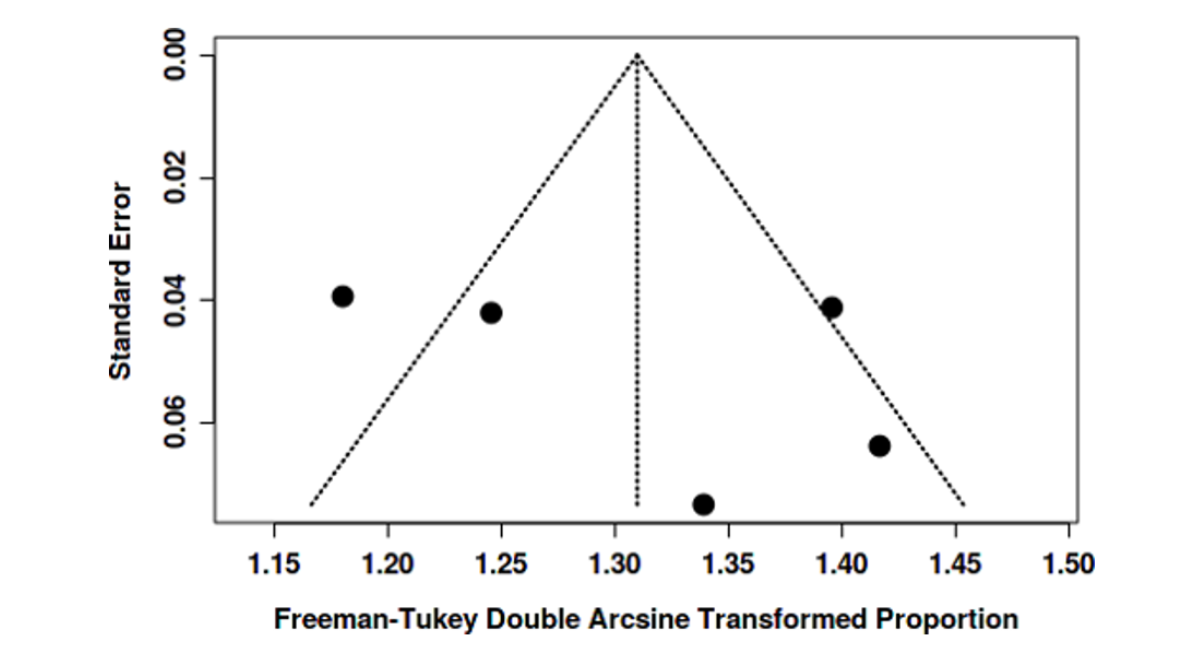
Figure 27: Success Rates in Open Surgery Cohort's Funnel Plot Indicates a Potential Publication Bias. The Egger's Test Supports the Presence of Funnel Plot Asymmetry (Intercept: -0.98, 95% CI: -0.98 - -0.97, T: -317.659, P-Value: 0)
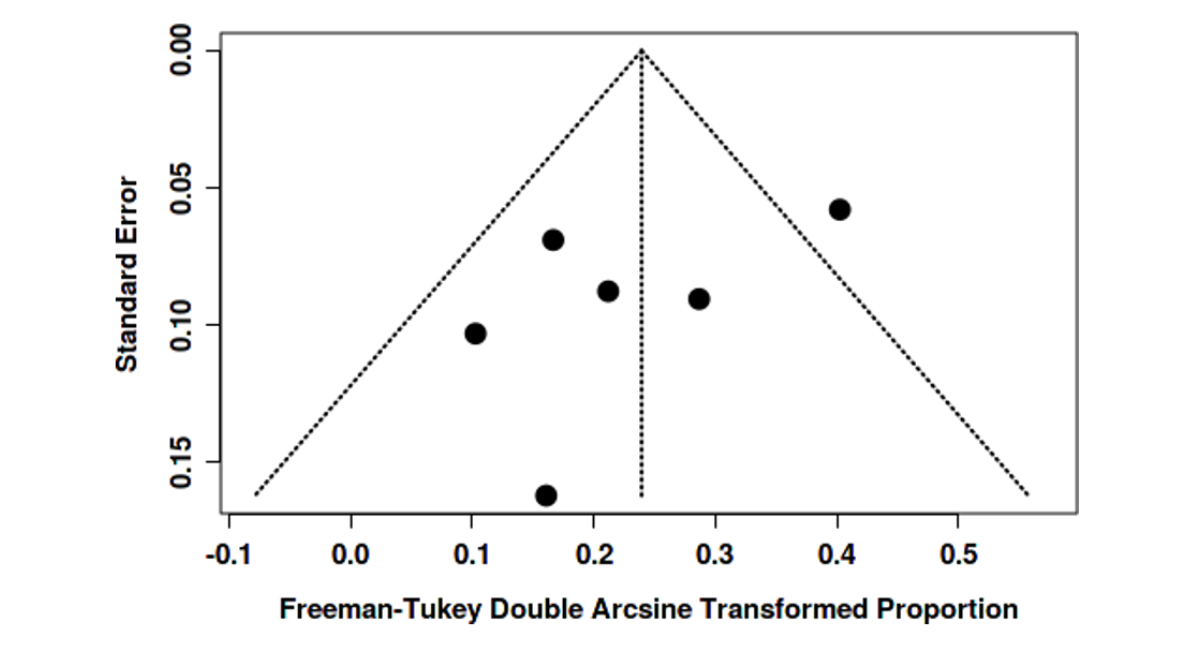
Figure 28: Success Rates in Endovascular Surgery Cohort's Funnel Plot Does Not Indicate a Potential Publication Bias. The Egger's Test Does Not Support the Presence of Funnel Plot Asymmetry (Intercept: 4.01, 95% CI: -4.62 - 12.65, T: 0.911, P-Value: 0.43)
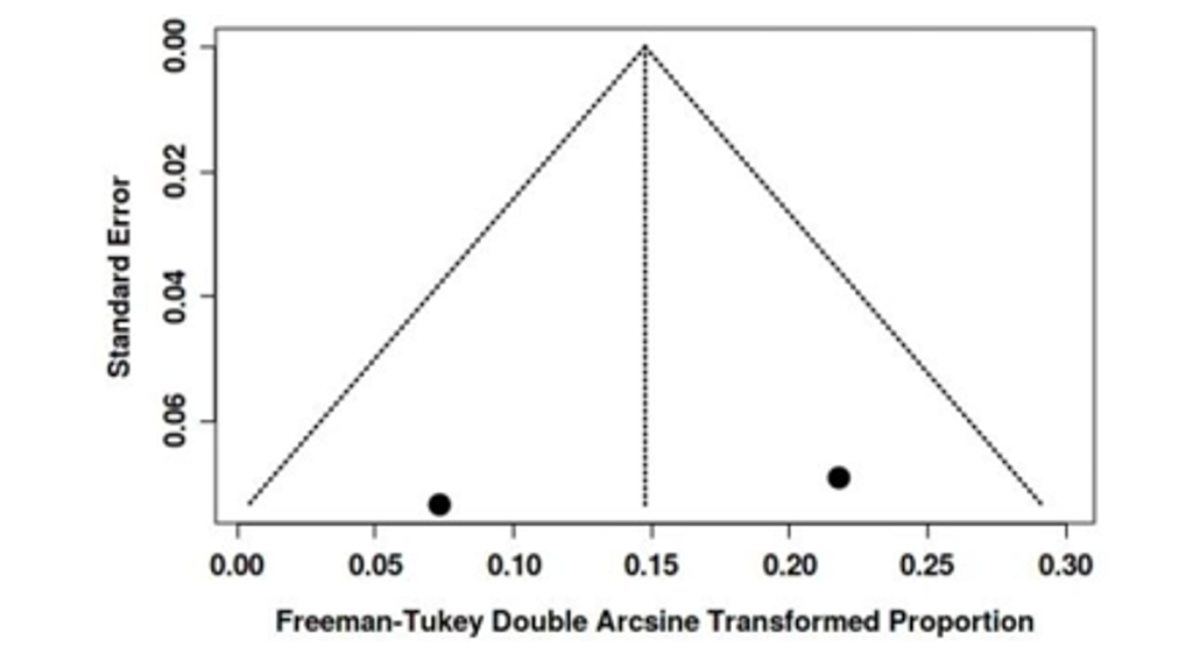
Figure 29: Re-Intervention Rates in Open Surgery Cohort's Funnel Plot Does Not Indicate a Potential Publication Bias. The Egger's Test Does Not Support the Presence of Funnel Plot Asymmetry (Intercept: -2.78, 95% CI: -6.48 - 0.92, T: - 1.475, P-Value: 0.214)
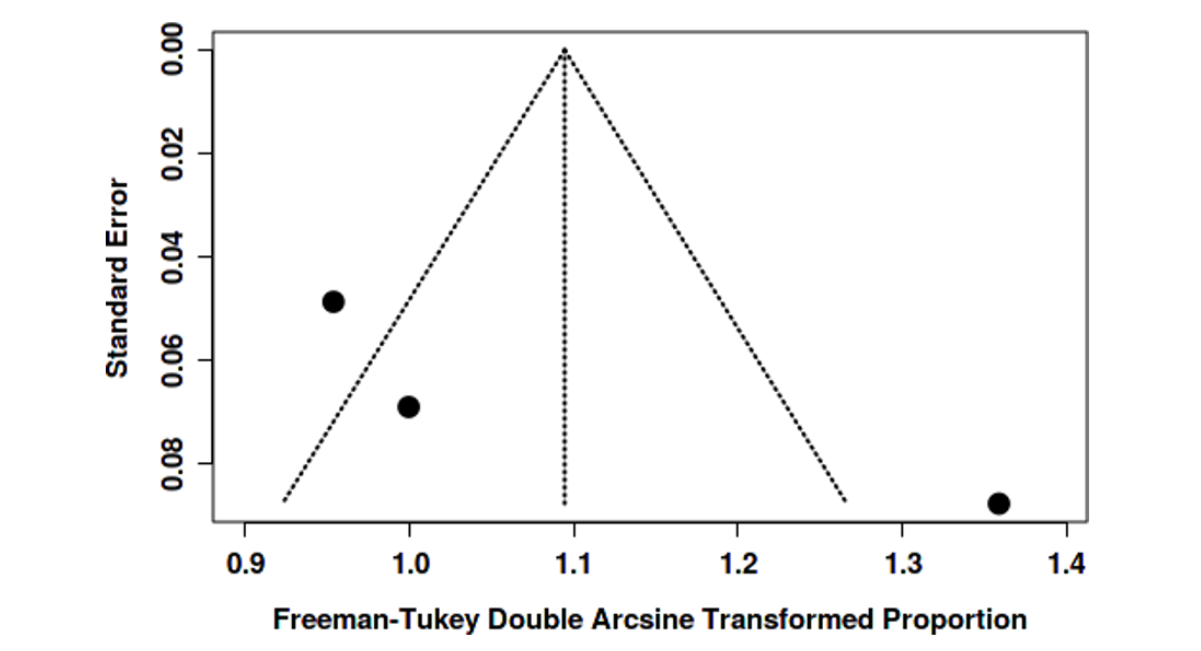
Figure 30: Funnel Plot of Re-Intervention Rates of Endovascular Surgery Cohort Shows No Publication Bias
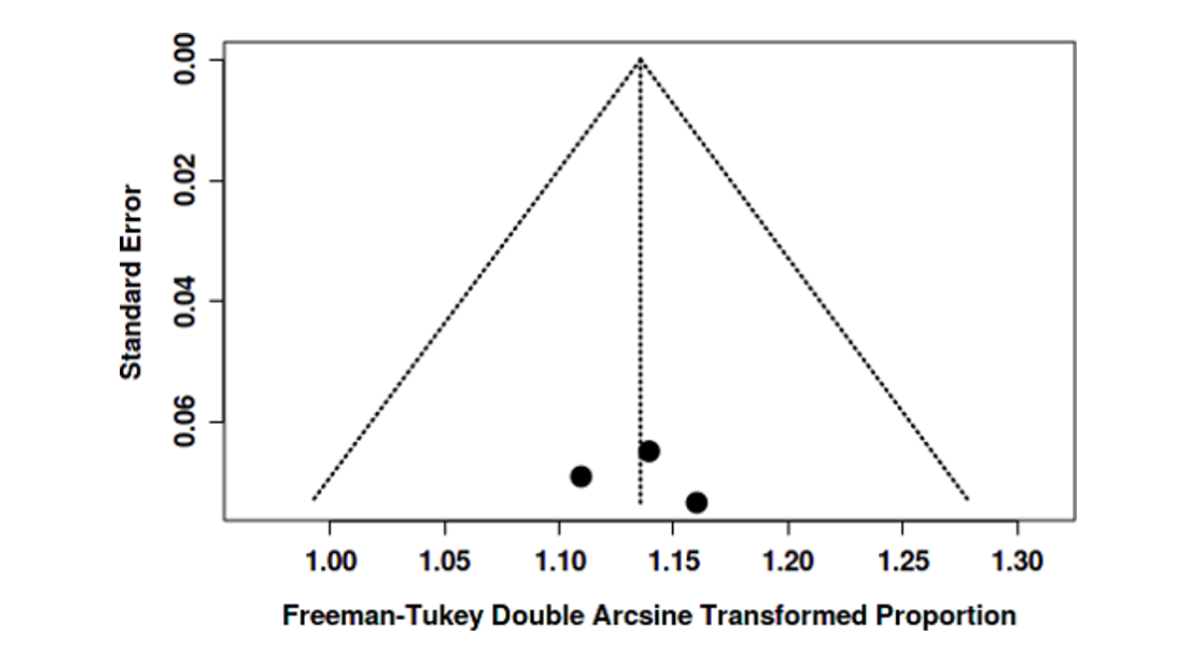
Figure 31: 1-Year Survival Rates of Open Surgery Cohort's Funnel Plot Does Not Indicate a Potential Publication Bias. The Egger's Test Does Not Support the Presence of Funnel Plot Asymmetry (Intercept: 8.74, 95% CI: -0.39 - 17.87, T: 1.876, P-Value: 0.312)
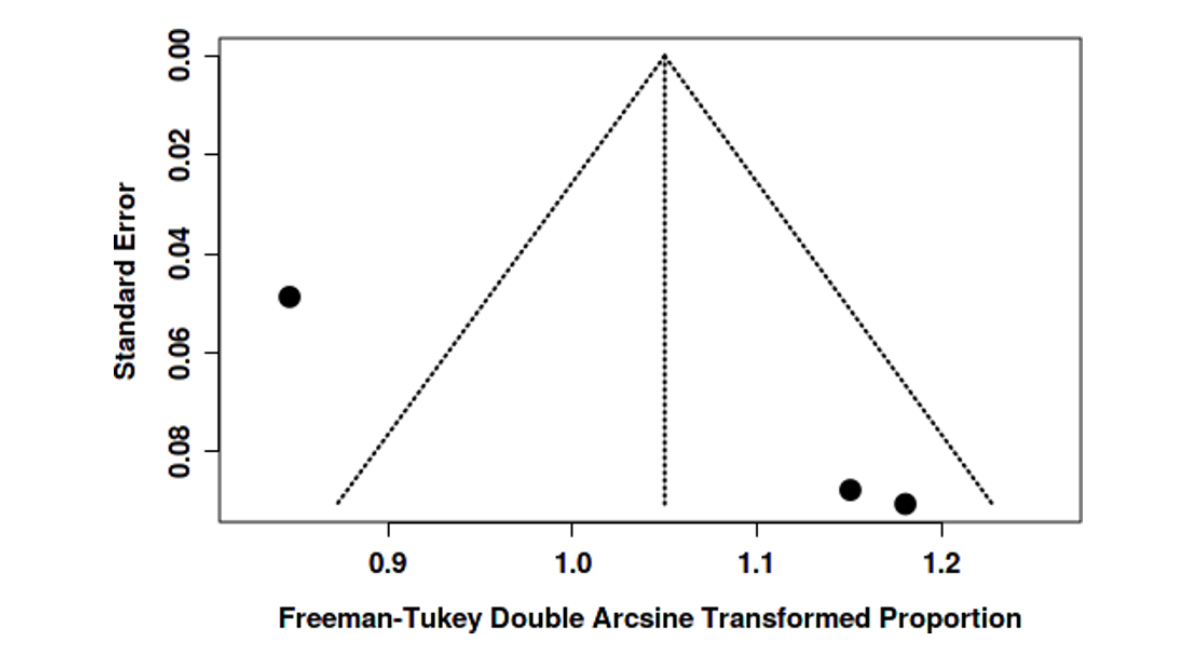
Figure 32: 1-Year Survival Rates of Endovascular Surgery Cohort's Funnel Plot Does Not Indicate A Potential Publication Bias. The Egger's Test Does Not Support the Presence of Funnel Plot Asymmetry (Intercept: 2.1, 95% CI: - 8.52 - 12.73, T: 0.388, P-Value: 0.764)
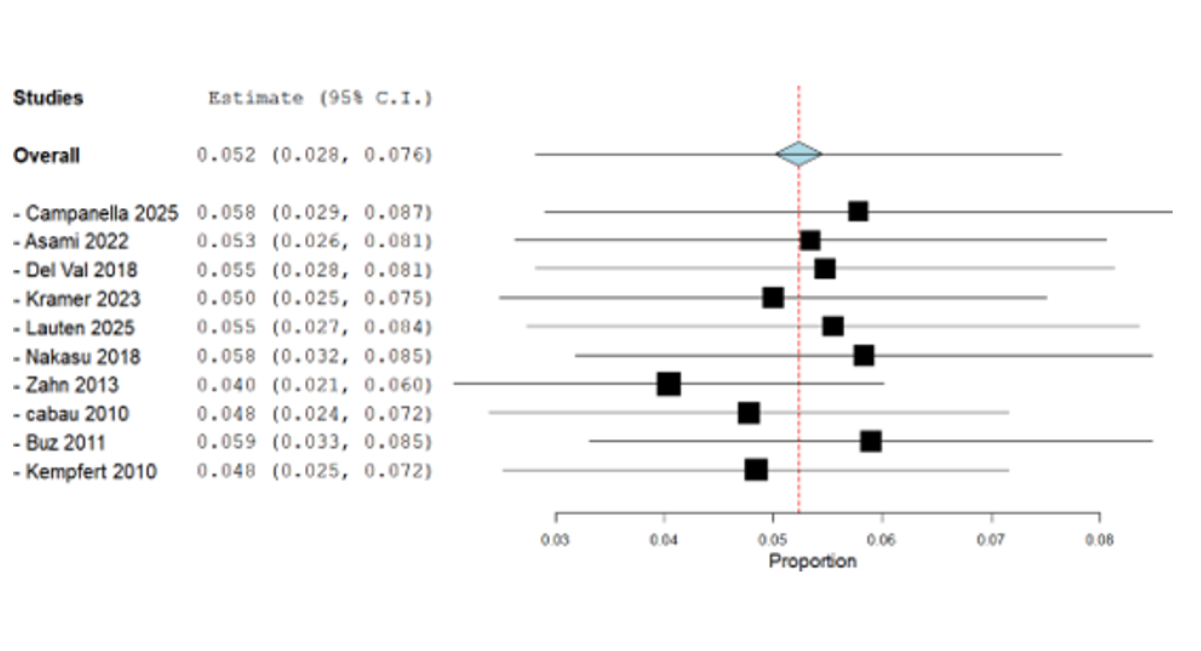
Figure 33: 5-Years Survival Rates of Open Surgery Cohort's Funnel Plot Indicates a Potential Publication Bias. The Egger's Test Supports the Presence of Funnel Plot Asymmetry (Intercept: 7.88, 95% CI:7.65 - 8.11, T: 67.124, P- Value: 0.009)
Sensitivity Analysis
Leave-one-out sensitivity analysis identified several studies that significantly influenced heterogeneity. Notably, Chang impacted the 1-year survival analysis in the open group; after its removal, heterogeneity dropped to I² = 0% [15]. Similarly, the exclusion of Kramer resolved heterogeneity in the 5-year survival analysis for open surgery, also bringing I² to 0% [14]. Salem contributed to heterogeneity in bleeding rates in the open group, which decreased to I² = 7% upon its removal [16]. For ICU stay duration, Sirin and Del Val were responsible for heterogeneity in the open and endovascular cohorts respectively; removal of Del Val eliminated heterogeneity (I² = 0%) in the endovascular group, though it remained high (I² = 83%) in the open group [8,17]. Zahn also showed influence in the 30-day mortality analysis, reducing heterogeneity to 59.5% when removed [9]. Additionally, Campanella influenced success rate heterogeneity in the endovascular cohort, which dropped to 64% after exclusion [18]. (Figure 34-50)
Figure 34: Leave-One-Out Sensitivity Analysis of 30-Day Mortality Rate in Endovascular Surgery Cohort
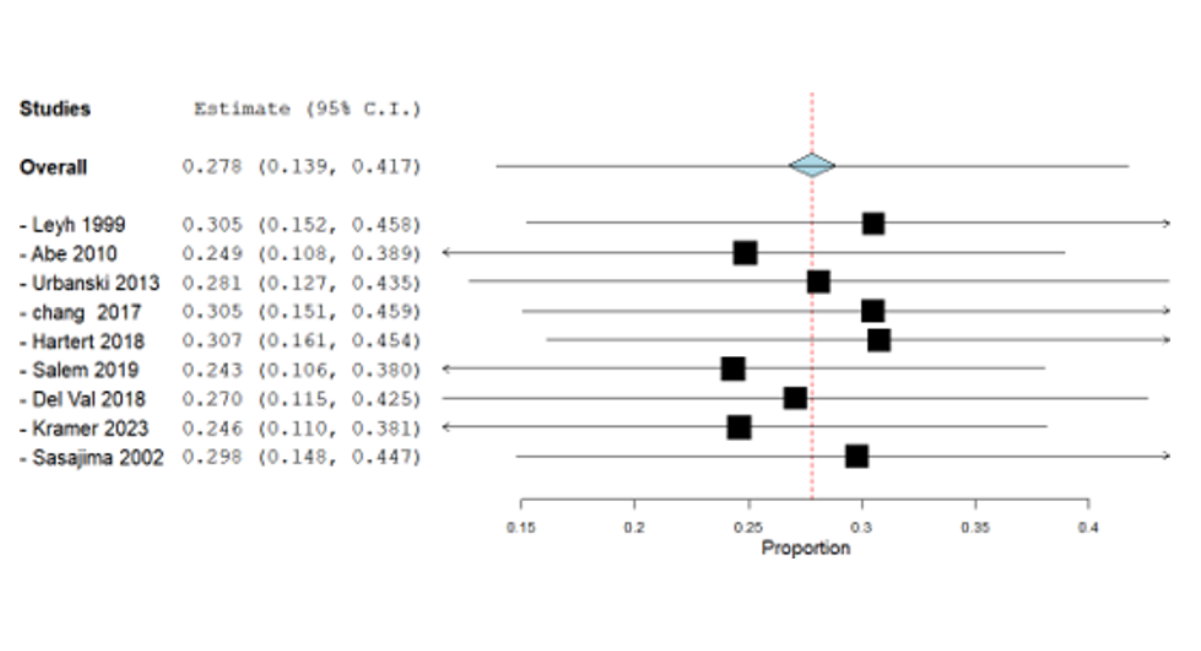
Figure 35: Leave-One-Out Sensitivity Analysis of All Complications Rates (Other Than Bleeding & Stroke Rates) in Open Surgery Cohort
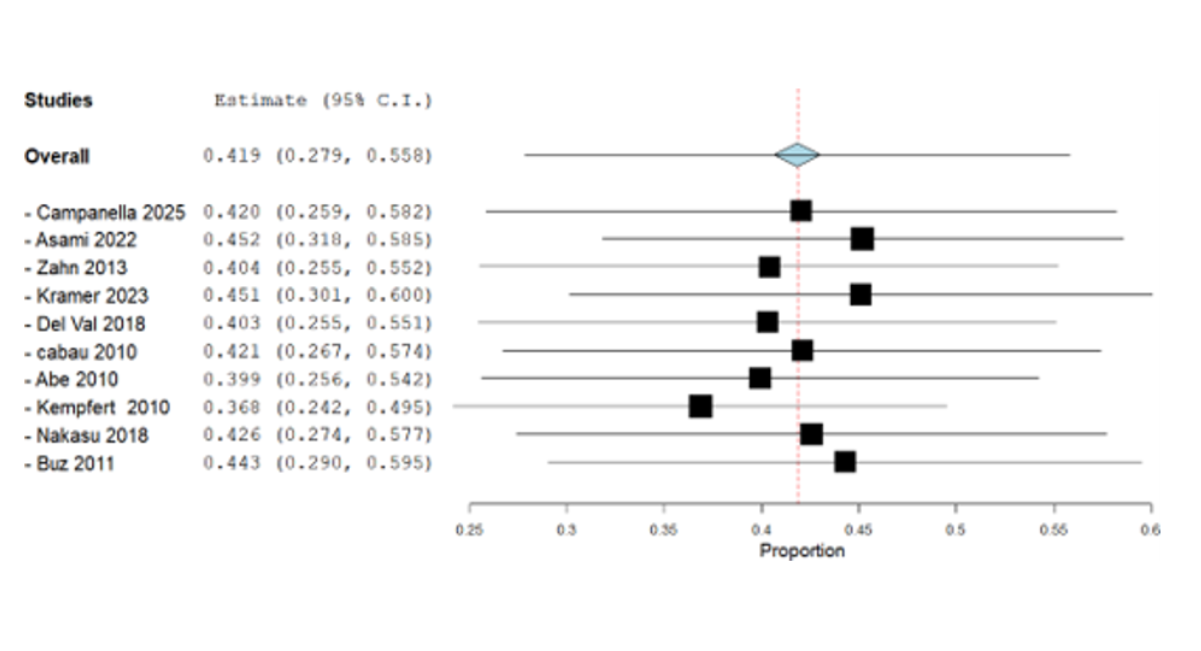
Figure 36: Leave-One-Out Sensitivity Analysis of All Complications Rates (Other Than Bleeding & Stroke Rates) in Endovascular Surgery Cohort
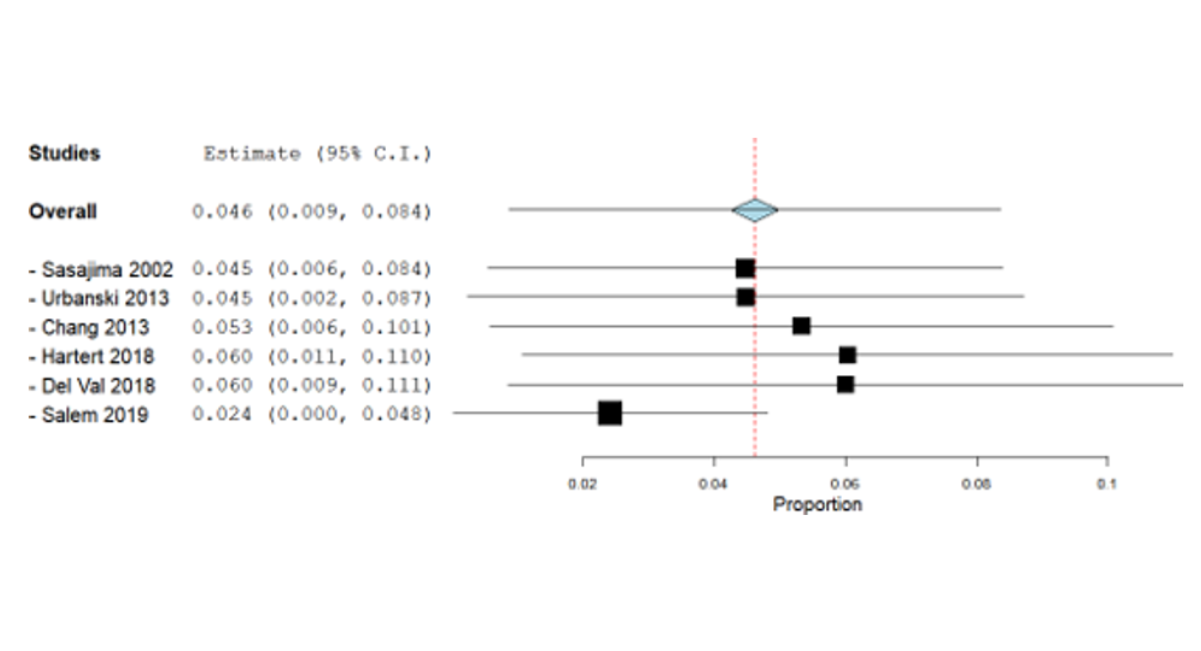
Figure 37: Leave-One-Out Sensitivity Analysis of Bleeding Rates in Open Surgery Cohort
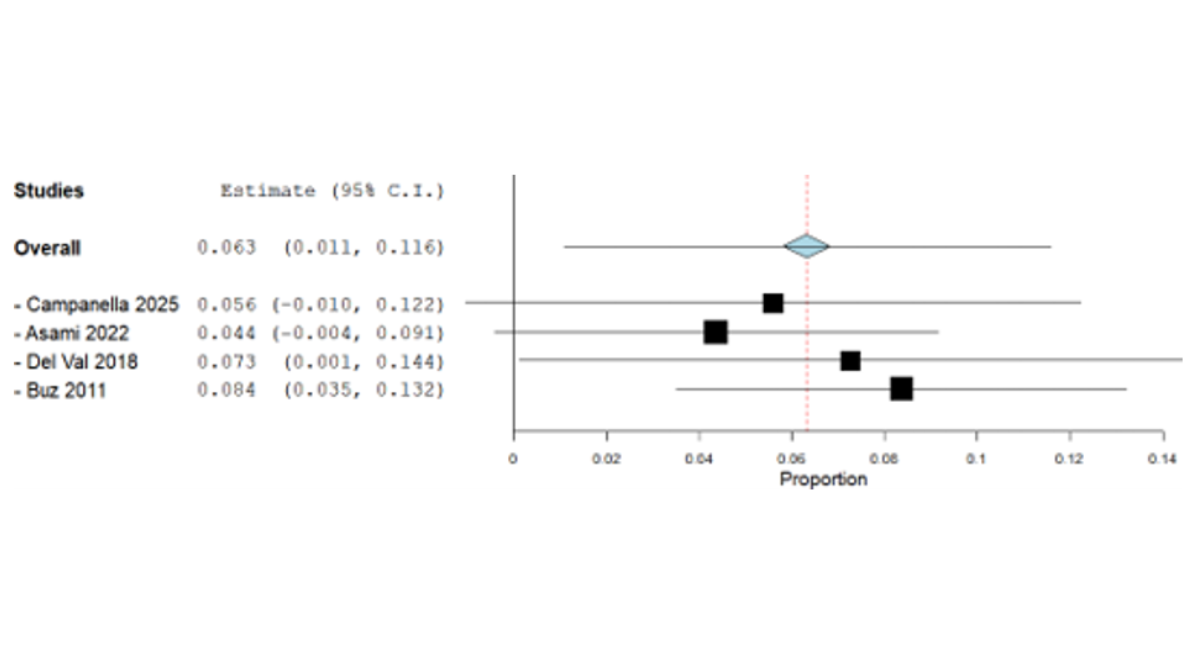
Figure 38: Leave-One-Out Sensitivity Analysis of Bleeding Rates in Endovascular Surgery Cohort
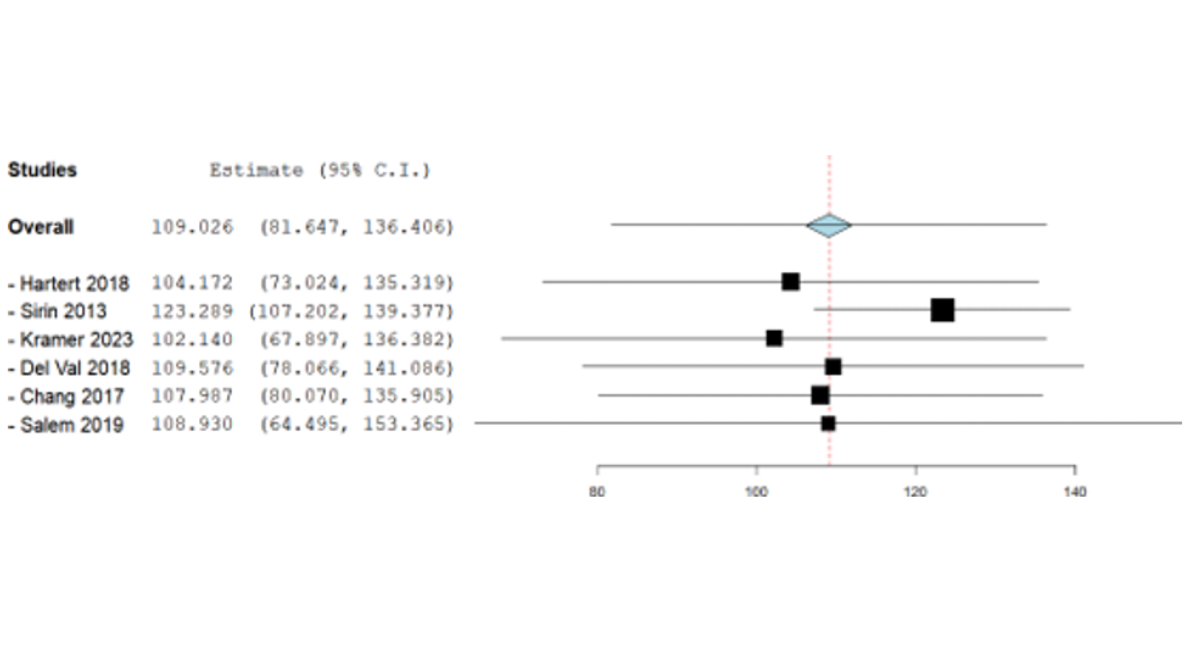
Figure 39: Leave-One-Out Sensitivity Analysis of ICU Stay Means in Open Surgery Cohort
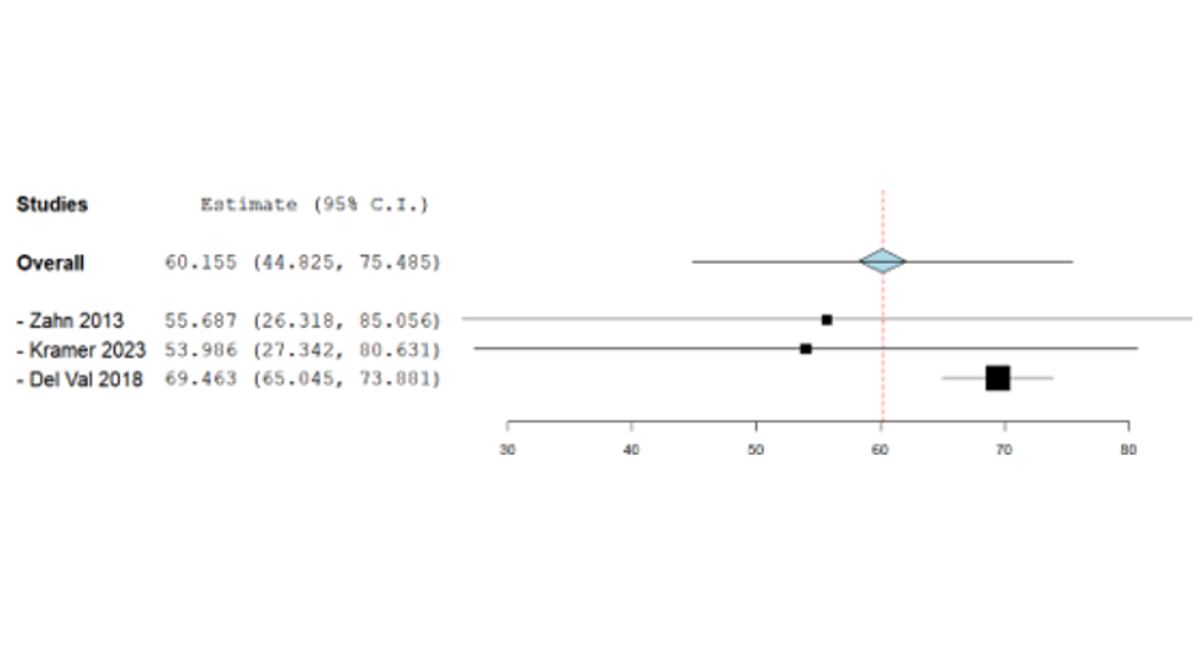
Figure 40: Leave-One-Out Sensitivity Analysis of ICU Stay Means in Endovascular Surgery Cohort
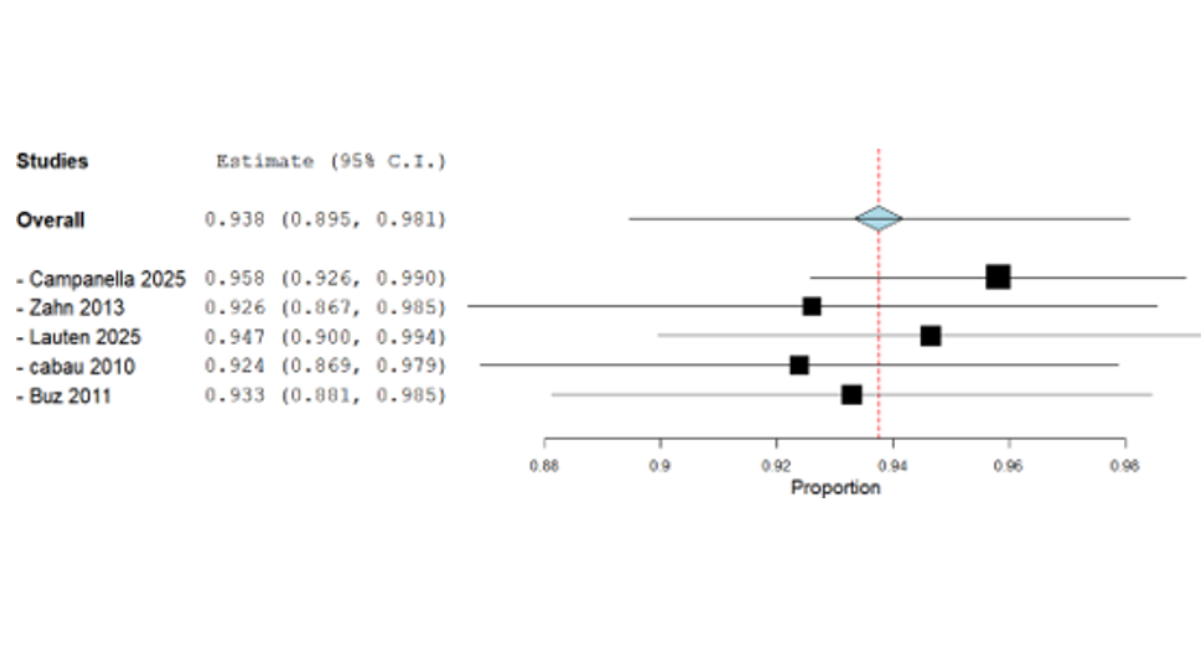
Figure 41: Leave-One-Out Sensitivity Analysis of Success Rates in Endovascular Surgery Cohort
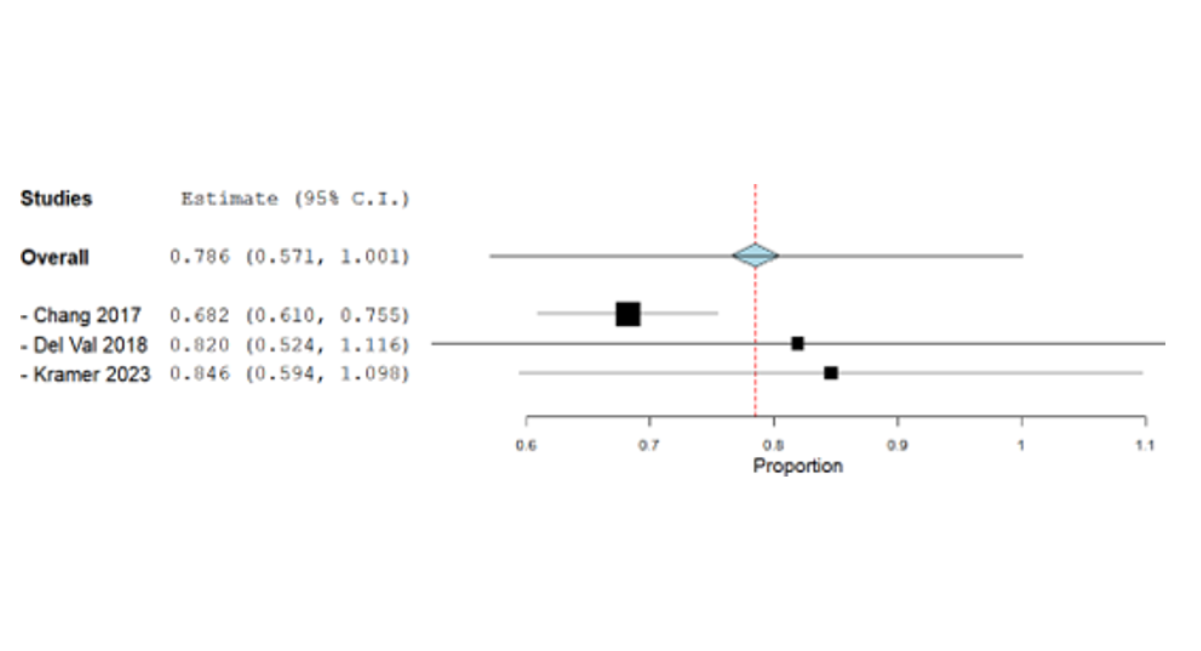
Figure 42: Leave-One-Out Sensitivity Analysis Of 1-Year Survival Rates in Open Surgery Cohort
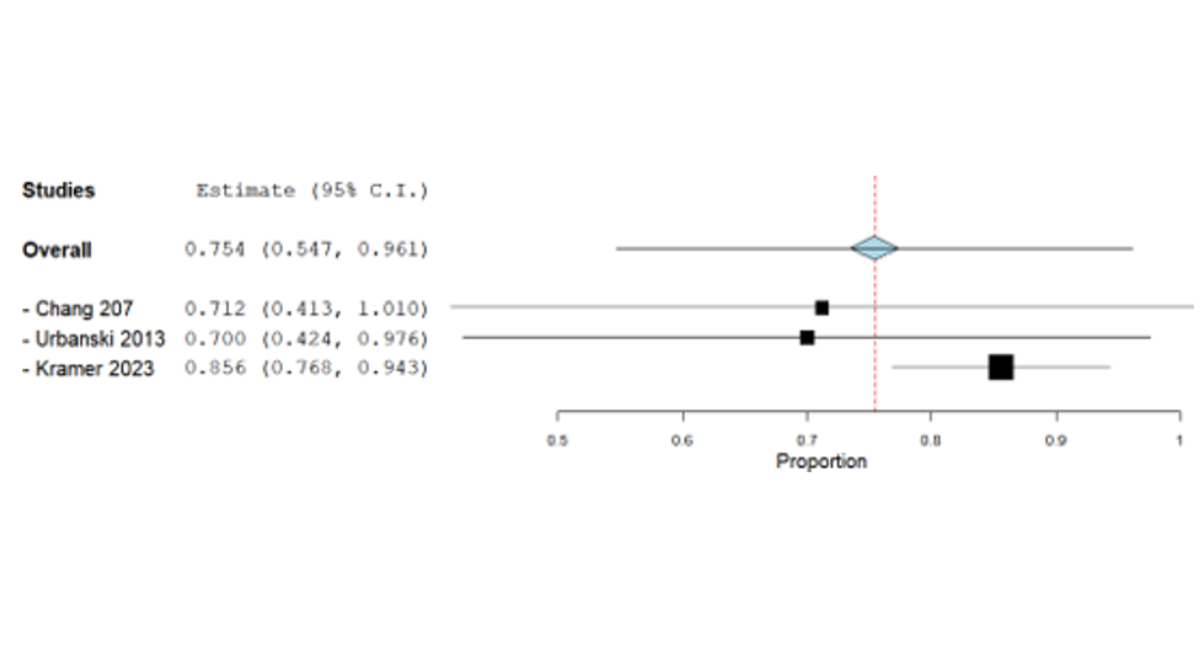
Figure 43: Leave-One-Out Sensitivity Analysis Of 5-Years Survival Rates in Open Surgery Cohort
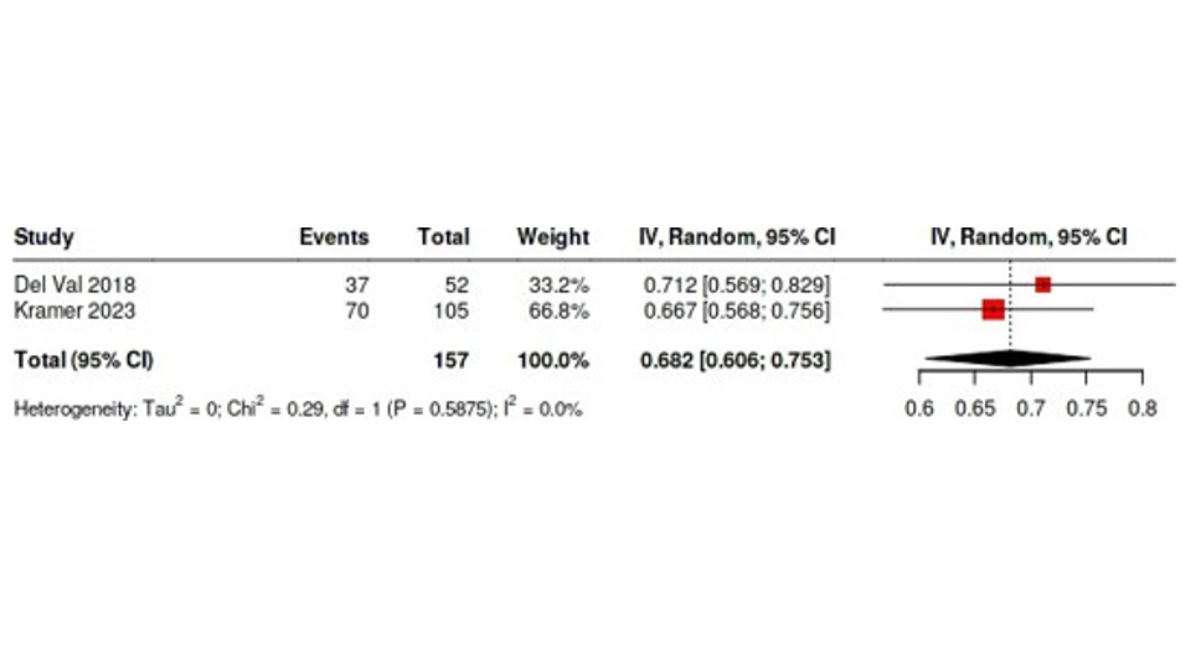
Figure 44: Forest Plot Shows the Effect of Removal of Chang from the Original Forest Plot Of 1-Year Survival Rates in Open Vascular Surgery Cohort Figure (14)
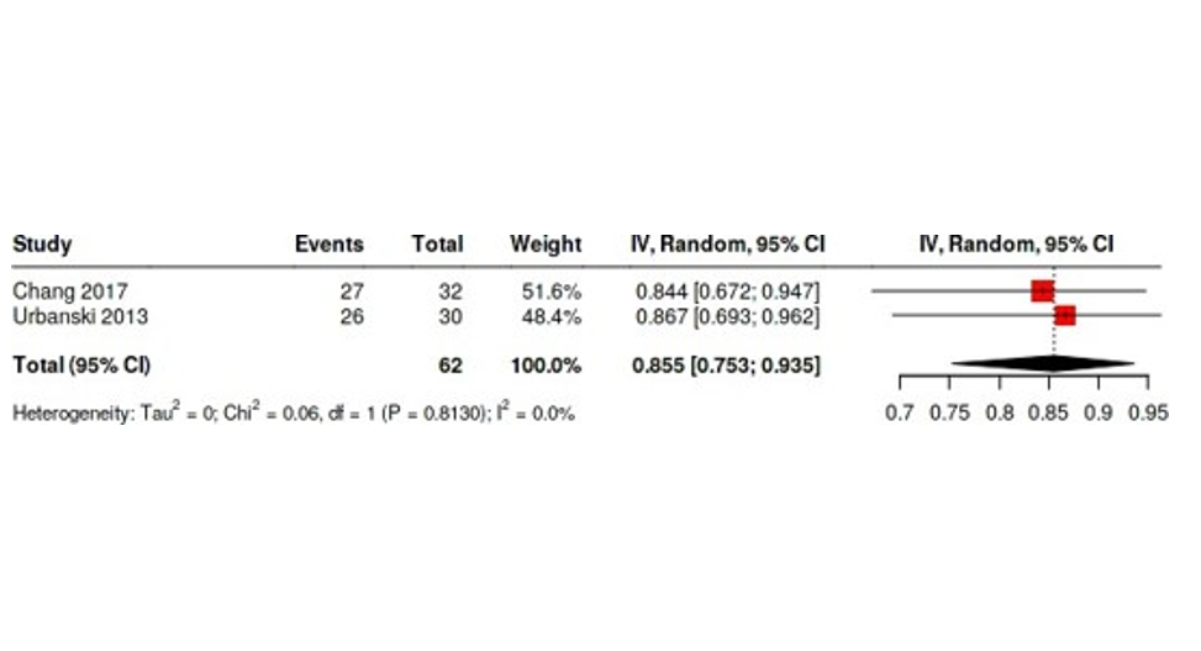
Figure 45: Forest Plot Shows the Effect of Removal of Kramer from Original Forest Plot Of 5-Years Survival Rate in Open Vascular Cohort Figure (16)
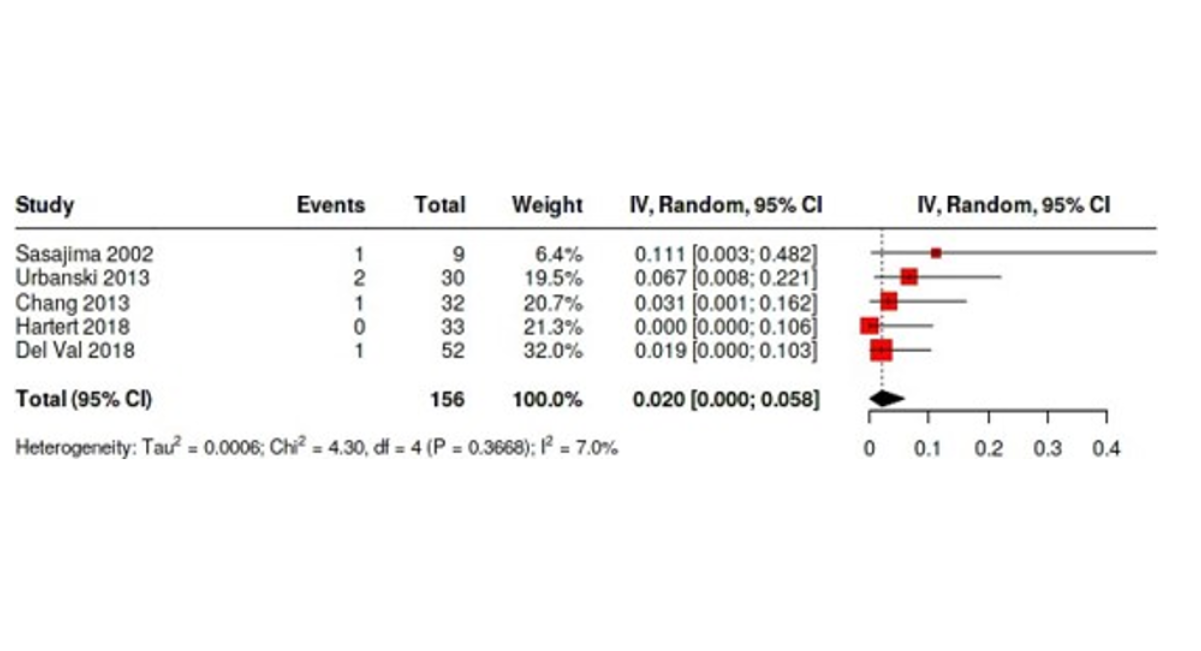
Figure 46: Forest Plot Shows the Effect of Removal of Salem from Original Forest Plot of Bleeding Rates In Open Surgery Cohort Figure 8)
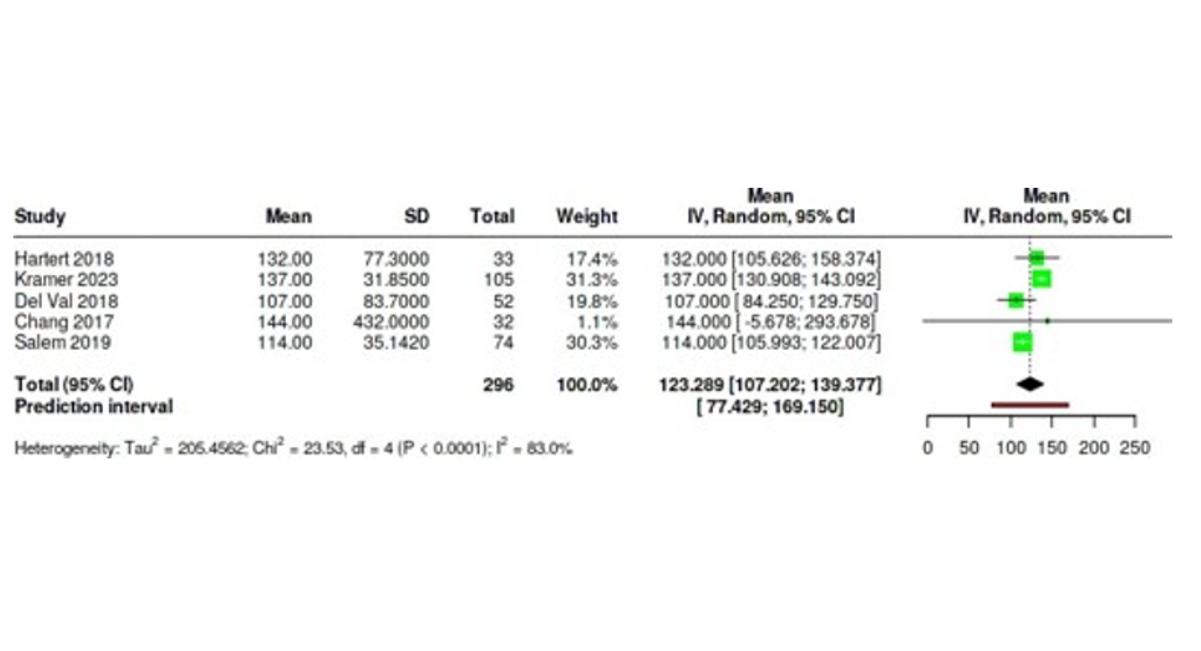
Figure 47: Forest Plot Shows the Effect of Removal of Sirin from Original Forest Plot Of ICU Stay Hours in Open Surgery Cohort Figure (10)
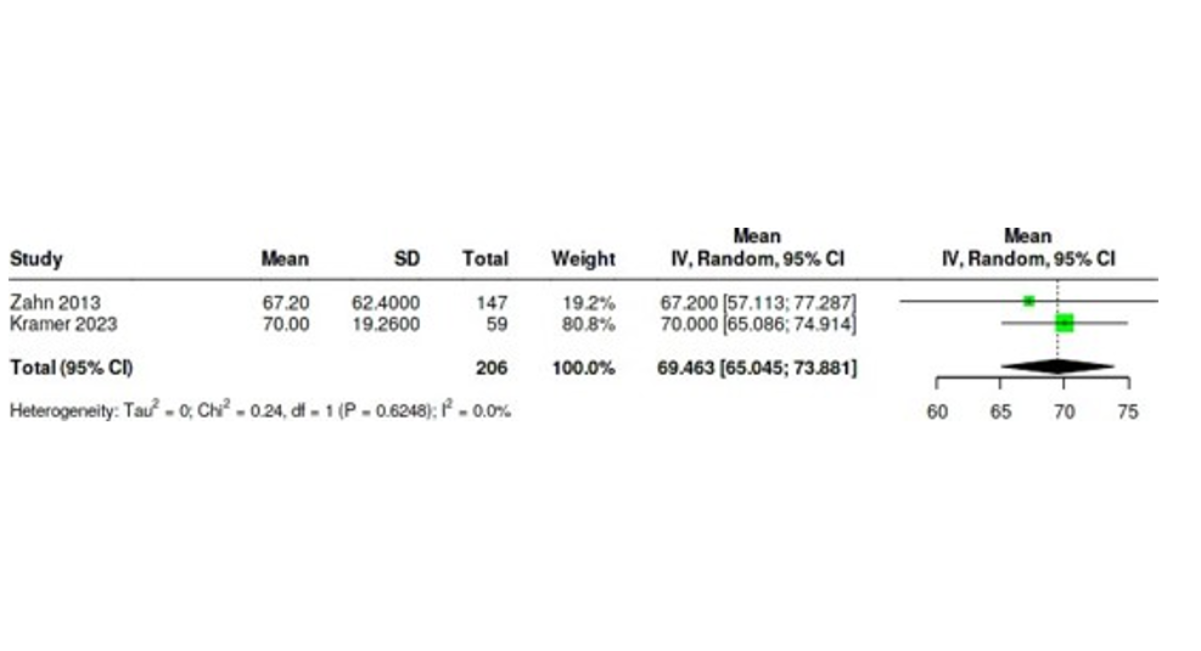
Figure 48: Forest Plot Shows the Effect of Removal Of Del Val from Original Forest Plot Of ICU Stay Hours In Endovascular Surgery Cohort Figure (11)
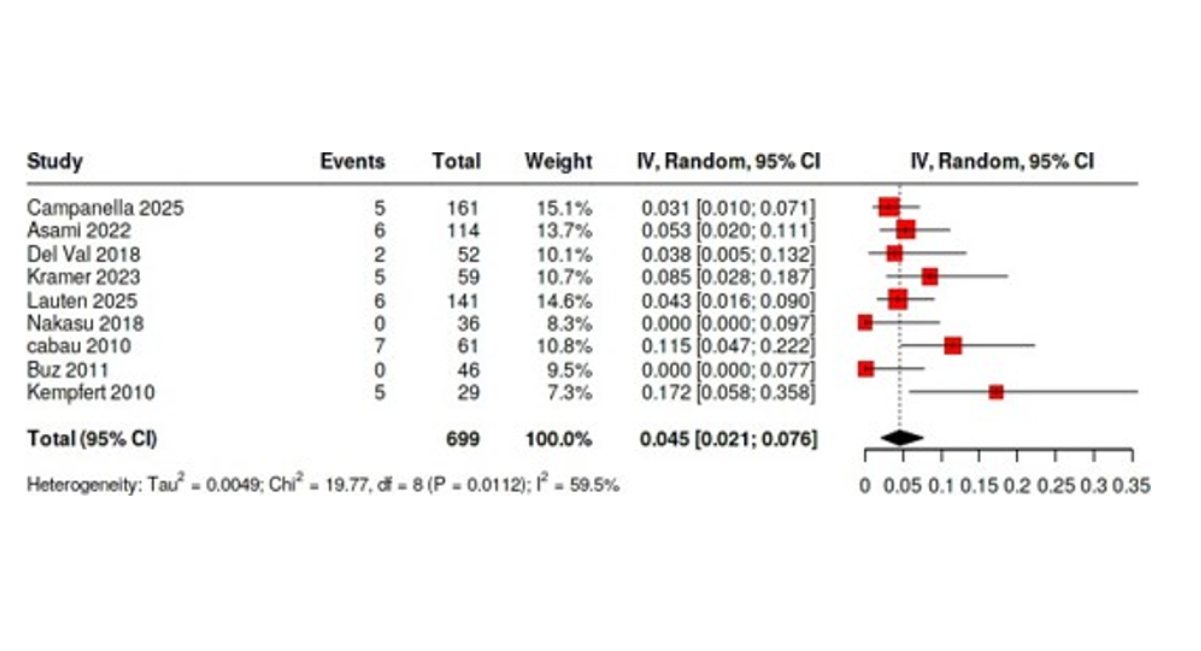
Figure 49: Forest Plot Shows the Effect of Removal of Zahn from Original Forest Plot of 30-Day Mortality Rates in Endovascular Surgery Cohort Figure (3)
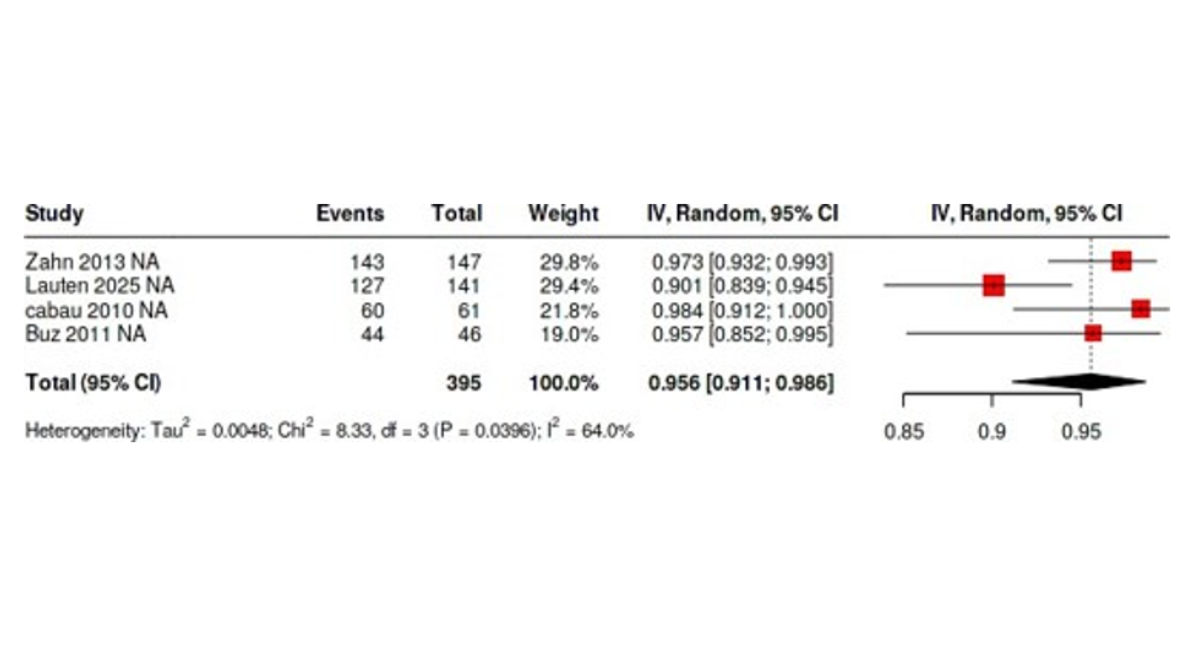
Figure 50: Forest Plot Shows the Effect of Removal of Campanella from Original Forest Plot of Success Rates in Endovascular Surgery Cohort Figure (13)
Quality Assessment
Two reviewers independently and blindly assessed the quality of the included studies, with disagreements resolved by a third reviewer. The ROBINS-I v2 tool was used to evaluate bias across seven domains: confounding, classification of interventions, selection of participants, deviations from intended interventions, missing data, outcome measurement, and selective reporting. The tool uses standardized signaling questions with responses such as "Yes," "Probably Yes," "No," "Probably No," and "No Information" to guide judgments. For studies where ROBINS-I was not applicable, the Joanna Briggs Institute (JBI) checklists for case series and cohort studies were used. Full assessments are detailed in Figures 51 and Tables 1 and 2. Overall, most included studies were judged to be at low risk of bias.
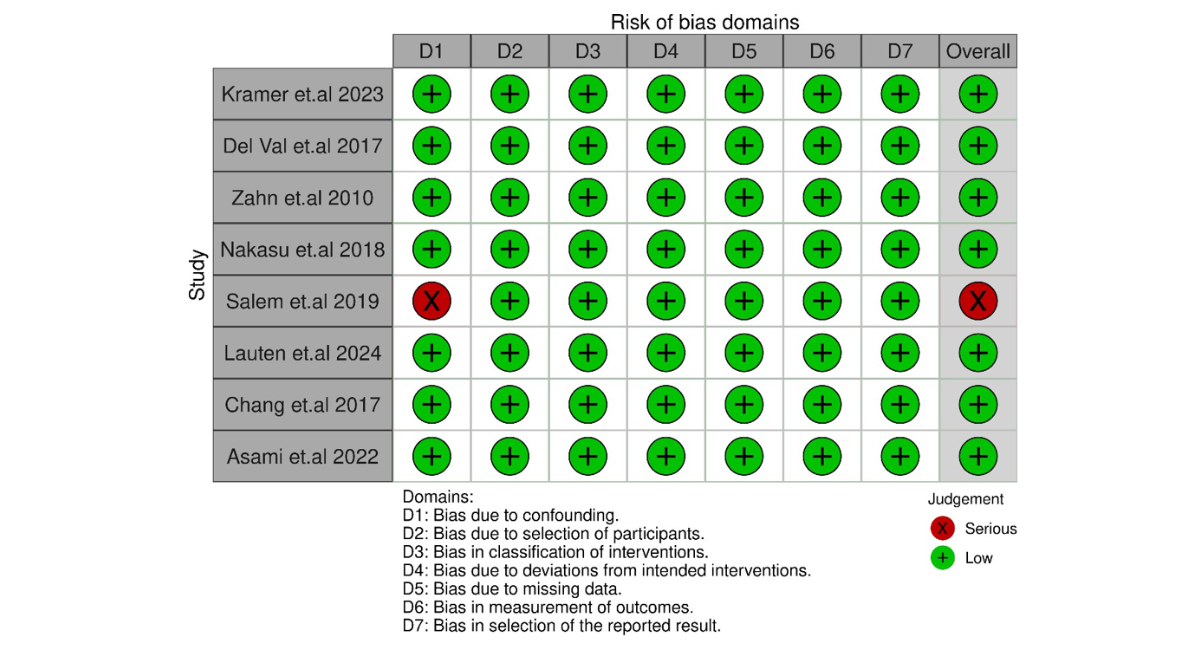
Figure 51: Shows Quality Assessment Using ROBINS-Is Tool
DISCUSSION
Overview of Key Findings
Managing patients with porcelain aorta (PA) remains a significant clinical challenge due to the risks associated with extensive aortic calcification. In this systematic review and meta-analysis of 20 studies involving 1249 patients, both open and endovascular strategies demonstrated comparable short-term outcomes, particularly regarding 30-day mortality (3.1% vs. 5.4%) and stroke rates (3.7% vs. 3.5%). However, each approach presented distinct advantages and drawbacks that merit careful consideration.
Surgical vs. Endovascular Trade-Offs
Open surgery demonstrated a higher technical success rate (100% vs. 93.8%), which may be attributed to direct visualization and precise control during the procedure despite the complexity introduced by calcification. On the other hand, endovascular approaches, while less invasive and associated with shorter ICU stays (60.2 vs. 109.0 hours), had a higher pooled bleeding rate (5.7% vs. 4.5%). This aligns with findings from broader TAVI literature, including the PARTNER trials, which reported elevated vascular complication rates in transfemoral TAVI compared to surgical aortic valve replacement (SAVR), largely due to access-site complications and earlier-generation device profiles [19,20].
Alignment with Guidelines
The 2021 ESC/EACTS guidelines recommend TAVI over SAVR in patients with PA due to the increased technical and embolic risk posed by extensive aortic calcification [6]. Our findings support this recommendation, particularly for patients at high surgical risk. Nevertheless, open surgery remains a viable option, especially in experienced centers where advanced surgical strategies and intraoperative planning can mitigate the risks associated with a porcelain aorta.
Hybrid Approaches: A Promising Option
Although limited in number, studies evaluating hybrid procedures most commonly combining TAVI with off-pump coronary artery bypass (OPCAB) show promising outcomes. One retrospective study reported 100% device success with no 30-day mortality or stroke in a 12-patient hybrid cohort [5]. Another series involving MIDCAB and TAVI in high-risk patients also reported favorable outcomes [21]. These preliminary results suggest that hybrid strategies may offer a safe and effective option for select patients with complex anatomical or comorbid profiles, though further evidence is needed.
Need for Long-Term Evidence
Limited data on long-term outcomes remains a concern. Only three studies reported one-year survival (79.5% open vs. 82.8% endovascular), and just one study Kramer provided five-year data (56% open vs. 82% endovascular) [14,22]. This lack of consistent long-term follow-up makes it difficult to draw firm conclusions about durability and survival, highlighting the need for standardized outcome reporting in future research.
Study Limitations and Sources of Heterogeneity
This meta-analysis has several limitations that warrant consideration. Publication bias was identified for open surgery success rates and five-year survival outcomes, which may have influenced pooled estimates. An important limitation of this review is that all pooled estimates were derived from separate single-arm meta-analyses. Consequently, the study was not designed to perform direct statistical comparisons between open and endovascular strategies, and differences observed between pooled estimates should be interpreted as descriptive rather than comparative. Patients undergoing endovascular procedures are frequently older and have a higher operative risk profile, introducing substantial selection bias that may influence observed outcome differences. Therefore, the apparent advantages of one strategy over another cannot be interpreted as evidence of superiority and should instead be considered hypothesis-generating.
Furthermore, the definition of overall complications was not standardized across included studies, which may have influenced pooled complication estimates. Publication bias analyses should also be interpreted cautiously because several outcomes were reported by a limited number of studies, reducing the reliability of funnel plots and Egger’s tests.
Variability in outcome reporting was particularly notable for ICU stay duration and procedural success definitions (ranging from technical completion to valve performance metrics). Most included studies were retrospective, non-randomized, and subject to potential biases, including selection bias, confounding by indication, and unmeasured confounding. Additionally, small sample sizes, incomplete follow-up, and the presence of publication bias, particularly in bleeding and long-term survival outcomes, may affect the accuracy and generalizability of pooled estimates.
CONCLUSION
Both open and endovascular approaches appear to be feasible treatment options for patients with porcelain aorta. In this review, separate single-arm meta-analyses demonstrated acceptable short-term outcomes for both strategies, with differences observed in technical success, complication profiles, and recovery metrics. However, because pooled estimates were derived from separate non-comparative analyses and because substantial clinical heterogeneity and selection bias were present across studies, no conclusions regarding the superiority of one approach over the other can be drawn. Hybrid strategies remain promising but are supported by limited evidence. Further prospective studies with standardized definitions and longer follow-up are needed to determine optimal management strategies for this complex patient population.
REFERENCES
- Abramowitz Y, Jilaihawi H, Chakravarty T, Mack MJ, Makkar RR. Porcelain aorta: a comprehensive review. Circulation. 2015;131(9):827-36. [Crossref] [Google Scholar] [PubMed]
- Urbanski PP, Luehr M, Di Bartolomeo R, Diegeler A, De Paulis R, Esposito G, Bonser RS, et al. Multicentre analysis of current strategies and outcomes in open aortic arch surgery: heterogeneity is still an issue. European Journal of Cardio-Thoracic Surgery. 2016;50(2):249-55. [Crossref] [Google Scholar] [PubMed]
- Djaiani G, Fedorko L, Borger M, Mikulis D, Carroll J, Cheng D, et al. Mild to moderate atheromatous disease of the thoracic aorta and new ischemic brain lesions after conventional coronary artery bypass graft surgery. Stroke. 2004. [Crossref] [Google Scholar] [PubMed]
- Carrel T. Should the porcelain aorta be revisited in the era of transcatheter aortic valve replacement?. European Journal of Cardio-Thoracic Surgery. 2019;55(5):1010-1. [Crossref] [Google Scholar] [PubMed]
- Mayr B, Firschke C, Erlebach M, Bleiziffer S, Krane M, Joner M, et al. Transcatheter aortic valve implantation and off-pump coronary artery bypass surgery: an effective hybrid procedure in selected patients. Interactive CardioVascular and Thoracic Surgery. 2018;27(1):102-7. [Crossref] [Google Scholar] [PubMed]
- Vahanian A, Beyersdorf F, Praz F, Milojevic M, Baldus S, Bauersachs J, et al. 2021 ESC/EACTS Guidelines for the management of valvular heart disease: Developed by the Task Force for the management of valvular heart disease of the European Society of Cardiology (ESC) and the European Association for Cardio-Thoracic Surgery (EACTS). European heart journal. 2022;43(7):561-632. [Crossref] [Google Scholar] [PubMed]
- Useini D, Haldenwang P, Schlömicher M, Christ H, Naraghi H, Moustafine V, et al. Mid-term outcomes after transapical and transfemoral transcatheter aortic valve implantation for aortic stenosis and porcelain aorta with a systematic review of transfemoral versus transapical approach. The Thoracic and cardiovascular surgeon. 2020;68(07):623-32. [Crossref] [Google Scholar] [PubMed]
- Ramirez-Del Val F, Hirji SA, Yammine M, Ejiofor JI, McGurk S, Norman A, et al. Effectiveness and safety of transcatheter aortic valve implantation for aortic stenosis in patients with “Porcelain” aorta. The American journal of cardiology. 2018;121(1):62-8. [Crossref] [Google Scholar] [PubMed]
- Zahn R, Schiele R, Gerckens U, Linke A, Sievert H, Kahlert P, et al. Transcatheter aortic valve implantation in patients with “porcelain” aorta (from a Multicenter Real World Registry). The American journal of cardiology. 2013;111(4):602-8. [Crossref] [Google Scholar] [PubMed]
- Idrees J, Roselli EE, Raza S, Krishnaswamy A, Mick S, Kapadia S, et al. Aborted sternotomy due to unexpected porcelain aorta: does transcatheter aortic valve replacement offer an alternative choice?. The Journal of Thoracic and Cardiovascular Surgery. 2015;149(1):131-4. [Crossref] [Google Scholar] [PubMed]
- Thourani VH, Suri RM, Gunter RL, Sheng S, O’Brien SM, Ailawadi G, et al. Contemporary real-world outcomes of surgical aortic valve replacement in 141,905 low-risk, intermediate-risk, and high-risk patients. The Annals of thoracic surgery. 2015;99(1):55-61. [Crossref] [Google Scholar] [PubMed]
- Chandler J, Cumpston M, Li T, Page MJ, Welch VJ. Cochrane handbook for systematic reviews of interventions. Hoboken: Wiley. 2019;4(1002):14651858. [Crossref] [Google Scholar]
- Fekete JT, Győrffy B. MetaAnalysisOnline. com: web-based tool for the rapid meta-analysis of clinical and epidemiological studies. Journal of Medical Internet Research. 2025;27:e64016. [Crossref] [Google Scholar] [PubMed]
- Kramer B, Vekstein AM, Bishop PD, Lowry A, Johnston DR, Kapadia S, et al. Choosing transcatheter aortic valve replacement in porcelain aorta: outcomes versus surgical replacement. European Journal of Cardio-Thoracic Surgery. 2023;63(5):ezad057. [Crossref] [Google Scholar] [PubMed]
- Chang HW, Jeong DS, Cho YH, Sung K, Kim WS, Lee YT, et al. Replacement of calcified ascending aorta in patients undergoing aortic valve replacement. Journal of Thoracic Disease. 2017;9(11):4424. [Crossref] [Google Scholar] [PubMed]
- Salem M, Mohammad B, Huenges K, Friedrich C, Panholzer B, Cremer J, Hanyea A. Severe calcification of the ascending aorta detected incidentally in patients undergoing cardiac surgery. The Thoracic and Cardiovascular Surgeon. 2020;68(04):309-14. [Crossref] [Google Scholar] [PubMed]
- Sirin G, Sarkislali K, Konakci M, Demirsoy E. Extraanatomical coronary artery bypass grafting in patients with severely atherosclerotic (Porcelain) aorta. Journal of cardiothoracic surgery. 2013;8(1):86. [Crossref] [Google Scholar] [PubMed]
- Campanella C, Voss S, Schreyer J, Puluca N, Amabile A, Wirth F, Krane M, Ruge H. Analysis of Calcium Patterns in the Thoracic Aorta and Clinical Outcomes of TAVR Patients Presenting with Porcelain Aorta. Journal of Clinical Medicine. 2025;14(2):503. [Crossref] [Google Scholar] [PubMed]
- Fu J, Popal MS, Li Y, Li G, Qi Y, Fang F, et al. Transcatheter versus surgical aortic valve replacement in low and intermediate risk patients with severe aortic stenosis: systematic review and meta-analysis of randomized controlled trials and propensity score matching observational studies. Journal of Thoracic Disease. 2019;11(5):1945. [Crossref] [Google Scholar] [PubMed]
- Généreux P, Cohen DJ, Williams MR, Mack M, Kodali SK, Svensson LG, et al. Bleeding complications after surgical aortic valve replacement compared with transcatheter aortic valve replacement: insights from the PARTNER I Trial (Placement of Aortic Transcatheter Valve). Journal of the American College of Cardiology. 2014;63(11):1100-9. [Crossref] [Google Scholar] [PubMed]
- Zubarevich A, Zhigalov K, Szczechowicz M, Thielmann M, Rabis M, Van den Eynde J, et al. Simultaneous transaortic transcatheter aortic valve implantation and off‐pump coronary artery bypass: an effective hybrid approach. Journal of Cardiac Surgery. 2021;36(4):1226-31. [Google Scholar] [PubMed]
- Kapadia SR, Leon MB, Makkar RR, Tuzcu EM, Svensson LG, Kodali S, et al. 5-year outcomes of transcatheter aortic valve replacement compared with standard treatment for patients with inoperable aortic stenosis (PARTNER 1): a randomised controlled trial. The Lancet. 2015;385(9986):2485-91. [Google Scholar] [PubMed]
- Abe T, Ito T, Sunada M, Yoshizumi T, Kawamura A, Yamana K. Balloon occlusion of the ascending aorta without hypothermic circulatory arrest in valve surgery for patients with a porcelain aorta. In The Heart Surgery Forum 2010 Aug 18 (Vol. 13, No. 4, pp. 251-253). IMR Press. [Crossref] [Google Scholar] [PubMed]
- Asami M, Bernhard B, Demirel C, Okuno T, Stortecky S, Heg D, et al. Clinical outcomes following transcatheter aortic valve implantation in patients with porcelain aorta. Journal of cardiovascular computed tomography. 2022;16(3):215-21. [Crossref] [Google Scholar] [PubMed]
- Buz S, Pasic M, Unbehaun A, Drews T, Dreysse S, Kukucka M, Mladenow A, Hetzer R. Trans-apical aortic valve implantation in patients with severe calcification of the ascending aorta. European journal of cardio-thoracic surgery. 2011;40(2):463-8. [Crossref] [Google Scholar] [PubMed]
- De Paulis R, Maselli D, Scaffa R, Nardella S. Double-arterial cannulation for aortic valve replacement with porcelain aorta. European journal of cardio-thoracic surgery. 2009 Oct 1;36(4):769-70. [Crossref] [Google Scholar] [PubMed]
- Hartert M, Conzelmann LO, Mehlhorn U, Schnelle N, Werner C, Vahl CF. Cross-clamping a porcelain aorta: an alternative technique for high-risk patients. The Journal of Cardiovascular Surgery. 2014;59(5):737-45. [Crossref] [Google Scholar] [PubMed]
- Kempfert J, Van Linden A, Linke A, Schuler G, Rastan A, Lehmann S, et al. Transapical aortic valve implantation: therapy of choice for patients with aortic stenosis and porcelain aorta?. The Annals of thoracic surgery. 2010;90(5):1457-61. [Crossref] [Google Scholar] [PubMed]
- Lauten P, Kreutz J, Costello-Boerrigter LC, Schreiber M, Boerrigter G, Albert C, et al. Impact of porcelain aorta on outcomes in transfemoral aortic valve implantation (TAVI) with balloon-expandable valves. Open heart. 2025;12(1). [Crossref] [Google Scholar] [PubMed]
- Leyh RG, Bartels C, Nötzold A, Sievers HH. Management of porcelain aorta during coronary artery bypass grafting. The Annals of thoracic surgery. 1999;67(4):986-8. [Crossref] [Google Scholar] [PubMed]
- Nakasu A, Greason KL, Nkomo VT, Eleid MF, Pochettino A, King KS, et al. Transcatheter aortic valve insertion in patients with hostile ascending aorta calcification. The Journal of Thoracic and Cardiovascular Surgery. 2018;156(3):1028-34. [Crossref] [Google Scholar] [PubMed]
- Nishi H, Mitsuno M, Ryomoto M, Miyamoto Y. Comprehensive approach for clamping severely calcified ascending aorta using computed tomography. Interactive cardiovascular and thoracic surgery. 2010;10(1):18-20. [Crossref] [Google Scholar] [PubMed]
- Sasajima T, Inaba M, Azuma N, Akasaka N, Asada H, Uchida H, et al. Novel anastomotic method enables aortofemoral bypass for patients with porcelain aorta. Journal of vascular surgery. 2002;35(5):1016-9. [Crossref] [Google Scholar] [PubMed]
- Urbanski PP, Raad M, Wagner M, Heinz N, Reents W, Diegeler A. Cardiac surgery in patients with a porcelain aorta in the era of transcatheter valve implantation. European Journal of Cardio-Thoracic Surgery. 2013;44(1):48-53. [Crossref] [Google Scholar] [PubMed]
Article Processing Timeline
| 2-5 Days | Initial Quality & Plagiarism Check |
| 25-35 Days |
Peer Review Feedback |
| 45-60 Days | Total article processing time |
Ethics & Policies
Editorial & Management
Useful Links
Journal Highlights
Open Access Journals
Journal Flyer