


Journal of Nanoscience and Nanomaterials
ISSN:
3108-2084 (Online)
DOI Prefix (Crossref): 10.67238
 Download PDF
ABSTRACT
This study explores the photocatalytic degradation of some pharmaceutical pollutants using a CeO2@C3N4/WO3 nanocomposite under sun light illumination. X-ray diffraction, transmission electron microscopy, and X-ray photoelectron spectroscopy confirmed the association of all the components. The drugs Doxorubicin, Hydroxychloroquine, and Tinidazole were selected for photocatalytic degradation because they are highly toxic, resistant to natural breakdown, and frequently pollute the aquatic ecosystems. Therefore, they could not be treated with conventional biological and chemical treatment processes. These "emerging pollutants" are released from hospitals and homes, requiring special advanced photocatalytic light-based cleanup technologies to protect the environment and human health. The effect of increasing sun light power (10, 20, 40 and 80 W/m2), pharmaceutical concentrations (400, 600, 800, 1000 and 1500 mg/L), CeO2@C3N4/WO3 nanocomposite concentrations (1, 2, 4, 6 and 8 mg/L), time (10, 15, 20 and 25 min) and temperature (21, 25, 30 and 40oC), pH (4.0, 7.0, 8.0 and 10.0) on the photodegradation yields of Doxorubicin, Hydroxychloroquine and Tinidazole pharmaceuticals were investigated. Under 40 W/m2 sun light, 2 mg/L CeO2@C3N4/WO3 nanocomposites efficiently degraded 1000 mg/L Doxorubicin, Hydroxychloroquine and Tinidazole pharmaceuticals, achieving 100% of removal in 15 min of the reaction time at pH=7.0 and at a temperature of 25oC. It emphasizes the ability of CeO2@C3N4/WO3 composites prepared by a facile physical mixing of individual components for energy-efficient photocatalysis using sun light power in a sustainable and effective methodology for the photoremovals of Doxorubicin, Hydroxychloroquine and Tinidazole pharmaceuticals.
Keywords: CeO2@C3N4/WO3; Nanocomposite; Doxorubicin; Hydroxychloroquine; Pharmaceuticals; Sunlight; Tinidazole
INTRODUCTION
Pharmaceuticals are products used in large doses in daily life considered contaminants of emerging concern. Due to the large amounts of drugs consumed, the hydrogenic sources suffer from contamination processes that give rise to toxicological effects in humans despite their low concentrations [1]. Many medicines considered emerging contaminants are constantly detected in groundwater, wastewater treatment plants, and water supply. The inefficiency of conventional methods used in water treatment plants to remove the contaminant motivates the development of effective methods to treat effluent contamination [2]. According to the physicochemical properties of drugs, their degradation products, and the characteristics of the soils, these substances can reach the groundwater and contaminate the aquifers or remain retained in the soil, thus affecting the ecosystem and humans through the food chain [3]. Additionally, the portion of medicines not assimilated by the organism, as well as chemical substances administered to animals, usually become part of wastewater. Consequently, different ways of removing medicines in water have been studied [4]. The residues of the pharmaceutical compounds administered to humans and animals excreted as metabolites or in their native form—certainly contribute to water pollution [5]. Furthermore, the disposal of unused medications from households and manufacturing facilities also contributes to the spreading of pharmaceutically active compounds (PhACs) in the environment. These residues fall within the group of the so-called emerging pollutants, together with illegal drugs, endocrine disruptors, personal care products, and household substances [6]. Since PhACs are not easily degraded by the typical biological treatments in municipal wastewater treatment plants, together with all the toxic substances discharged from a treatment plant or a septic system, they can end up in surface waters or groundwaters that may ultimately be used as a source of drinking water [7,8].
Doxorubicin, sold under the brand name Adriamycin among others, is a chemotherapy medication used to treat cancer [9]. This includes breast cancer, bladder cancer, Kaposi's sarcoma, lymphoma, and acute lymphocytic leukemia [10]. It is often used together with other chemotherapy agents [9]. Doxorubicin is given by injection into a vein. Doxorubicin is a potent anthracycline chemotherapy medication used to treat a wide variety of cancers, including breast, bladder, lung, and ovarian cancers, as well as lymphomas and leukemias. It works by intercalating into DNA and inhibiting topoisomerase II, which ultimately halts the division and growth of cancer cells. Common side effects include hair loss, bone marrow suppression, vomiting, rash, and inflammation of the mouth [11]. Other serious side effects may include allergic reactions such as anaphylaxis, heart damage, tissue damage at the site of injection, radiation recall, and treatment-related leukemia [9]. People often experience red discoloration of the urine for a few days. Doxorubicin is in the anthracycline and antitumor antibiotic family of medications. It works in part by interfering with the function of DNA. Doxorubicin significantly decreases white blood cell (neutrophil) and platelet counts, increasing infection and bleeding risks (Myelosuppression). Dose-dependent risk of cardiomyopathy and heart failure. Patients often require lifelong cumulative dosage tracking (Cardiotoxicity). Hair loss is a common and widely expected side effect (Alopecia). Can cause a harmless, distinct red color in urine, sweat, and tears for a few days following treatment (Discoloration). Doxorubicin was approved for medical use in the United States in 1974 [12]. It is on the World Health Organization's List of Essential Medicines (World Health Organization, 2019). Versions that are pegylated and in liposomes are also available; however, they are more expensive [13]. Doxorubicin was originally made from the bacterium Streptomyces peucetius.
Hydroxychloroquine is an aminoquinoline pharmaceutical primarily used to prevent and treat malaria, and as an immunomodulatory disease-modifying antirheumatic drug (DMARD) for autoimmune conditions like systemic lupus erythematosus (SLE) and rheumatoid arthritis [14]. Hydroxychloroquine, sold under the brand name Plaquenil among others, is a medication used to prevent and treat malaria in areas where malaria remains sensitive to chloroquine. Other uses include treatment of rheumatoid arthritis, lupus, and porphyria cutanea tarda. It is taken by mouth, often in the form of hydroxychloroquine sulfate [15]. Common side effects may include vomiting, headache, blurred vision, and muscle weakness [16]. Severe side effects may include allergic reactions, retinopathy, and irregular heart rate [17,18]. Although all risk cannot be excluded, it remains a treatment for rheumatic disease during pregnancy [19]. Hydroxychloroquine is in the antimalarial and 4-aminoquinoline families of medication [20]. Long-term use requires routine eye exams, as it carries a rare but serious risk of retinopathy. In addition to, common side effects include nausea, stomach cramps, diarrhea, and skin rashes. In some patients, it can cause severe hypoglycemia or QT interval prolongation (leading to heart rhythm issues). Concurrent use with other medications that affect heart rhythm (e.g., azithromycin) significantly increases the risk of heart rhythm problems. Hydroxychloroquine was approved for medical use in the United States in 1955 [21]. It is on the World Health Organization's List of Essential Medicines [16]. In 2023, it was the 131st most commonly prescribed medication in the United States, with more than 4 million prescriptions [22,23]. Hydroxychloroquine has been studied for an ability to prevent and treat coronavirus disease 2019 (COVID-19), but clinical trials found it ineffective for this purpose and a possible risk of dangerous side effects [24]. Among studies that deemed hydroxychloroquine intake to cause harmful side effects, a publication by The Lancet was retracted due to data flaws [25]. The speculative use of hydroxychloroquine for COVID-19 threatens its availability for people with established indications [19].
Tinidazole is a synthetic 5-nitroimidazole antibiotic and antiprotozoal agent. It is highly effective against anaerobic bacteria and specific protozoa (e.g., Trichomonas vaginalis, Giardia lamblia, and Entamoeba histolytica). It works by penetrating the microorganism and damaging its DNA strands. Tinidazole, sold under the brand name Tindamax among others, is a medication used against infections caused by certain anaerobic bacteria and protozoa. It was developed in 1972 and is a prominent member of the nitroimidazole antibiotic class [26]. Tinidazole is a therapeutic alternative on the World Health Organization's List of Essential Medicines [27]. Tinidazole is a narrow spectrum antimicrobial drug used to treat infections caused by Helicobacter pylori, Entamoeba histolytica, Giardia spp. and Trichomonas vaginalis [28]. Drinking alcohol while taking tinidazole causes an unpleasant disulfiram-like reaction, which includes nausea, vomiting, headache, increased blood pressure, flushing, and shortness of breath. The drug is reduced by anaerobic organisms, creating intermediate products that disrupt DNA synthesis and damage existing DNA, leading to cell death. Nearly 100% absorption and bioavailability following oral administration. Protein Binding is approximately 12%. Metabolized in the liver, primarily via the CYP3A4 enzyme system. Half-life is nearly 12 to 14 hours, which allows for convenient once-a-day dosing. Excretion: Excreted primarily by the liver (feces) and kidneys (urine) [26].
CeO2 [Ceria or Cerium(IV) oxide] is a versatile, inert, and physically and chemically stable material with multiple and diverse applications [29,30,31]. Due to its hardness (Mohs scale 7), it was initially used as an abrasive material, but today it is used (alone or in binary or complex mixtures) in the field of heterogeneous catalysis (oxidation of hydrocarbons) or in the field of sensors, energy, and fuels such as solid oxide fuel cells, but also in water-splitting processes or photocatalysis [32,33,34]. CeO2 applications in the dermato-cosmetics industry and in the biomedical field (antibacterial effect) should also be mentioned here [35,36,37]. CeO2 is also possible to combine two or more properties, for example, the infrared filtering properties with the photocatalytic ones, to optimize practical applications [38-42]. CeO2 is semiconductor photocatalyst with various applications and similar properties to TiO2. However, its band gap is in the wide range of 2.6 to 3.4 eV, depending on the preparation method [43-46]. Furthermore, CeO2 exhibits promising photocatalytic activity. Nonetheless, the position of CB and VB limits its application as an efficient photocatalyst utilizing solar energy, even though CeO2 can absorb a larger fraction of the solar spectrum than TiO2. The photocatalytic and photo electrocatalytic activity of CeO2 in wastewater treatment can be improved by various modification techniques, including changes in morphology, doping with metal cation dopants and non-metal dopants, coupling with other semiconductors, combining it with carbon supporting materials, etc. [47-49]. The main properties that make CeO2 significant as a photocatalyst and photoelectrode material applied in the degradation of various pollutants result from its high band gap energy, high refractive index, high optical transparency in the visible region, high oxygen storage capacity, and chemical reactivity [50]. The other properties of CeO2 which should be mentioned include its high thermal stability, high hardness, oxygen ion conductivity, special redox features, and easy conversion between Ce+3 and Ce+4 oxidation states [51,52].
The two-dimensional (2D) g-C3N4 semiconductor has a wide range of applications in the environmental and energy fields because of its visible-light activity, unique physicochemical properties, excellent chemical stability and low-cost. Some important limitations of the photocatalytic activity of g-C3N4 are its low specific surface area, fast recombination of electrons and holes and poor visible light absorption.
To improve the above problems, the construction of a heterojunction with a suitable band gap semiconductor (co-catalyst) has been shown to be a good strategy to improve the photocatalytic performance of g-C3N4, such as g-C3N4-based conventional type II heterostructures, g-C3N4-based Z-scheme heterostructures, and g-C3N4-based p–n heterostructures, etc. [53-56]. The unique “Z” shape as the transport pathway of photogenerated charge carriers in Z-scheme photocatalytic systems is the most similar system to mimic natural photosynthesis in the many g-C3N4-based heterojunction photocatalysts [57-59]. The construction of Z-scheme photocatalytic systems can promote visible light utilization and carrier separation, and maintain the strong reducibility and oxidizability of semiconductors [60-62]. There are many studies on g-C3N4-based Z-scheme heterojunction photocatalysts, such as ZnO/g-C3N4, WO3/g-C3N4, g-C3N4/ZnS, g-C3N4/NiFe2O4, g-C3N4/graphene/NiFe2O4, NiCo/ZnO/g-C3N4 and Bi2Zr2O7/g-C3N4/Ag3PO4, respectively [63-65]. g-C3N4-based Z-scheme heterojunction photocatalysts have been made to improve the photocatalytic activity by combining with other semiconductor materials [18,66,67]. Therefore, there are some problems with the single photocatalytic method, such as low adsorption ability, limited active sites and low removal efficiency. The integration of the adsorption and photocatalytic degradation of various organic pollutants is considered as a suitable and promising technology. On the other hand, it is still essential to fabricate photocatalysts with superior adsorption and degradation efficiencies [68,69].
The conduction band (CB) of g-C3N4 is more negative than that of CeO2 (-1.24 eV and -0.44, respectively), while CeO2 possesses a relatively positive valance band (VB) (2.56 eV) compared to the conduction band of g-C3N4, would theoretically facilitate the electron transition within the coupled photocatalyst to prolong the electron hole separation [68]. Particularly, under the illumination of visible light, g-C3N4 can be excited to generate electron-hole pairs. Cerium (Ce) has exciting catalytic characteristics because 4d and 5p electrons sufficiently defend the 4f orbitals. The photogenerated electrons in the conduction band of CeO2 tend to transfer and recombine with the photogenerated holes in the valence band of g-C3N4. Like this, the larger number of photogenerated electrons accumulated in the conduction band of g-C3N4 can reduce the adsorbed O2 to form more O2 - ●. At the same time, the photogenerated holes left behind in the valence band of CeO2 can oxidize the adsorbed H2O to give OH●. But, the photocatalytic activity of the g-C3N4/CeO2 system would be significantly increased, leading to the decomposition of organic compounds by O2 - ● and OH● reactive species.
Tungsten trioxide (WO3) is an n-type semiconductor photocatalyst having a wide range of bandgap values (2.7–3.4 eV) providing a better extension into the visible range [70]. WO3 as alone photocatalyst suffers from the limitation of fast recombination of charge carriers, thereby restricting its potential during photocatalytic applications [71]. Several studies suggest that constructing a heterojunction between two metal oxides with suitable band arrangements can improve the charge carrier separation by suppressing the fast recombination [72,73]. Binary heterojunctions like WO3/Bi2WO6, WO3/ZnO, and WO3/TiO2, have been constructed to achieve superior charge separation and high photocatalytic yields [74,75,76]. Bimetallic W has always been very significance for its chemical inertness structure with low toxicity, exhibited corrosion-resisstant properties with large magnetic properties, and economic feasibility [77]. ZnWO4 possesses wolframite (WO4) structures with six-fold coordination sites for W exhibited superior activities under UV light [78].
WO3 is a highly promising material for visible light-driven photocatalysis. WO3 is a semiconductor with an indirect band gap within the visible light range (2.4–2.8 eV) [79]. It exhibits a valence band with a high oxidation potential for holes (+3.1–3.2 V vs. NHE), and it is resistance to photo-corrosion [80]. Despite these advantages, pure WO3 falls short as an effective photocatalyst for removing organic pollutants due to its relatively low conduction band potential (+0.5 V vs. NHE), which is significantly more positive than that oxygen (E ( / ) = −0.33 eV vs. NHE; O2/HO2 = − 0.046 V vs. NHE) [81,82]. The available oxygen cannot efficiently react with the photo-induced electrons from the conduction band of WO3, leading to a rapid recombination of charge carriers and a reduction in overall photocatalytic efficiency. The recent researches showed that when WO3 is combined with other co-catalysts and it exhibits promising photocatalytic activity by facilitating the reduction of oxygen through a multiple electron pathway (O2/H2O2 = + 0.68 V vs. NHE; O2/H2O = + 1.23 V vs. NHE) [83].
The photoremoval of pharmaceuticals like doxorubicin, hydroxychloroquine, and tinidazole is achieved using CeO2@C3N4/WO3 nanocomposites as highly efficient, visible-light-driven photocatalysts. This ternary heterojunction material maximizes the degradation of organic pollutants by enhancing light absorption, preventing charge recombination, and increasing the production of reactive oxidizing radicals. The application of this nanocomposite for environmental remediation and wastewater treatment involves several key mechanisms and operational characteristics.
To overcome the individual limitations of these compounds, the synthesis of CeO2@C3N4/WO3 composite photocatalysts can be a promising strategy, as this composite can take advantage of the complementary properties of its components. CeO2 helps to improve the efficiency of charge separation and facilitates redox reactions, while C3N4 contributes to improving the visible light absorption and acts as a stable support [84,85,86]. WO3, with its superior photocatalytic activity under visible light, further extends the composite’s light absorption capacity [87,88]. Additionally, the formation of heterojunctions between the individual components of the composite catalyst can create an efficient pathway for charge transfer, thereby reducing charge recombination and enhancing the overall photocatalytic efficiency. For example, many composites such as TiO2-WO3-CeO2, CeO2-WO3, WO3:CeO2 supported C3N4, TiO2-CeO2/C3N4 nanolayers, CeO2/BiVO4 anchored C3N4 nanocomposites, etc. have demonstrated superior performance in degrading organic pollutants, such as dyes and pharmaceuticals, under visible-light irradiation [89-93]. It has also shown promise in hydrogen evolution reactions (HER), a critical process for clean energy production [94,95]. Despite these advancements, the detailed understanding of the structure-activity relationship, charge transfer pathways, and the role of individual components in the composite remains an active area of research. Vignesh observed that for CeO2-TiO2/C3N4 (S-scheme heterostructure) composite, there is an improvement in the photocatalytic performance for the degradation of methylene blue (MB) dye (0.0262 per min) which is 6.1, 2.6, and 1.5 times greater than those of C3N4 (0.0043 per min), CeO2/C3N4 (0.0099 per min), and TiO2/C3N4 (0.0180 per min), respectively [92]. WO3/CeO2-supported C3N4 nanolayers exhibited exceptional degradation of orange G dye, i.e., 99.82% (visible light) and 99.73% (sunlight irradiation). Its performance was notably higher in acidic conditions (≥ 99%) compared to neutral conditions (≥ 93%) due to the synergistic interfacial interaction of WO3 and CeO2 on the C3N4 surface.
This study determines the photocatalytic degradation of some pharmaceutical pollutants such as Doxorubicin, Hydroxychloroquine and Tinidazole using a CeO2@C3N4/WO3 nanocomposite under sun light illumination. The effect of increasing sun light power (10, 20, 40 and 80 W/m2), pharmaceutical concentrations (400, 600, 800, 1000 and 1500 mg/L), CeO2@C3N4/WO3 nanocomposite concentrations (1, 2, 4, 6 and 8 mg/L), time (10, 15, 20 and 25 min) and temperature (21, 25, 30 and 40oC), pH (4.0, 7.0, 8.0 and 10.0) on the photodegradation yields of Doxorubicin, Hydroxychloroquine and Tinidazole pharmaceuticals were investigated. The structure and properties of the CeO2@C3N4/WO3 nanocomposites were determined with XRD, DRS UV-vis, PL spectra, SAED, HRTEM, TEM, N2 adsorption isotherms, pore distribution and XPS analyses.
MATERIALS AND METHODS
Synthesis of CeO2 (C) Nanoparticles, C3N4 (N), and CeO2@C3N4/WO3 (CNW) Nanocomposite
To prepare CeO2 nanoparticles, a chemical precipitation route was adopted in which 30 mL of 0.2 M Ce-precursor solution was prepared under continuous stirring until complete dissolution of Ce-salt had been confirmed. Then, 30 mL of 0.2 M NaOH was added (dropwise) to it, enabling the precipitation of the Ce-complex left in the flask overnight. The filtered precipitates were washed carefully in distilled H2O and C2H5OH followed by drying at 60oC (overnight) and heating at 400oC (@5oC/min for 120 min) to grow CeO2 crystallites [96]. The obtained white powder was ground using an agate mortar and characterized for structural, optical, and catalytic activity as described in the subsequent section. For the synthesis of C3N4, our previous report has been followed [97]. The crucible with thiourea was heated to 550oC (@5oC/min for 120 min). The yellow powder acquired was crushed using a mortar and pestle without acidic or alkaline treatment. To prepare the composite sample (CeO2@C3N4/WO3), the desired amount (Table 1) of constituents was mixed through wet grinding (acetone) for 6 h to stick the components to each other. CeO2@C3N4/WO3 nanocomposite production under laboratory conditions were shown in Figure 1.
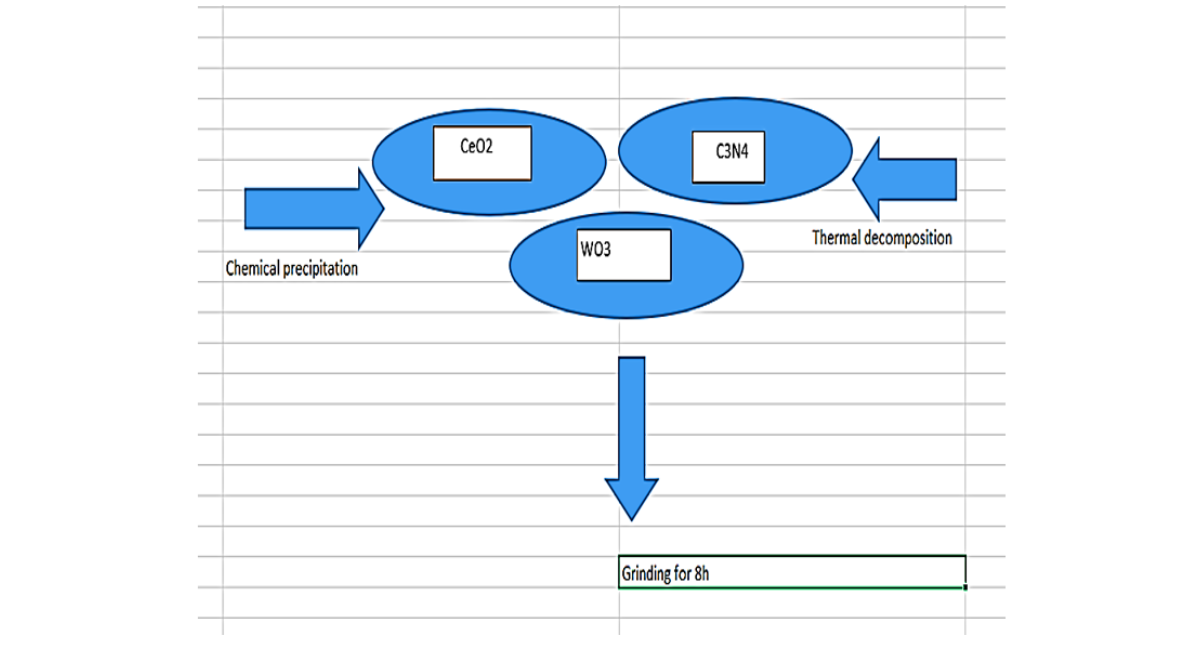
Figure 1: CeO2@C3N4/WO3 Nanocomposite Production Under Laboratory Conditions
Characterization Techniques
X-ray diffraction (XRD) patterns were recorded using a PANalytical X’pert-Pro diffractometer equipped with Cu-Kα radiation (1.5406 Å), with a step size of 0.05 o, over a 2θ range of 10–80 o, to determine the phase composition of the synthesized materials. The diffraction peaks were indexed using ICDD standard reference cards via X’pert HighScore software. Diffuse reflectance UV–vis (DR UV–vis) spectra were collected at room temperature using a Hitachi U-3900H double-beam spectrophotometer equipped with a diffuse reflectance accessory, scanning the 200–800 nm range. Photoluminescence (PL) spectra were obtained using a Cary Eclipse fluorescence spectrophotometer (G9800A), with an excitation wavelength of 280 nm and an emission range of 300–700 nm. To ensure consistency, equal amounts of well-ground powder were loaded into the sample holder, minimizing variations due to differing concentrations of scattering centers. Nitrogen adsorption-desorption isotherms were measured at – 196oC using a Quantachrome Autosorb iQ analyzer. Prior to analysis, samples were degassed at 150oC for 48 h. The specific surface area was calculated using the Brunauer-EmmettTeller (BET) method, while pore size distribution was evaluated using the Barrett-Joyner-Halenda (BJH) model. Morphological analysis was conducted using a high-resolution transmission electron microscope (JEOL ARM 200F) operated at 200 kV. Samples were prepared by dispersing the powder in alcohol, dropping it onto ultrathin carboncoated grids, and drying under low vacuum. X-ray photoelectron spectroscopy (XPS) measurements were performed in an ultra-high vacuum environment (~5 × 10− 9 mbar) using a Phoibo s150 NAP analyzer (Specs, Germany) with monochromatic Al-Kα radiation (1486.6 eV). To compensate for surface charging effects, spectra were calibrated by shifting the binding energy of the adventitious carbon (C 1s) peak to 284.8 eV. The size and structure of the CeO2@C3N4/WO3 nanocomposite samples were identified with high resolution transmission electron microscopy (HRTEM) Analysis. The obtained CeO2@C3N4/WO3 nanocomposite was collected and harvested by centrifugation (8000 rpm, 5 min), washed twice with deionized water and resuspended in ethanol (C2H6O) and dripped onto a carbon-coated copper (Cu) transmission electron microscopy (TEM) grid. Vacuum drying then occurred to the CeO2@C3N4/WO3 nanocomposite for 24 h at 25oC room temperature. The dry samples on the Cu grid were viewed and examined by TEM analysis recorded in a JEOL JEM 2100F, Japan under 200 kV accelerating voltage.
Selected Area Electron Diffraction (SAED) is a crystallographic technique primarily performed using a TEM. It isolates a specific microscopic region of a sample to generate diffraction patterns, which allows researchers to determine crystal orientation, measure lattice constants, and identify phases. Conventional electron diffraction has been rarely used as a standard tool for crystal identification mainly because the electron interactions with matter are about 10,000 times stronger than that of X-rays. As a result, the diffracted intensities are so much altered that they cannot be trusted, unless the crystal thickness is very thin. SAED patterns are a projection of the reciprocal lattice, with lattice reflections showing as sharp diffraction spots. By tilting a crystalline sample to low-index zone axes, SAED patterns can be used to identify crystal structures and measure lattice parameters. SAED is essential for setting up dark-field (DF) imaging conditions. Other uses of SAED include analysis of: lattice matching; interfaces; twinning and certain crystalline defects. SAED of nanocrystals gives ring patterns analogous to those from X-ray powder diffraction, and can be used to identify texture and discriminate nanocrystalline from amorphous phases. Precession electron diffraction (PED) is a modification to electron diffraction, which minimizes the effects of dynamical diffraction (which is basically independent of the crystal structure) that can plague structural solution. PED is applied to a range of different oxides for structure solution and refinement. As a result of this precession movement there is improvement over conventional SAED patterns, reflection diffracted intensity is much closer to the integrated intensity values, and it is much closer to kinematical (like X-Ray case). PED is installed on JEOL 2010F and JEOL 2100LaB6, Japan.
Photocatalytic Studies
All photocatalytic tests were performed in 500 mL photo-reactor made up of quartz glass. under 300 W sun light power with an intensity of 20 W/m2 for irradiation purpose. Reaction assembly has appropriate cooling systems of water channels to avoid excess heat produced during the photocatalytic examinations. Nonstop purging of air has been done to the reaction mixture during the treatment process. Centrifugation was utilized for separation of photocatalyst from irradiated solution. The photocatalytic reactor was operated with constant stirring (1.5 rpm) during the photocatalytic degradation process. 10 mL of the reacting solution were sampled and centrifugated (at 10000 rpm) at different time intervals.
The irradiation power was controlled by measuring the sunlight power with an intensity measuring device Merck. For high sun light power the reactor was set under sun light power on times between pm 13.00 and pm15.00. For median sun light power the reactor was set under sun light power on times between 11:00 (a.m.) and 12:00 (a.m.). For lowest sun light power the reactor was set under sun light power on times between pm 15.00 and pm16.00.
Photodegradation Mechanisms of CeO2@C3N4/WO3 Nanocomposites
The integration of CeO2, C3N4, and WO3 creates a highly effective interface. This typically forms an S-scheme charge transfer mechanism (Synergistic Heterojunction). In a typical (CeO2@C3N4/WO3) configuration, photoexcited electrons move between the conduction bands while holes migrate to the valence bands. This spatial separation prevents the rapid recombination of charge carriers (Enhanced Electron-Hole Separation). The separated electrons and holes interact with oxygen and water molecules in the aqueous solution to produce reactive oxygen species (ROS), primarily hydroxyl (OH●) and superoxide (O2- ●) radicals. These strong, unselective oxidizing radicals attack complex pharmaceutical molecules, breaking them down into harmless byproducts like CO2 and H2O. While effective under sunlight, the ternary composite is highly optimized for energy-efficient visible and white LED illumination. The catalyst is stable over multiple operational cycles and can frequently be reused 15 or more times with minimal deactivation. This targeted photoremoval is a sustainable method to prevent the accumulation of hazardous antineoplastic, antimalarial, and antibacterial drugs (like doxorubicin, hydroxychloroquine, and tinidazole) in aquatic ecosystems.
The staggered heterojunction created between CeO2, Graphitic C3N4, and WO3 significantly broadens the catalyst's light absorption range into the visible spectrum. The composite significantly minimizes electron-hole recombination losses compared to binary systems, allowing for more reactive species (such as hydroxyl radicals and holes) to attack pollutants. It is highly effective at degrading hazardous waste, including model organic dyes (like crystal violet) and pharmaceutical contaminants. The ternary composite demonstrates high stability, with studies showing it can be reused multiple times with minimal deactivation.
RESULTS AND DISCUSSION
XRD Analysis Results
XRD was carried out to confirm the phase formation without any undesired impurities in the powder samples. Fig. 2a represents the single-phase XRD spectra of prepared cubic CeO2 nanoparticles (CeO2; ICDD 00-043-1002) and graphitic C3N4 sheets (N). Meanwhile, the XRD spectra of W confirmed the presence of orthorhombic WO3 particles (ICDD 00-020-1324). XRD spectra of C suggested the formation of nanosized (6.74 nm) crystallites of CeO2. While W consists of much larger crystallites with 114.12 nm (average) as compared to CeO2. All the calculations to determine average crystallite size were performed after eliminating the instrumental contribution in overall full width at half maxima, using Pearson VII peak function in the sample and Si standard following β2 calc = β2 obs − β2 Si relation [98]. Fig. 2b confirmed the presence of individual constituents in CeO2@C3N4/WO3 nanocomposites (CeO2, C3N4, and WO3).
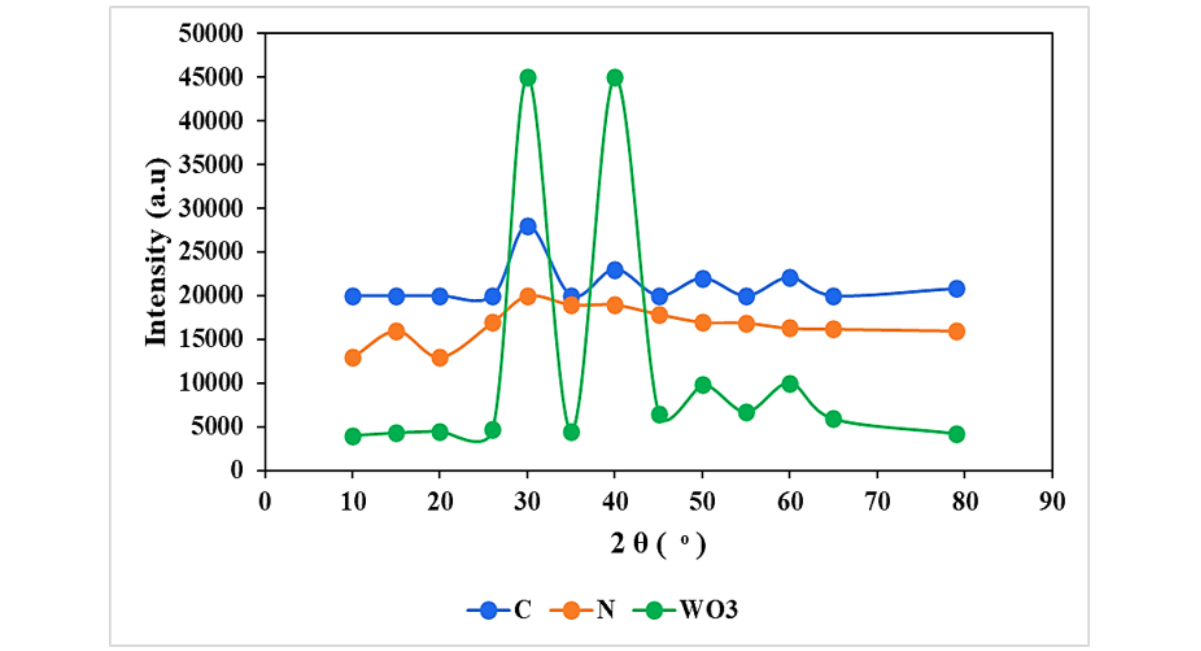
Figure 2 (a): Single-phase XRD Spectra of Prepared Cubic Ceo2 Nanoparticles
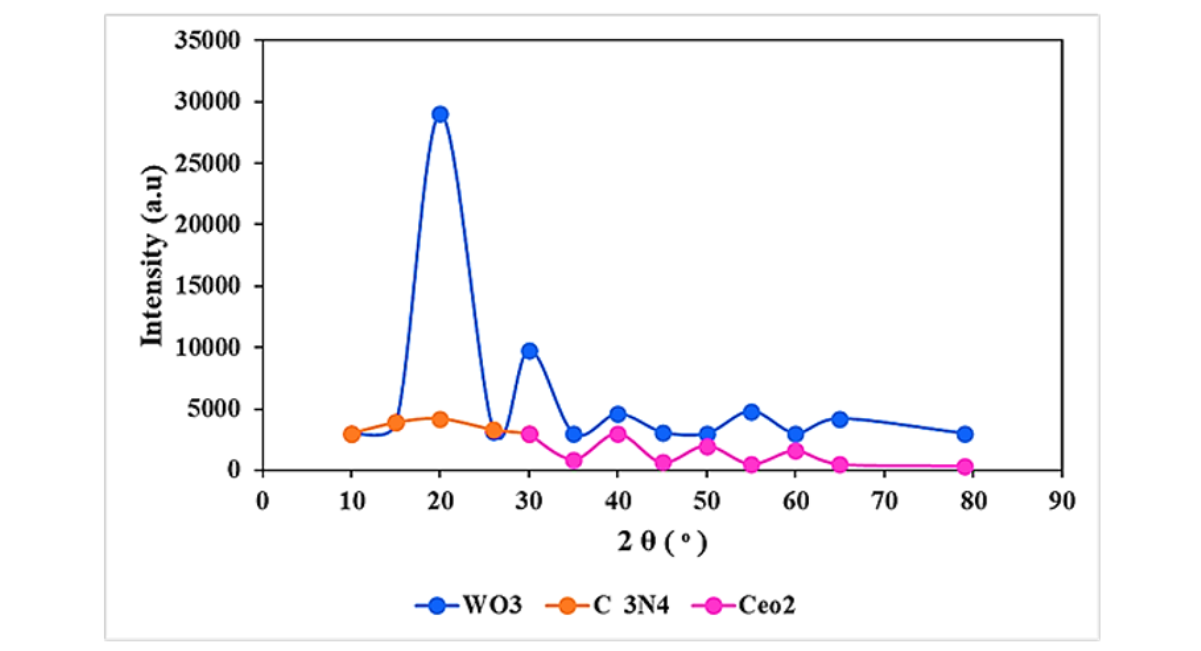
Figure 2 (b): Individual Constituents in Ceo2@C3N4/WO3 Nanocomposite. (C: Ceo2, N: C3N4, W: WO3).
SAED Patterns Results
SAED pattern (inset of Fig. 3a) also exhibited concentric rings supporting the formation of nanocrystallites of CeO2. Fig. 3c and d shows the TEM micrographs at low and high magnifications, respectively. General scans were used to determine the average particle size of WO3 powder, which was 120.36 nm.
HRTEM Results
HRTEM confirmed the presence of orthorhombic WO3 with 0.405 nm as the interplanar spacing of the (001) plane. Fig. 3e and f confirmed the successful formation of a 2D sheet-like morphology of grap hitic C3N4 from thiourea.
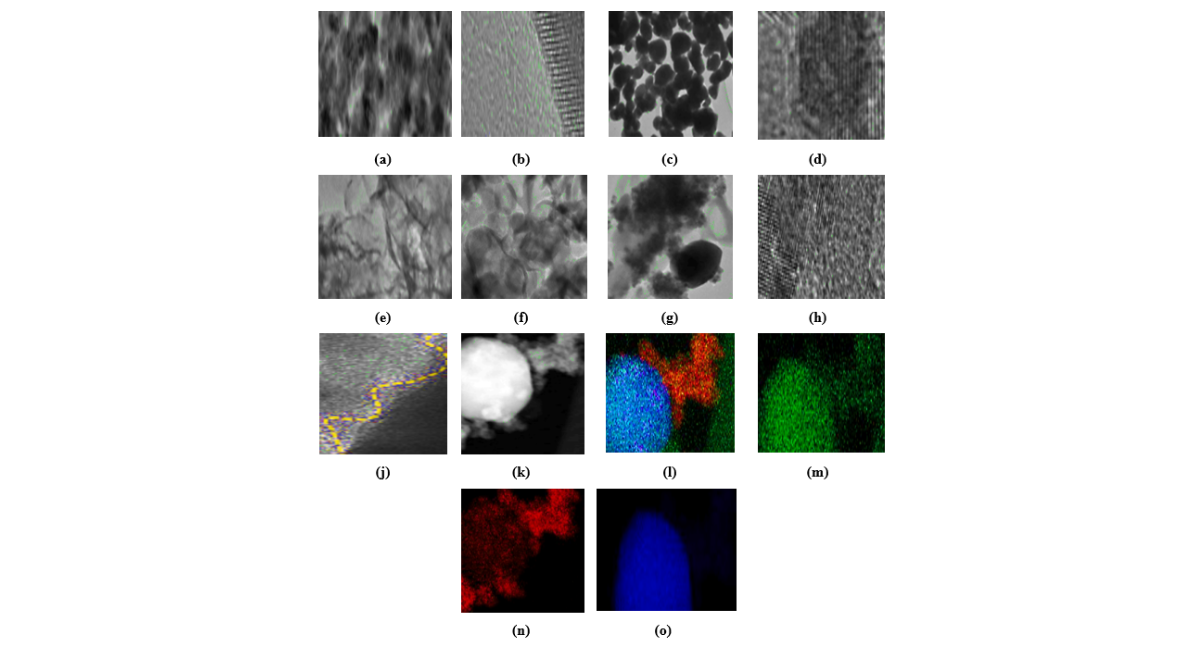
Figure 3. TEM and HRTEM of (a, b) prepared CeO2 nanoparticles, (c, d) procured WO3, (e, f) prepared C3N4 sheets, (g) TEM image of CeO2@C3N4/WO3 nanocomposite, and (h–j) highresolution image confirming the presence of all individual components (CeO2, WO3 and C3N4). (k–o) HAADF-STEM image and EDS elemental mapping images of CeO2@C3N4/WO3 composite: Overlay of N-K edge, Ce-L edge, and W-M edge, respectively.
TEM Analysis Results
TEM was performed, as shown in Fig. 3, to confirm and understand the morphological features of prepared samples (CeO2 and C3N4) and procured WO3. Fig. 3a and b represents the low- and high-resolution micrographs of sample CeO2 supporting the XRD results with average particle size 7.85 nm and lattice fringing of 0.328 nm of (111) plane of cubic CeO2 lattice.
Fig. 3g represents the TEM micrograph of the CeO2@C3N4/WO3 nanocomposites sample in which three different features have been observed that are associated with the individual constituents, i.e., C3N4 (sheet-like translucent), CeO2 (small particles), and WO3 (larger dark particles). Further, the confirmation was also carried out by HRTEM and high-angle annular dark-field scanning transmission electron microscopy (HAADF-STEM) as shown in Fig. 3h–j and 3k-o, respectively. Furthermore, the surface characteristics of catalysts govern the reaction kinetics during illumination, providing the surface area for molecule adsorption.
N2 Sorption Isotherms and Pore Distribution
Fig. 4 represents the BET analysis of CeO2@C3N4/WO3 and all the constituents (i.e., CeO2, C3N4, and WO3). Sample C3N4, WO3, and CeO2@C3N4/WO3 exhibited type IV isotherm with H3 hysteresis, suggesting the presence of a combination of meso- and macropores (Fig. 4b) in these materials. While sample C exhibited a slightly different shape of the H3 hysteresis loop, suggesting the presence of mesoporous CeO2 powder with blocking at broader pore necks [99]. Table 1 summarizes the results of Brunauer-Emmett-Teller (BET) analysis with a higher specific surface area (SSA) of 84 m2/g for CeO2@C3N4/WO3 nanocomposites as compared to C3N4 and WO3, while CeO2 exhibited the highest SSA of 148 m2/g. Here, smaller size of CeO2 particles might be responsible for the reduced SSA of CeO2@C3N4/WO3 nanocomposites due to pore blockage.
|
Samples |
Compositions (wt.%) |
Band gap (eV) |
BET SSA (m2/g) |
Average pore size (nm) |
Adsorption of Pharmaceuticals |
Photoremoval of Phgarmaceuticals |
||||
|
CeO2 |
WO3 |
C3N4 |
Adsorption (%) |
Time (min) |
Desorption (%) |
Time (min) |
||||
|
C |
100 |
- |
- |
3.32 |
1.48 |
3.5 |
81.9 |
120 |
84.3 |
60 |
|
N |
- |
- |
100 |
3.03 |
97 |
3.7 |
70.9 |
120 |
71.7 |
60 |
|
W |
- |
100 |
- |
3.11 |
9 |
3.7 |
20.2 |
120 |
27.2 |
60 |
|
CNW |
10 |
10 |
80 |
3.05 |
84 |
3.1 |
65.0 |
120 |
100 |
25 |
|
Note: C: CeO2 nanoparticles, N: C3N4 nanoparticles, CNW: CeO2@C3N4/WO3 nanocomposites |
||||||||||
Table 1: Sample Composition, Optical, and Surficial Characteristics of Prepared Samples
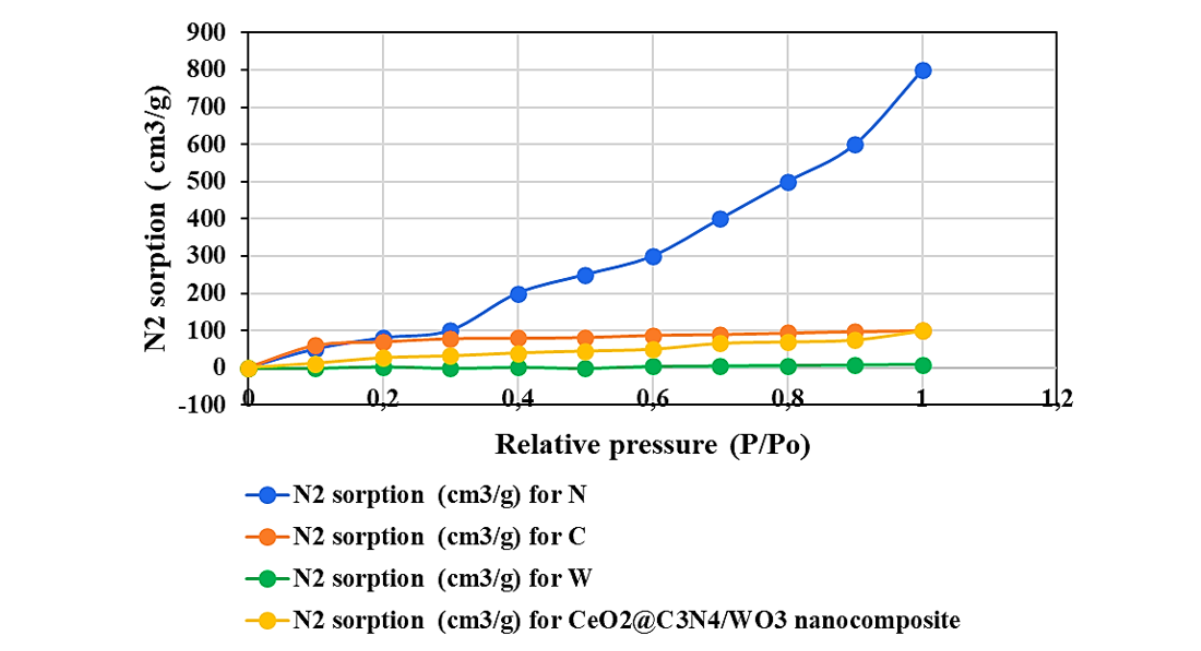
Figure 4 (a): N2 Sorption Isotherms of the Prepared C (Ceo2), N (C3N4), CNW (Ceo2@C3N4/WO3), and Procured W (WO3) Samples
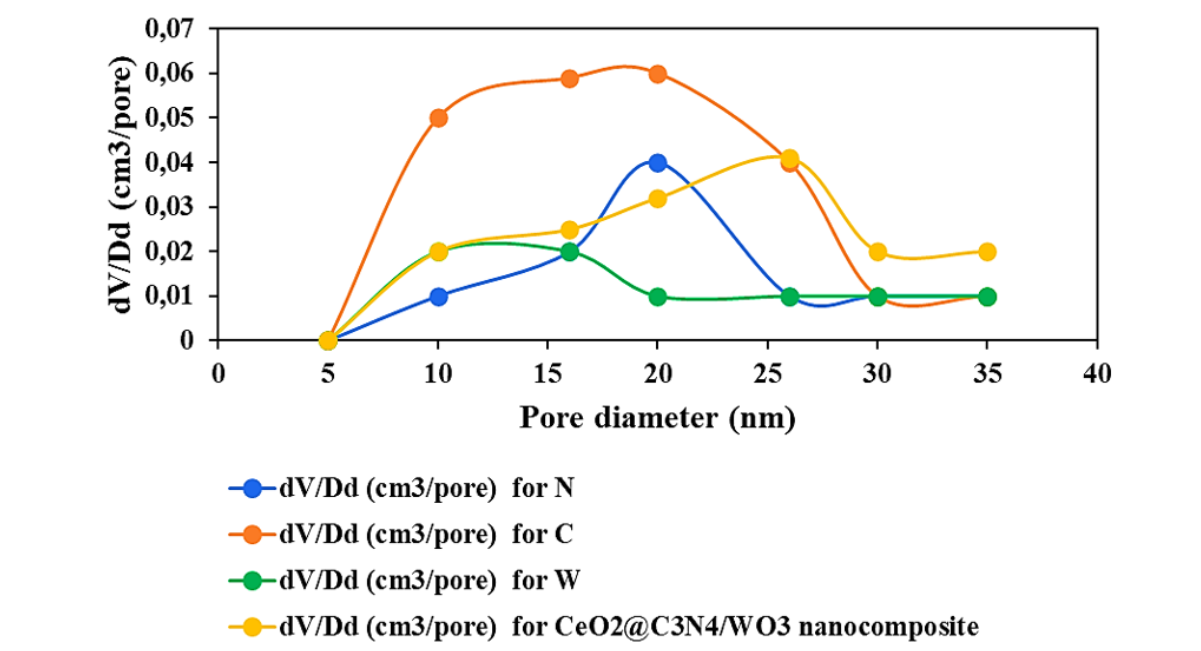
Figure 4 (b): Pore Diameters of the Prepared C (Ceo2), N (C3N4), CNW (Ceo2@C3N4/WO3), and Procured W (WO3) Samples
XPS Analysis Results
Before evaluating the catalytic performance efficiency of the prepared semiconductor samples (CeO2, C3N4, WO3) and their composite (CeO2@C3N4/WO3), it is essential to analyze their elemental composition and structural modifications. This investigation is crucial for understanding the pathway leading to optimal photochemical reactions. Fig. 5 represents the comparative HR XPS spectra of all the individual elements present in the semiconducting compounds (CeO2, C3N4, WO3) and CeO2@C3N4/WO3 nanocomposite sample. The spectral data of each element was analyzed on peakfit software with Shirley background and a Gaussian peak function [98]. O1s spectra of CeO2, and WO3 (Fig. 5a and b, respectively) indicated the presence of two major species of oxygen i.e., lattice oxygen (O-Ce at 529.56 eV and O-W at 529.57 eV) and non-lattice oxygen (or O-defects at 530–532 eV) along with minor presence of hydroxyl group (533.06 eV in C) in the form of adsorbed water molecules [100].
The attachment of three components altogether yielded a significant elemental modification on the surface of the powder sample, as shown in Fig. 5c. Along with the presence of lattice (overlapping O-Ce and O-W) and non-lattice oxygen, C-OH (at 533.41 eV), and O-C=O (at 535.06 eV) confirmed the presence of carbon-based functionalities of C3N4 in CeO2@C3N4/WO3 [101]. Interestingly, the mechanical mixing of all the constituents altered the overall concentration of non-lattice oxygen or O-defects, which surely participate in photochemical reactions through effective trapping of charge carriers and hindered recombination of photoexcited electrons. Because of composite formation through mechanical mixing, the comparative oxidation states of cationic counterparts (i.e., W and Ce) have been shown in Fig. 5d–g. The procured WO3 powder exhibited a pair of doublets, suggesting the presence of dual oxidation states, i.e., W6+ and W5+ centering at 34.77 and 34.72 eV (W 4f7/2), respectively, as shown in Fig. 5d. While the mechanical mixing of all three constituents yielded significant shifting of binding energies of both oxidation states to 38.21 and 37.26 eV (W 4f7/2) with an almost 17% (36.20%–53.20%) enhancement in W5+ concentration, shown in Fig. 5e [100].
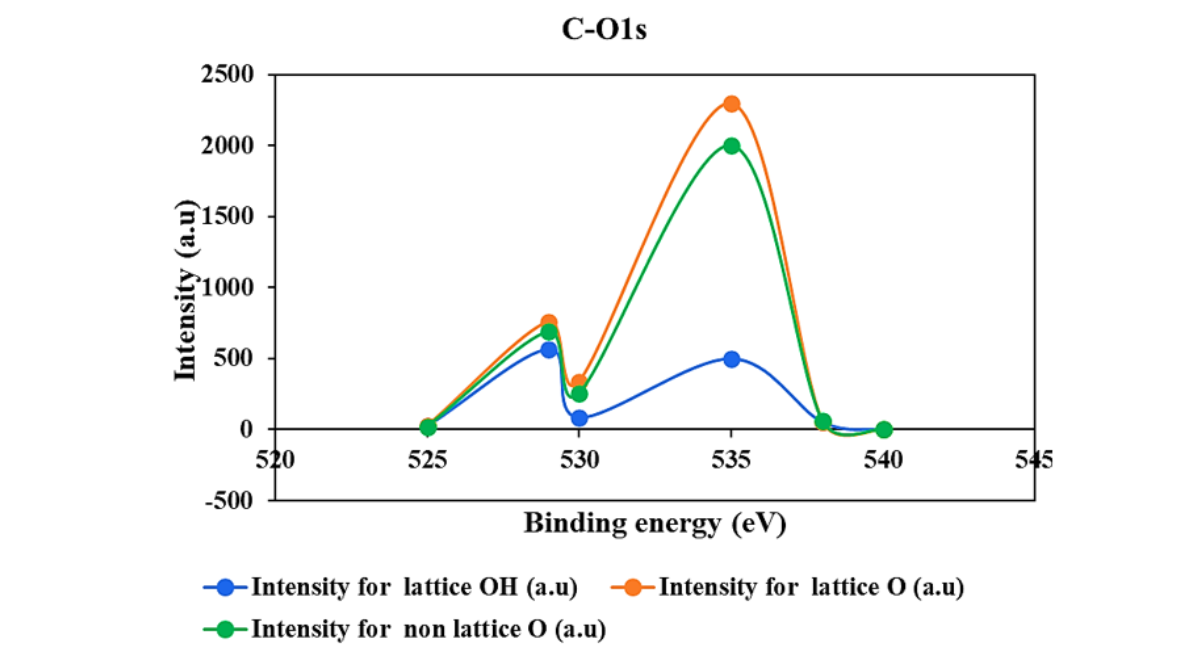
Figure 5a: O1s Spectra of C (Ceo2) In Ceo2@C3N4/WO3 Nanocomposite
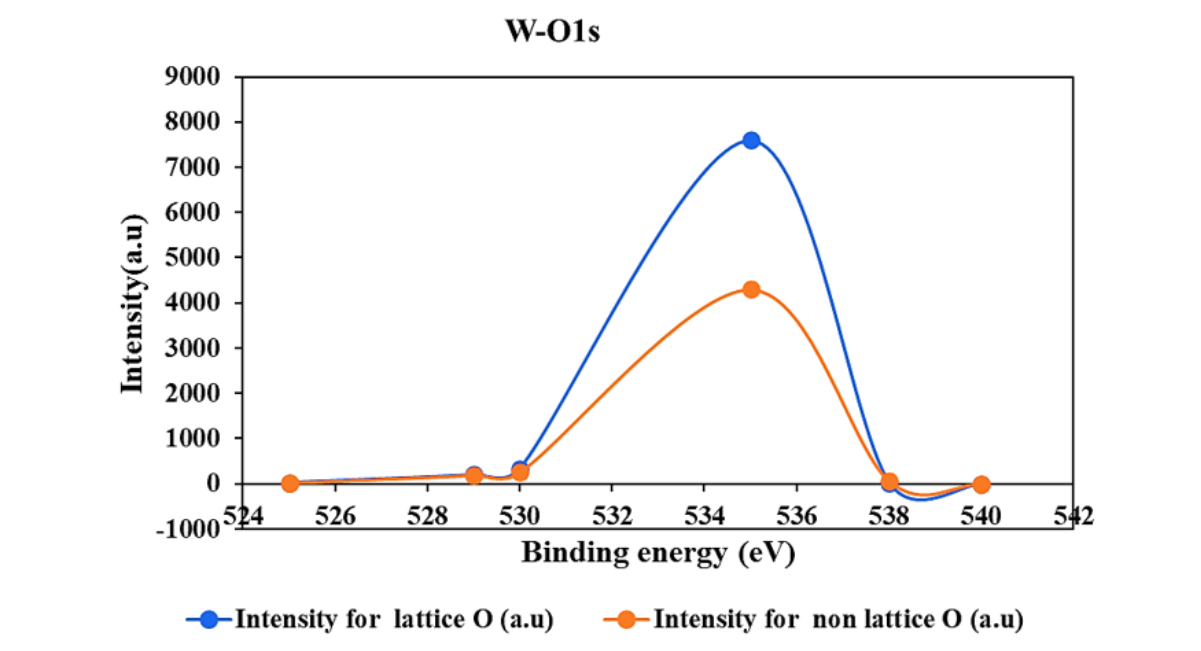
Figure 5b: O1s Spectra of W (WO3) In Ceo2@C3N4/WO3 Nanocomposite
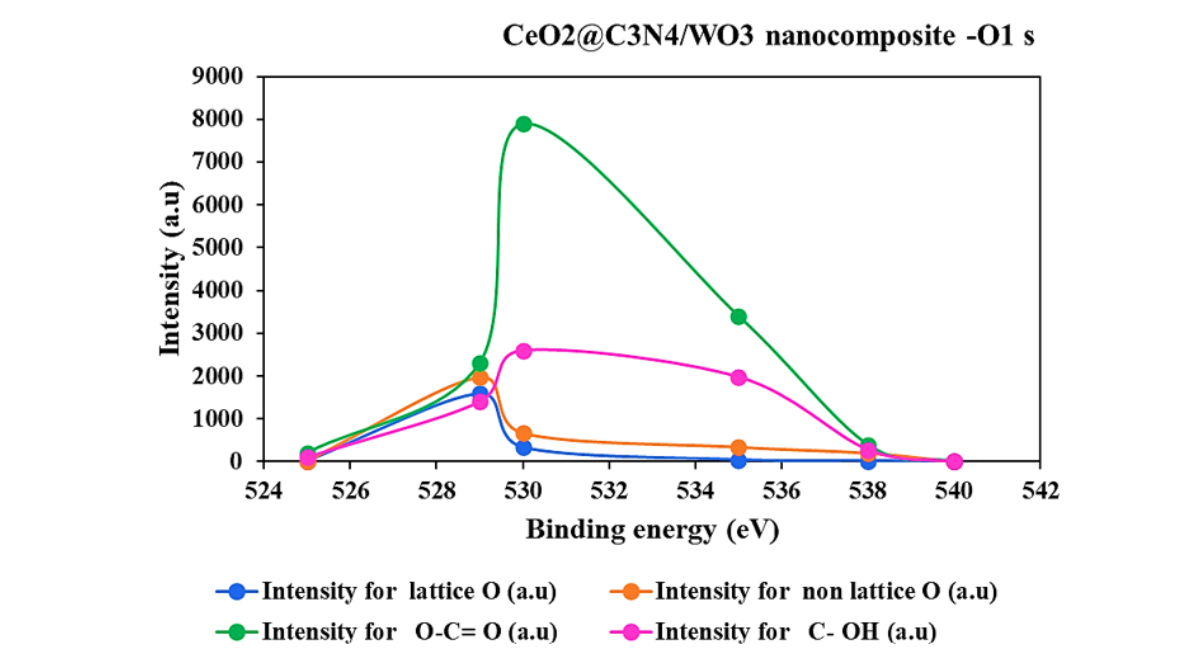
Figure 5c: Elemental Modification on the Surface of the Ceo2@C3N4/WO3 Nanocomposite Powder Sample
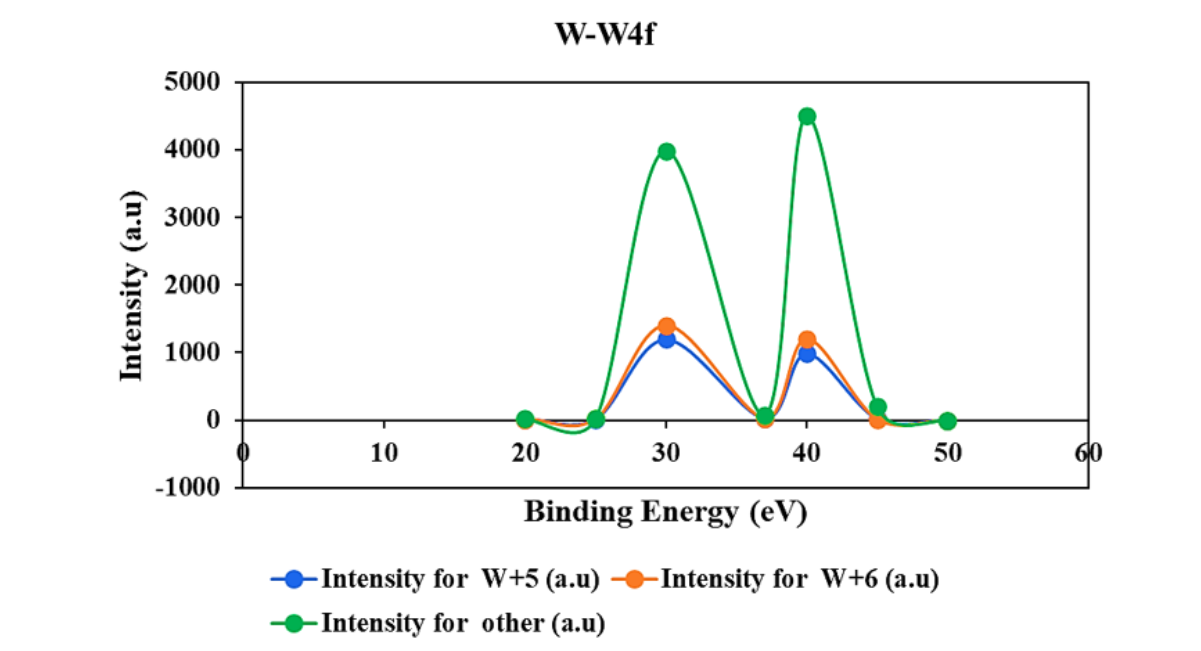
Figure 5d: W6+ and W5+ disturbances in W 4f
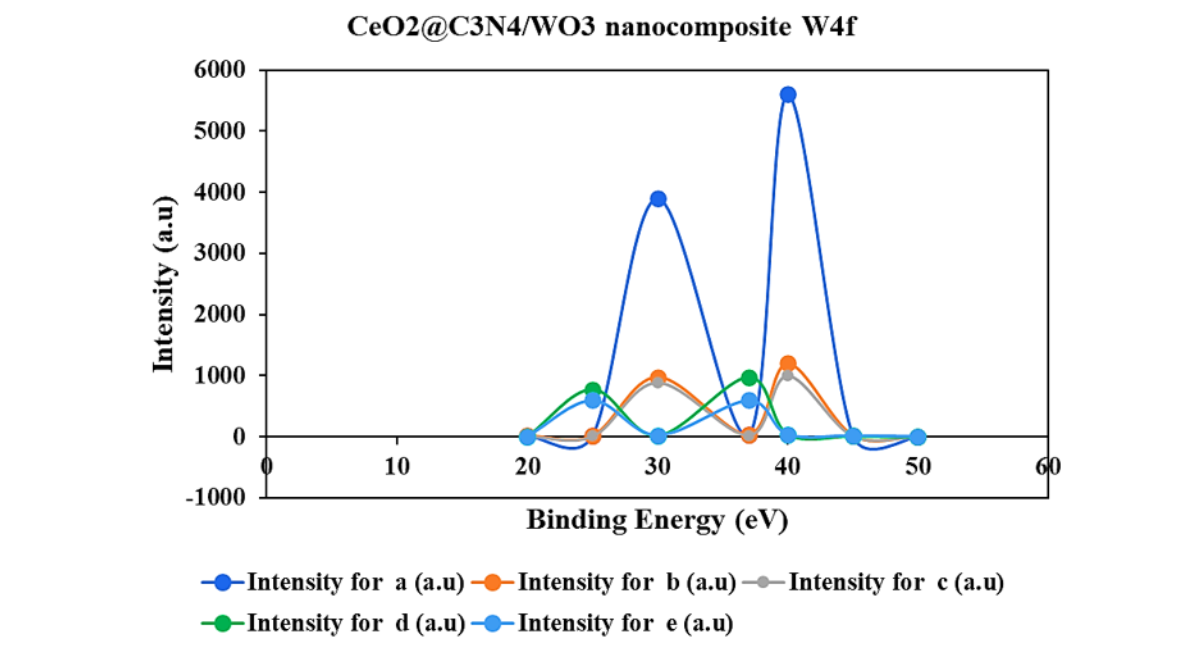
Figure 5e: W5+ disturbances in W 4f
Elemental Structure of CeO2@C3N4/WO3 Nanocomposite
Fig. 5f and g represents the elemental modulations of Ce3d because of composite formation. It was found that a combination of Ce4+ (883.46, 889.01, and 898.36 eV) and Ce3+ (882.81 eV) was formed in the prepared sample ‘C’. While the formation of the composite sample exhibited modifications of the Ce3+/Ce4+ ratio, which might play an extremely critical role in overall photocatalytic performance. Similar elemental modulation has already been reported earlier for the photocatalytic removal of rhodamine B dye under UV–visible irradiation. It was found that the concentration of Ce3+ (884.26 and 887.51 eV) has been increased by modulating the lattice oxygen in the form of non-lattice oxygen or O-defects (i.e., vacancies) as shown in Fig. 5g.
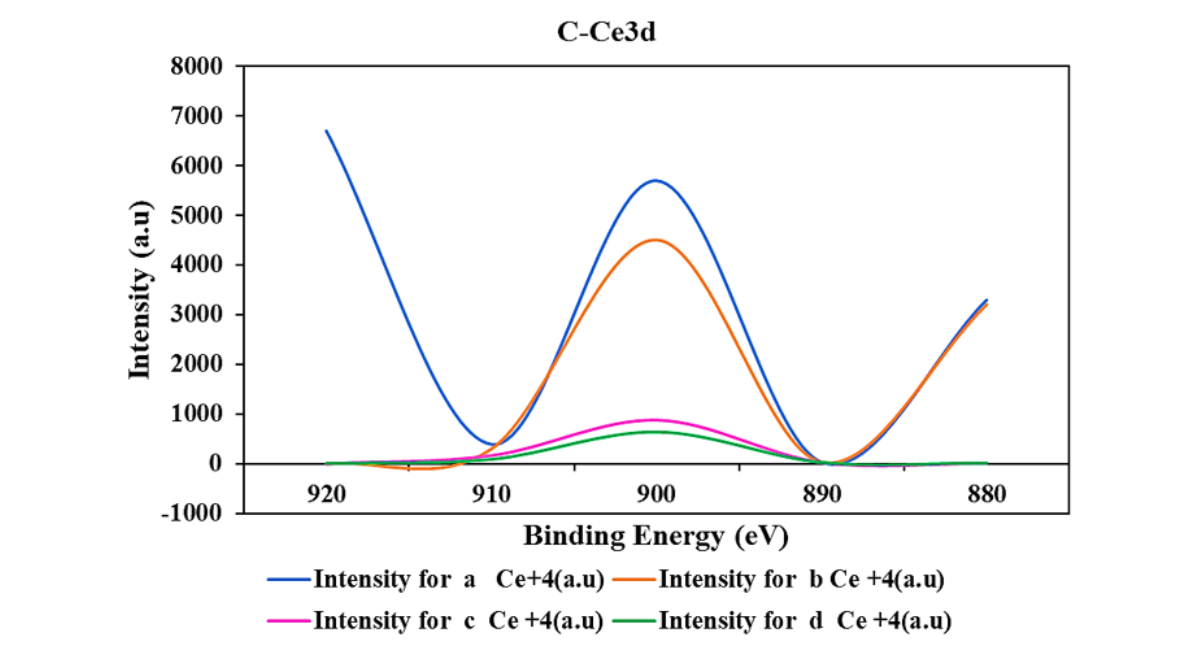
Figure 6a: Elemental Modulations of Ce 3d in CeO2@C3N4/WO3 Nanocomposite
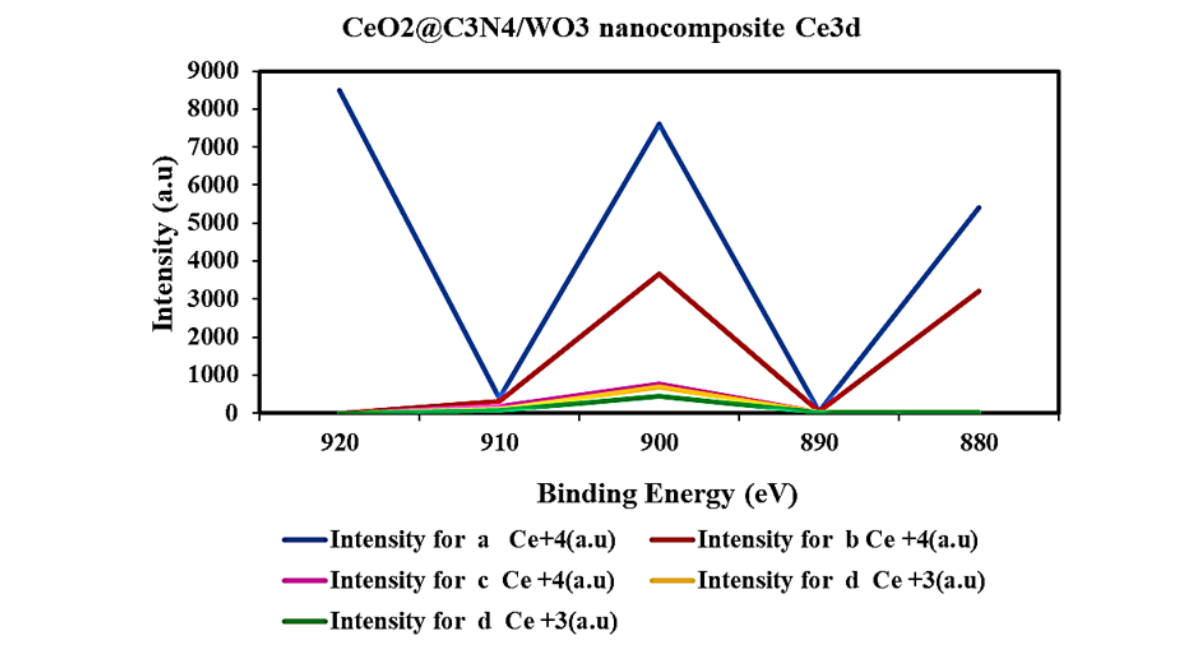
Figure 6b: Elemental Modulations of Ce 3d in CeO2@C3N4/WO3 Nanocomposite
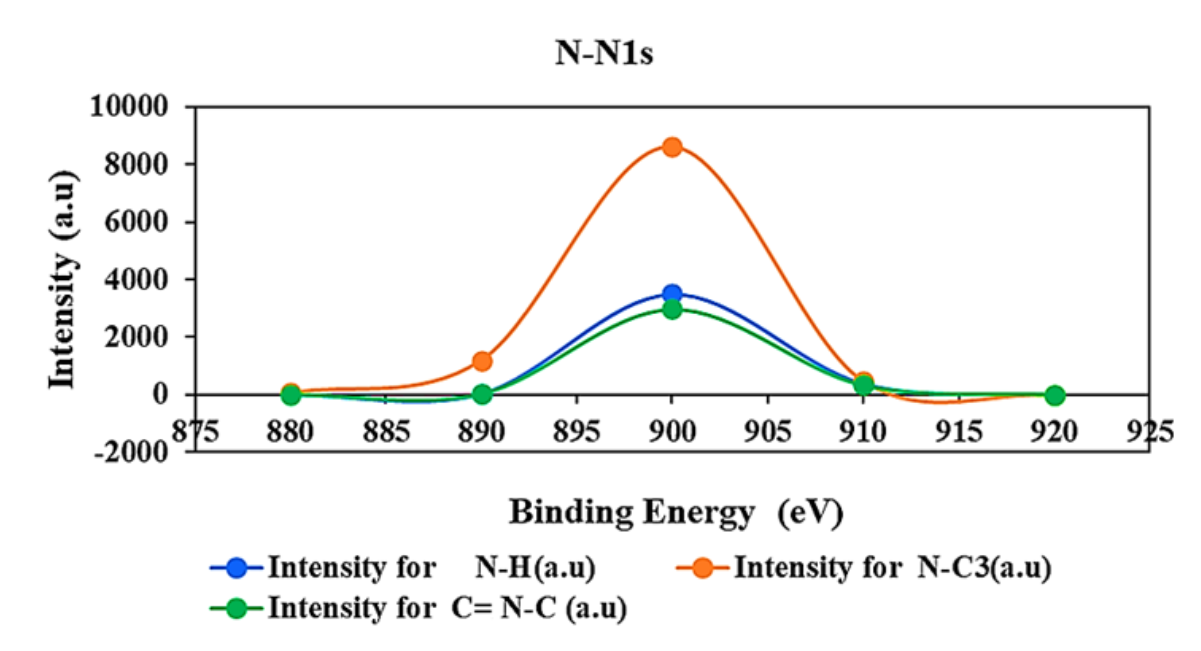
Figure 6c: XPS Spectra of N 1s of the Prepared C3N4 (N) and CeO2@C3N4/WO3 Nanocomposite Sample
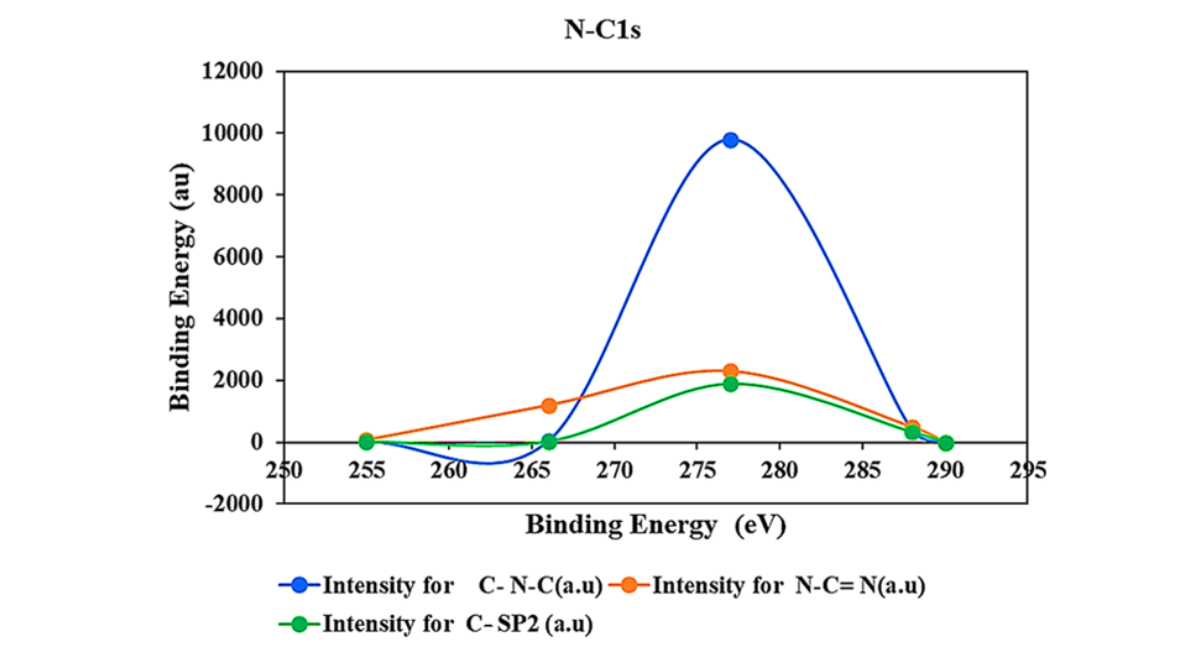
Figure 6d: Elemental Carbon exhibited C-sp2, N-C=N, and C-N-C Functional Groups in the Prepared N Sample
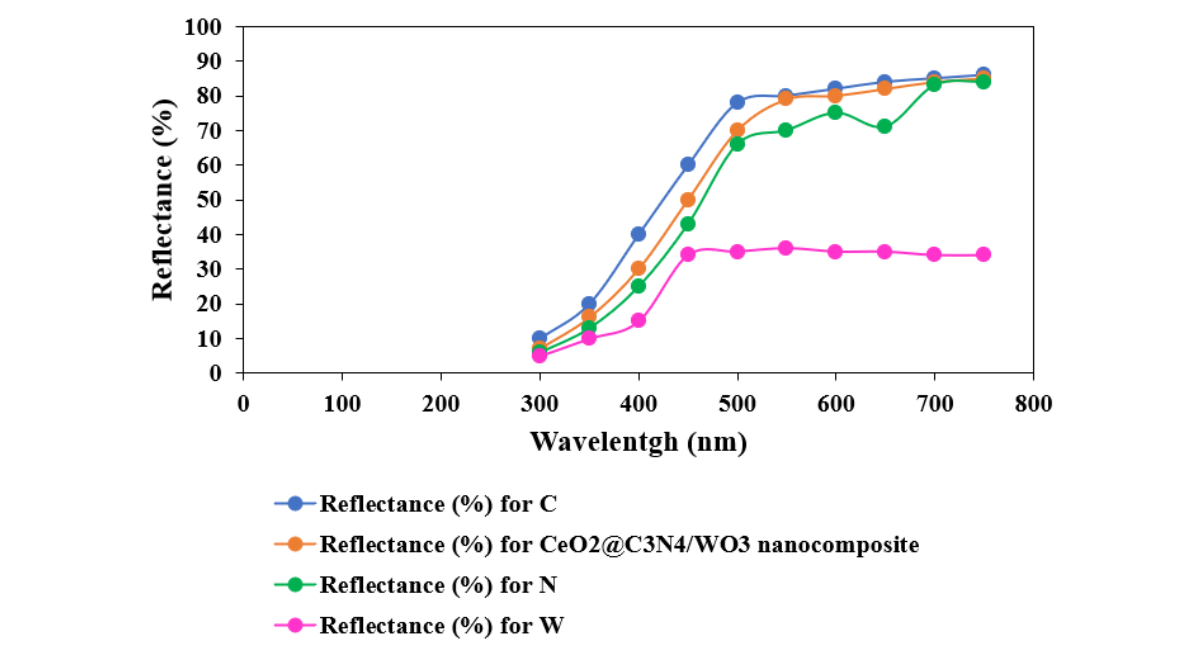
Figure 6e: C (CeO2), W (WO3) and N (C3N4) Components in CeO2@C3N4/WO3 Nanocomposite
Due to the composite formation, the associated elemental modifications in WO3 and CeO2 have been discussed. Here, the influence of composite formation on the elemental alterations in C3N4 is discussed. Fig. 5h and i represents HR XPS spectra of N 1s of the prepared C3N4 and CeO2@C3N4/WO3 sample, in which comparative chemical alterations have been observed. HR-XPS spectra of N suggested the presence of three different N-species, i.e., C=N-C, N-C3, and N-H positioned at 398.06, 399.54, and 401.34 eV, respectively [101]. Because of composite formation, the mechanical mixing yielded a significant shifting (0.8 eV) of these binding energies along with the inclusion of additional binding energy C-NHx at ~402 eV, which might be associated with the introduction of N-functionalities as shown in Fig. 5i. Further, the elemental carbon exhibited C -sp2, N-C=N, and C-N-C functional groups at 284.14, 287.64, 288.69 eV (respectively) in the prepared N sample as shown in Fig. 5j. Here, the formation of composite resulted in significant shifting of N-C=N (− 0.09 eV) and C-N-C (0.86 eV) to 287.55 and 289.55 eV (respectively) along with the inclusion of a new functional groups i.e., C-O at 285.95 eV and Ce4s at 290.35 eV suggesting successful attachment with other components (i.e., WO3 and CeO2) as shown in Fig. 5k [102,103].
Optical Properties
Before exploring the photocatalytic characteristics, it is necessary to identify the optical features of the samples, aiming at sufficient photon absorption and excitation energy. Fig. 7 represents the DR spectra of the powder samples, in which samples CeO2 and WO3 exhibited a quick reduction in reflectance between 450 and 350 nm. While C3N4 and CeO2@C3N4/WO3 exhibited a double electronic transition, gradual (600-450 nm) and sharp (450-400 nm) reduction. Further, the band gap was determined by using Kubelka Munk function, shown in Fig. 7.
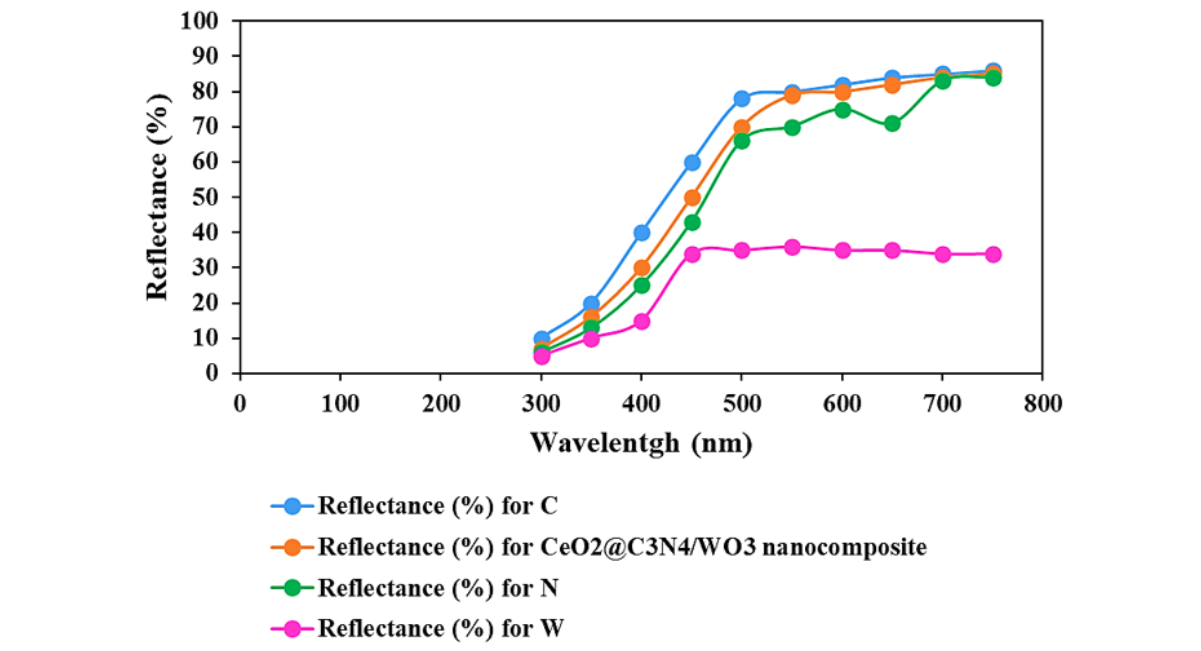
Figure 7: DR Spectra of the CeO2@C3N4/WO3 Nanocomposite Powder Samples. (C: CeO2, N: C3N4, W: WO3).
Further, the band gap was determined by using Kubelka Munk function, shown in Fig. 8 and listed in Table 1. CeO2@C3N4/WO3 exhibited a similar optical band gap (~3.05 eV) value to that of sample N, as given in Table 1, which is less than samples CeO2 and WO3. As far as photochemical reaction kinetics are concerned, the photon absorption and generation of excitons are extremely critical, while the recombination rate of excitons also plays an important role.
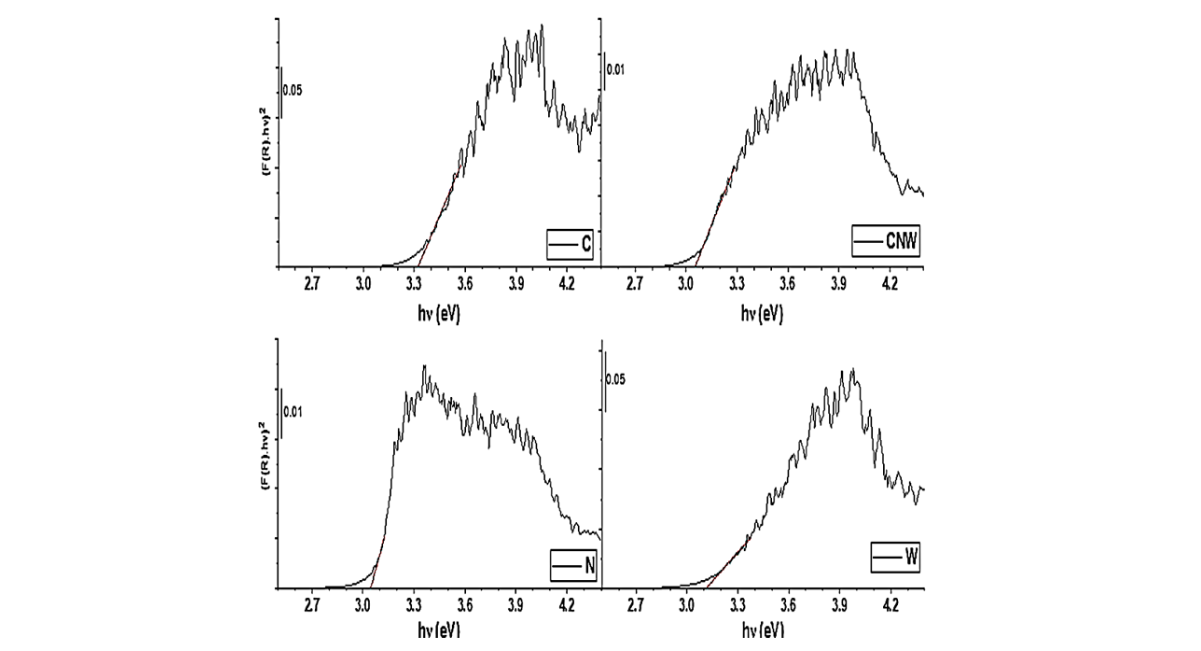
Figure 8. Calculation of Band Gap by Kubelka Munk Function { [F(R).hv]2 versus hv (eV) }.
Therefore, Fig. 9 represents the photoluminescence emission spectra of the prepared samples. The photoemission spectra were recorded after the excitation of the samples by using a 280 nm laser. Here, sample C3N4 exhibited a broad emission between 400 and 650 nm, while CeO2 and WO3 exhibited major emission near 382 nm. CeO2@C3N4/WO3 sample exhibited a much lower intensity of emissions between 400 and 650 nm and near 382 nm than C3N4 and CeO2, respectively. These results clearly show that the formation of CeO2@C3N4/WO3 composite resulted in much more efficient separation of photogenerated charge carriers when compared to individual components of the composite catalysts.
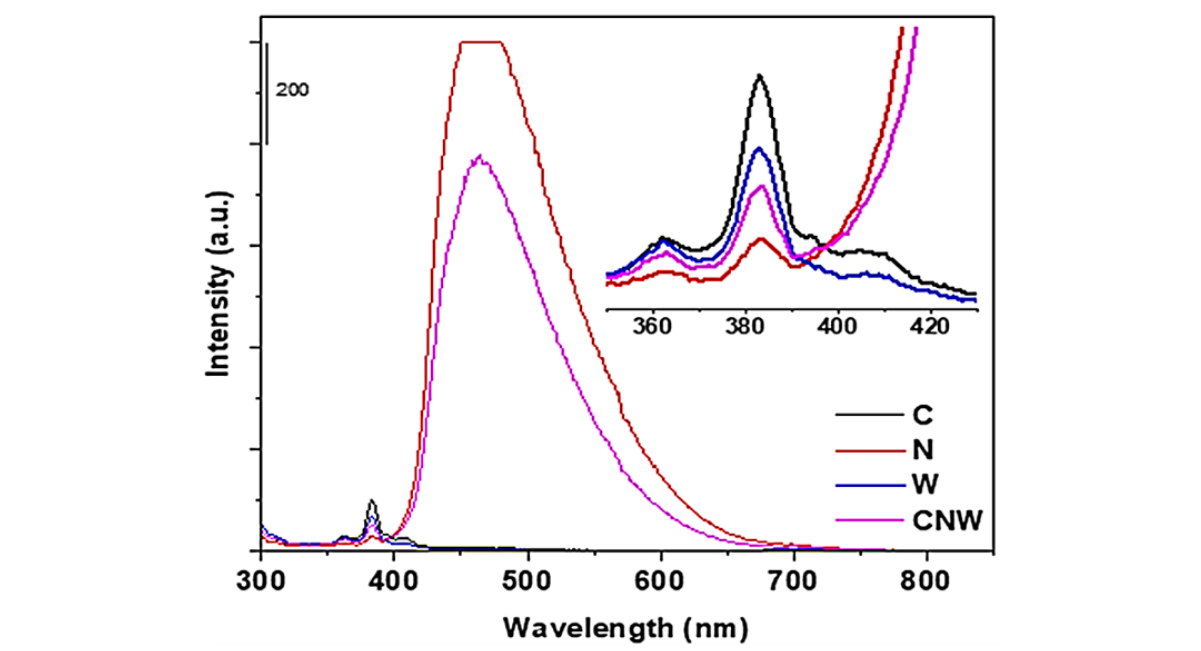
Figure 9: Photoluminescence Spectra of all the Samples at λexc = 285 nm
Effects of Operational Conditions
Effect of Increasing Sun Light Power for Doxorubicin, Hydroxychloroquine and Tinidazole Photoremovals with CeO2@C3N4/WO3 Nanocomposite
Effect of increasing sun light power (10, 20, 40 and 80 W/m2) on the photooxidation yields of Doxorubicin, Hydroxychloroquine and Tinidazol was investigated with CeO2@C3N4/WO3 nanocomposites (Figure 10). 57%, 84% and 96% photoremoval efficiencies were obtained at 10, 20 and 80 W/m2 solar light powers, respectively, after 15 min photodegradation time, at pH=7.0 and at 25oC, respectively (Figure 10).
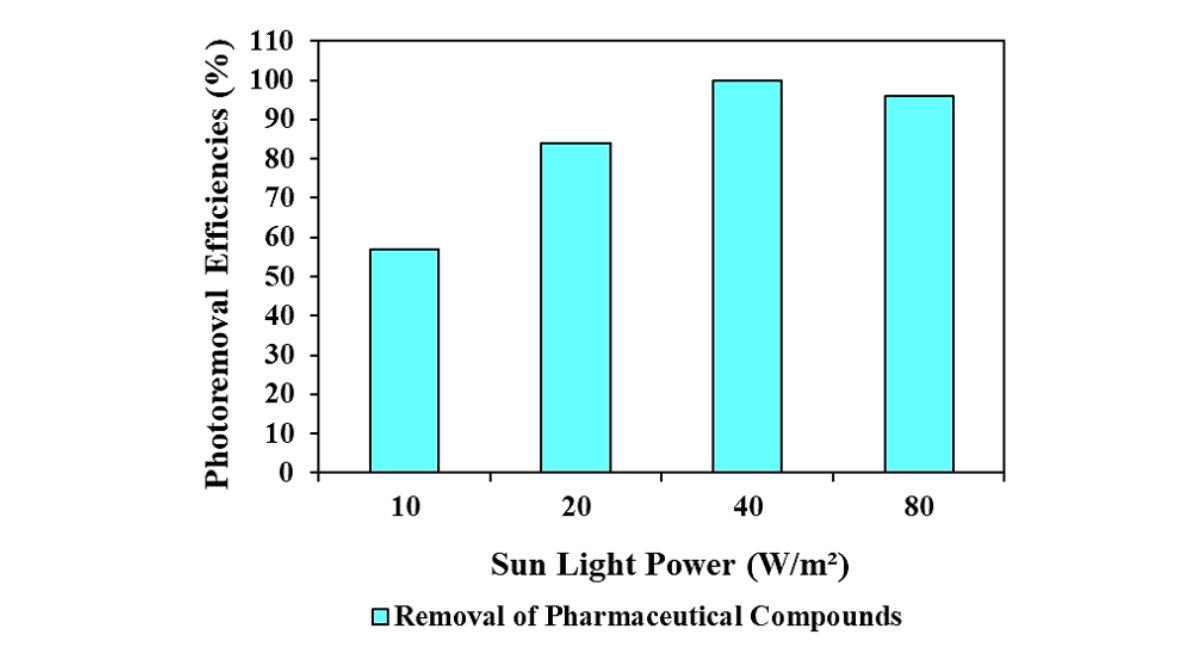
Figure 10: Effect of Sun Light power on the photoremoval of Doxorubin, Hydroxychloroquine and Tinidazole with CeO2@C3N4/WO3 Nanocomposite Photocatalyst
Maximum 100% photodegradation yields was detected for Dozorubicin, Hydroxychloroquine and Tinidazole, at 40 W/m2 solar light power after 15 min photodegradation, at pH=7.0 and at 25oC (Figure 10).
Photocatalytic reaction rate depends largely on the radiation absorption of the photocatalyst, where the increase in light intensity enhances the degradation rate and the yield in photocatalytic degradation (Figure 10). At low light intensities (10–20 W/m2), the rate would increase linearly with increasing light intensity, whereas at intermediate light intensities, above 14 W/m2, the rate would depend on the square root of the light intensity. This is likely, because at low light intensity, reactions involving electron–hole formation are predominant, and electron–hole recombination is negligible. However, at increased light intensity (80 W/m2) the, electron–hole pair separation competes with recombination, thereby causing lower effect on the reaction rate like a solar light power of 80 W/m2. The enhancement of the photodegradation of Doxorubicin, Hydroxychloroquine and Tinidazol photoremovals increased as the light intensity increased up to 40 W/m2 (Figure 10).
Effect of Increasing Pharmaceutical Concentrations for Doxorubicin, Hydroxychloroquine and Tinidazole Photoremovals with CeO2@C3N4/WO3 Nanocomposite
Effect of increasing Doxorubicin, Hydroxychloroquine and Tinidazol pharmaceuticals concentrations (400, 600, 800 1000 and 1500 mg/L) on the photodegradation yields of Doxorubicin, Hydroxychloroquine and Tinidazol photoremovals was investigated with CeO2@C3N4/WO3 nanocomposites (Figure 11). 53%, 70%, 92% and 94% photodegradation removals were observed at 400, 600, 800 and 1500 mg/L pharmaceuticals (Doxorubicin, Hydroxychloroquine and Tinidazole) concentration, after 15 min photodegradation, under 40 W solar light power, at pH=7.0 and at 25oC, respectively (Figure 11).
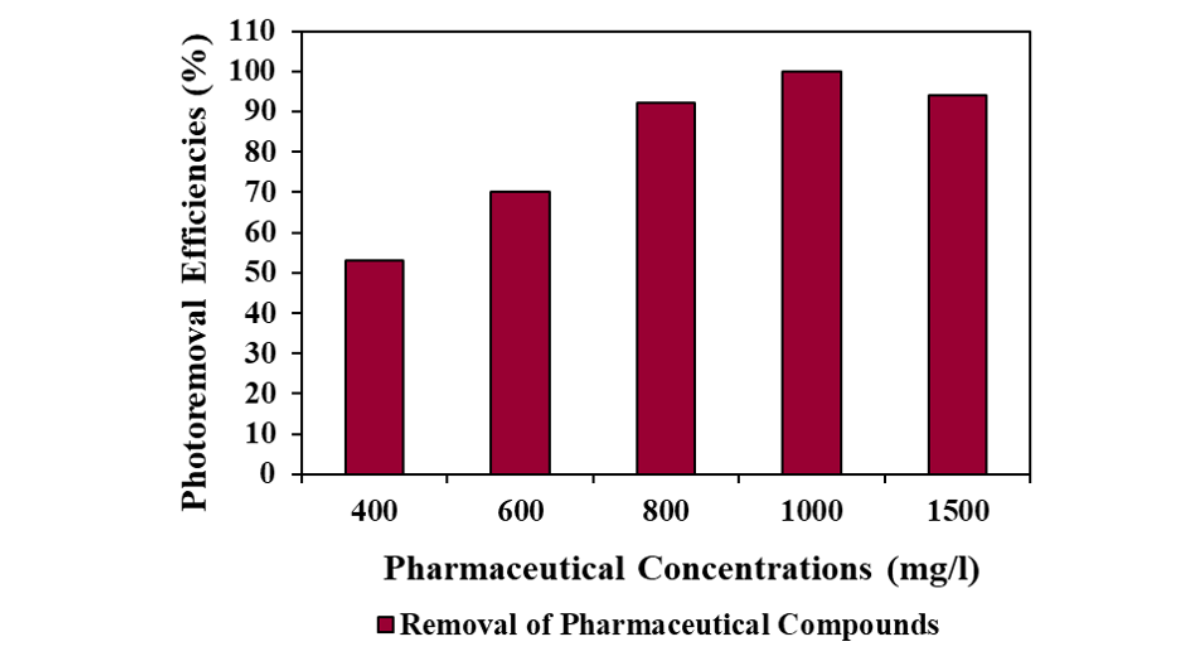
Figure 11: Effect Of Pharmaceutical Concentrations on the Photoremoval Yields of Doxorubicin, Hydroxychloroquine And Tinidazole With Ceo2@C3N4/WO3 Nanocomposites
Maximum 100% pharmaceuticals (Doxorubicin, Hydroxychloroquine and Tinidazole) photoremovals were found at 1000 mg/L pharmaceuticals (Doxorubicin, Hydroxychloroquine and Tinidazole) concentration, after 15 min photodegradation, under 40 W solar light power, at pH=7.0 and at 25oC, respectively (Figure 11).
An increase in the pharmaceutical (Doxorubicin, Hydroxychloroquine and Tinidazole) concentrations from 400 mg/L up to 1000 mg/L increased the photodegradation yields of pharmaceuticals (Figure 11). This may be due to the almost all pharmaceuticals (Doxorubicin, Hydroxychloroquine and Tinidazole) photocatalyzed by CeO2@C3N4/WO3 nanocomposites and the establishment of equilibrium between the CeO2@C3N4/WO3 nanocomposites and pharmaceuticals and none of a CeO2@C3N4/WO3 photocatalyst was not remained in the solution. At 1000 mg/l pharmaceuticals (Doxorubicin, Hydroxychloroquine and Tinidazole) the e CeO2@C3N4/WO3 nanocomposites can photodegrade all the pharmaceuticals in the solute to be photocatalyzed. A further increase in pharmaceutical dosage (1500 mg/l) did not cause a significant improvement in pharmaceutical yields. This may be due to the adsorption of almost all pharmaceuticals (Doxorubicin, Hydroxychloroquine and Tinidazole) to the photocatalyst and the establishment of equilibrium between the pharmaceuticals (Doxorubicin, Hydroxychloroquine and Tinidazole) adsorbed to the CeO2@C3N4/WO3 nanocomposites and those remaining unabsorbed and unphotocatalyzed in the solution. The loading amount of pollutants is a significant factor in the photocatalytic degradation process, because the efficiency could be strongly affected by the number of active sites and photo adsorption ability of the catalyst used. However, it was observed that above a certain optimum pharmaceutical mass, the reaction rate not decrease significantly and becomes independent of the loading concentration.
Effect of CeO2@C3N4/WO3 Nanocomposite Concentrations on the photoremoval of Doxorubicin, Hydroxychloroquine and Tinidazole with CeO2@C3N4/WO3 Nanocomposite
The effects of increasing of CeO2@C3N4/WO3 nanocomposites (1 mg/L, 2 mg/L, 4 mg/L, 6 mg/L and 8 mg/L) concentrations on the pharmaceutical (Doxorubicin, Hydroxychloroquine and Tinidazole) yields were investigated on pharmacuetical yields at 40 W/m2 sun light power, at 1000 mg/l pharmaceutical concentration after 15 min photocatalytic degradation time, at pH=7.0 and at 25 °C, (Figure 12). 78%, 92%, 85% and 77% photoremoval efficiencies were obtained at 1 mg/L, 4 mg/L, 6 mg/L and 8 mg/L CeO2@C3N4/WO3 nanocomposites concentrations, respectively, at 40 W/m2 sun light power, at 1000 mg/l pharmaceuticals after 15 min photocatalytic degradation time, at pH=7.0, at 25 °C, respectively (Figure 12).
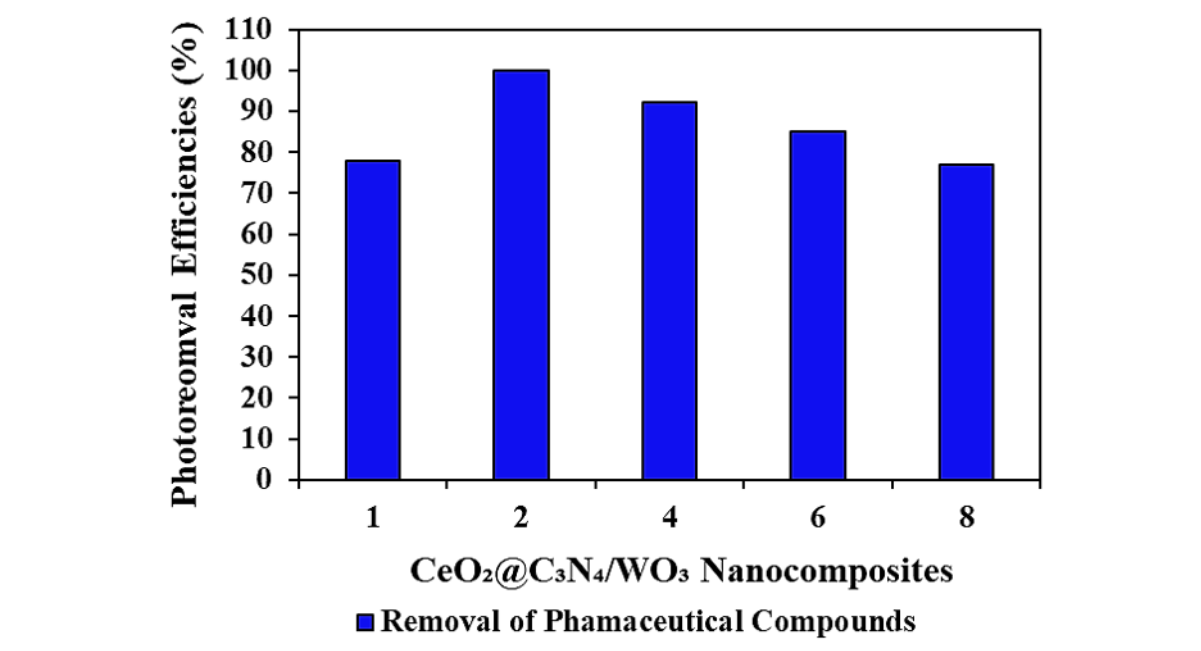
Figure 12: Effect of CeO2@C3N4/WO3 Nanocomposites Concentrations on the Pharmaceuticals (Doxorubicin, Hydroxychloroquine and Tinidazole) Photoremovals with CeO2@C3N4/WO3 Nanocomposites
The maximum 100% pharmaceutical removal efficieny was measured at 2 mg/L CeO2@C3N4/WO3 nanocomposite concentration, at 40 W/m2 sun light power, at 1000 mg/L pharmaceuticals concentration after 15 min photocatalytic degradation time, at pH=7.0, at 25 °C, respectively. A significant statistical correlation between the photodegradation efficiency and nanocomposite concentration was not found up to an optimal nanocomposite concentration is attained. At high nanocomposite concentrations can result in turbidity and a blocking effects of active points on the surface of nanocomposite. This cause to decreasing light intensity in the nanocomposite pharmaceutical matrix. Elevated nanocomposite concentration cause to lowered of photodegradation of pharmaceuticals. On the other hand, at optimal nanocomposite doses, the nanocomposite has good agglomeration due to its high surface energy. Therfore at optimal nanocomposite concentrations excellent photocatalytic yields was detected.
Effect of Increasing Photodegradation Time on the photoremovals of Doxorubicin, Hydroxychloroquine and Tinidazole with CeO2@C3N4/WO3 Nanocomposite
The photoreactor was operated at increasing times (10, 15, 20 and 25 min) to determine tha pharmaceutical yields at 40 W/m2 sun light power, at 1000 mg/l pharmaceuticals (Doxorubicin, Hydroxychloroquine and Tinidazole) concentration, at pH=7.0, at 25°C, respectively (Figure 13). 75%, 92% and 84% photoremoval yields were measured at 10, 20 and 25 min photodegradation time, respectively, at 40 W/m2 sun light power, at 1000 mg/L pharmaceuticals (Doxorubicin, Hydroxychloroquine and Tinidazole) concentration, at pH=7.0, at 25 °C, respectively (Figure 13).
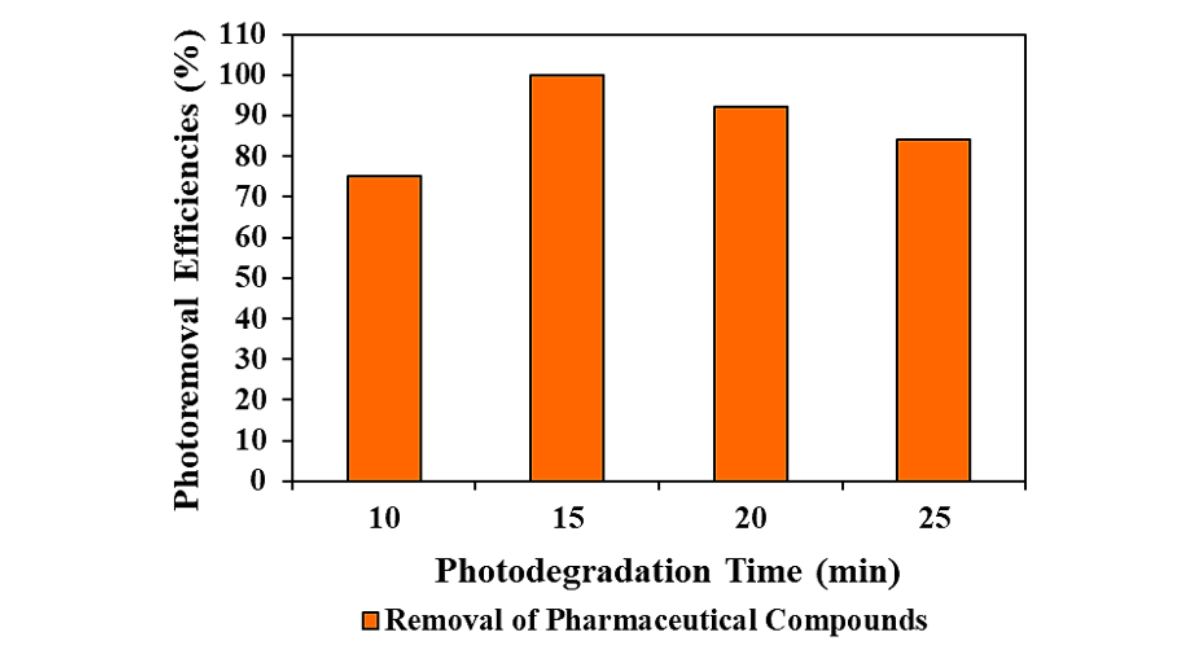
Figure 13: Effect of Photodegradation Time on the Photoremovals of Pharmaceuticals Compounds (Doxorubicin, Hydroxychloroquine and Tinidazole) With Ceo2@C3N4/WO3 Nanocomposites
Maximum 100% photoremoval efficiency was obtained at 15 min photodegradation time, at 40 W/m2 sun light power, at 1000 mg/L pharmaceutical concentration, at pH=7.0, at 25 °C, respectively (Figure 13). As the photooxidation times were increased from 10 min up to 15 min the pharmaceuticals (Doxorubicin, Hydroxychloroquine and Tinidazole) yields increased from 75% up to 100% under sun light. Further increase of time did not affect the pharmaceuticals (Doxorubicin, Hydroxychloroquine and Tinidazole) removals. Data obtained from this study showed that the pharmaceutical yields at longer retention time was low. In an elevated ratio of contact at long contact times; no hydroxyl radicals production was achieved for pharmaceuticals (Doxorubicin, Hydroxychloroquine and Tinidazole) reduction. As a result, low conversion rates were observed at very short residence times. Althougth, prolonged light irradiation is expected to accelerate the photodegradation of pharmaceutical molecules onto the photocatalyst surface before reaching equilibrium in this study 15 min has enhanced the yields. It can be speculated that the number of electrons transferring from the VB to the CB increases that enhance the amount of electron-hole pairing at 15 min. The optimum illumination time for maximum removal of pharmaceuticals (Doxorubicin, Hydroxychloroquine and Tinidazole) was obtained as 15 min.
Effect of Increasing Temperature on The Photoremoval Yields of Doxorubicin, Hydroxychloroquine and Tinidazole with Ceo2@C3N4/WO3 Nanocomposite
The photoreactor was operated with different temperatures (21, 25, 30 and 40oC) to determine the pharmaceuticals (Doxorubicin, Hydroxychloroquine and Tinidazole) photoremoval yields, at 40 W/m2 sun light power, at 1000 mg/L pharmaceuticals (Doxorubicin, Hydroxychloroquine and Tinidazole) concentration, at 2 mg/L CeO2@C3N4/WO3 nanocomposites concentrations, after 15 min photodegradation time, at pH=7.0, at 25 °C, respectively (Figure 14). 69%, 95% and 73% removal efficiencies were measured at 21 oC, 30 oC and 40oC, respectively, at 40 W/m2 sun light power, at 1000 mg/L pharmaceuticals (Doxorubicin, Hydroxychloroquine and Tinidazole) concentration, at 2 mg/L CeO2@C3N4/WO3 nanocomposites concentrations, after 15 min photodegradation time, at pH=7.0, respectively (Figure 14).
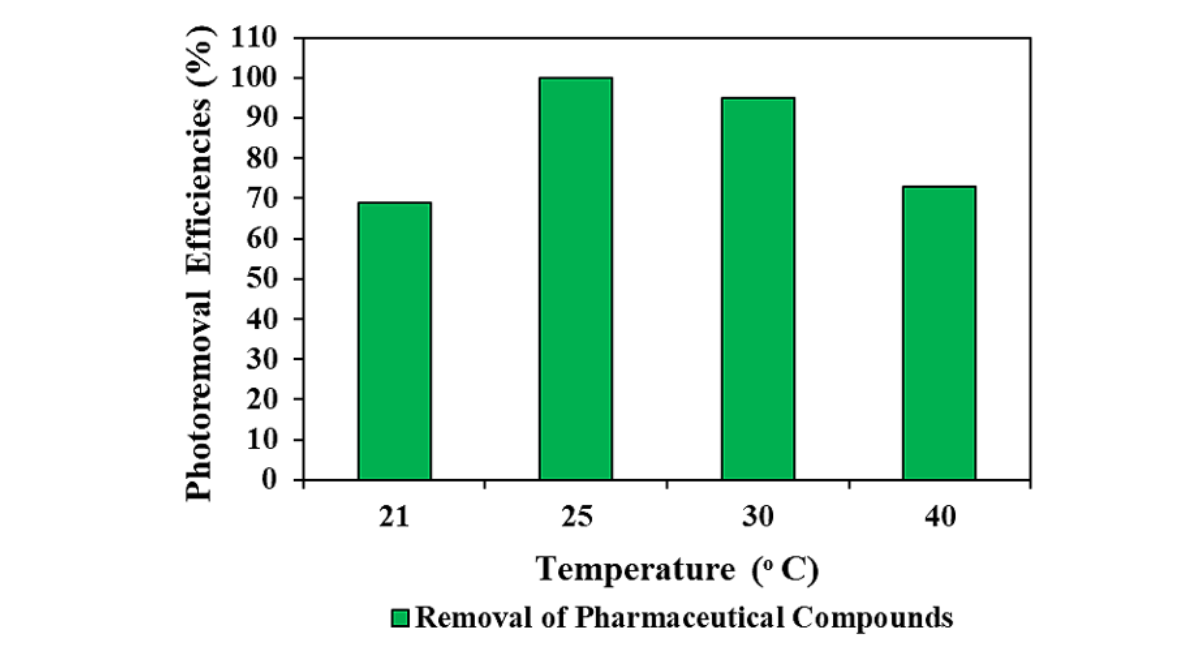
Figure 14: Effect of Temperature on the yields of pharmaceuticals (Doxorubicin, Hydroxychloroquine and Tinidazole) with CeO2@C3N4/WO3 nanocomposites
The maximum 100% pharmaceutical yields was detected at 25oC temperature at 40 W/m2 sun light power, 1000 mg/L pharmaceuticals (Doxorubicin, Hydroxychloroquine and Tinidazole) concentration, at 2 mg/L CeO2@C3N4/WO3 nanocomposites concentrations, after 15 min photodegradation time, at pH=7.0, respectively (Figure 14).
In heterogeneous photocatalytic systems, temperature was found to have an significant effect on the photodegradation of pharmaceuticals. In particular, low temperatures favour the adsorption of the pharmaceuticals onto the catalyst, which is a spontaneous exothermic process. Nevertheless, in this case the adsorption of the degradation products is also enhanced, thus reducing the number of active sites on the catalyst. In contrast, high temperatures lead to an increase in the mobility of the pharmaceutical molecules, therefore increasing the kinetic energy. However, the enhanced kinetic energy of the pharmaceutical molecules may also allow them to escape from the photocatalyst surface, without being subjected to photodegradation. The morphology of the catalyst is very relevant when studying the effect of temperature on the photodegradation of pharmaceuticals. For the nanoparticles, higher temperatures increased the photodegradation rate, whereas a rise in temperature had a negative effect. This was explained due to the super activity of the pharmaceutical surface compared to the nanoparticles.
Effect of Increasing pH values on the Doxorubicin, Hydroxychloroquine and Tinidazole Photoremovals with CeO2@C3N4/WO3 Nanocomposite
The effects of increasing pH values (pH=4.0, pH=7.0, pH=8.0 and pH=10.0) on the yields of pharmaceuticals (Doxorubicin, Hydroxychloroquine and Tinidazole) was investigated at 40 W/m2 sun light power, at 1000 mg/L pharmaceuticals (Doxorubicin, Hydroxychloroquine and Tinidazole) concentration, at 2 mg/L CeO2@C3N4/WO3 nanocomposite dose after 15 min photodegradation time, at pH=7.0, and at 25oC temperature, respectively (Figure 15). 71%, 94% and 62% removal efficiencies was measured at pH=4.0, at pH=8.0 and at pH=10.0, respectively, for pharmaceutical (Doxorubicin, Hydroxychloroquine and Tinidazole) photoremovals. The maximum pharmaceutical yields was detected at pH=7.0 (100%) at 40 W/m2 sun light power, at 1000 mg/L pharmaceutical concentration, at 2 mg/L CeO2@C3N4/WO3 nanocomposites concentrations, after 15 min photodegradation time, at 25oC temperature, respectively (Figure 15).
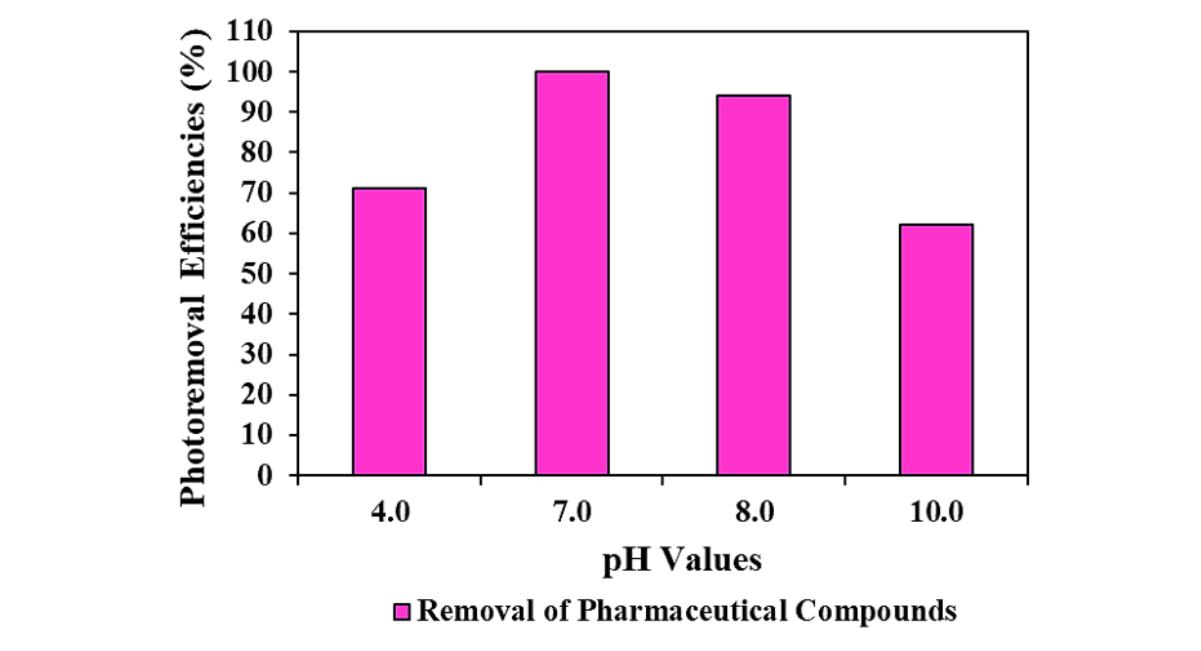
Figure 15: Effect of pH values on the photoremoval of pharmaceuticals compounds (Doxorubicin, Hydroxychloroquine and Tinidazole) with CeO2@C3N4/WO3 nanocomposites
This indicates that with changing the pH of the solution media, the acid-base property at surface of the photocatalyst was remarkably influenced the photodegradation performance of the nanomaterial. The electrostatic based repulsion between the deprotonated CeO2@C3N4/WO3 nanocomposites and hydroxide ion (OH-) is the possible cause for the observed decrease in performance of the pharmaceuticals at pH=7.0, because the repulsion prevents the formation of hydroxyl radicals that consequently reduces photocatalytic efficiency of CeO2@C3N4/WO3 nanocomposites. Similarly, at pH < 7.0, the decomposition of pharmaceuticals becomes even more hindered, which could be explained by the reduced sorption possibility of the cationic pharmaceuticals at the CeO2@C3N4/WO3 nanocomposite surface which gained sufficient positive charges (i.e., due to protonation) on the surface of catalyst causing repulsion.
CONCLUSION
This study determines the photocatalytic degradation of some pharmaceutical pollutants such as Doxorubicin, Hydroxychloroquine and Tinidazole using a CeO2@C3N4/WO3 nanocomposite under sun light illumination. The effect of increasing sun light power, pharmaceutical concentrations, CeO2@C3N4/WO3 nanocomposite concentrations, photodegradation time, temperature and pH values on the photodegradation yields of Doxorubicin, Hydroxychloroquine and Tinidazole pharmaceuticals were investigated. The structure and properties of the CeO2@C3N4/WO3 nanocomposites were determined with XRD, DRS UV-vis, PL spectra, SAED, HRTEM, TEM, N2 adsorption isotherms and pore distribution and XPS analyses.
Under 40 W/m2 sun light and 2 mg/L CeO2@C3N4/WO3 nanocomposite efficiently degraded 1000 mg/l Doxorubicin, Hydroxychloroquine and Tinidazole pharmaceuticals, achieving 100% photoremovals in 15 min of the reaction time at pH=7.0 and at a temperature of 25oC.
In this study CeO2@C3N4/WO3 nanocomposite was successfully prepared from CeO2, C3N4 nanoparticles and rod-shaped WO3 at different contents of WO3. Among the various nanocomposites, CeO2@C3N4/WO3 nanocomposites showed the highest photocatalytic activity after 15 min of visible-light irradiation. The enhancement of nanocomposite photocatalysts can be attributed to interfacial charges transfer at the heterojunction interface of CeO2@C3N4/WO3 nanocomposites, which leads to the efficient separation of electron−hole pairs. An increase in the specific surface area of CeO2 after adding WO3 in the nanocomposite sample was detected. This enables the provision of more active sites for the adsorption of the pharmaceutical molecules over the photocatalyst surface for further degradation under light-on. Based on the modification method, the experimental results reported in this study may be useful for the development of other photocatalysts for the photocatalytic degradation of some other pharmaceuticals pollutants in water.
ACKNOWLEDGEMENTS
Experimental analyzes in this study were performed at the Laboratories of the Canada Research Center, Ottawa, Canada. The authors would like to thank this body for providing financial support.
REFERENCES
- Anand U, Adelodun B, Cabreros C, Kumar P, Suresh S, Dey A, et al. Occurrence, transformation, bioaccumulation, risk and analysis of pharmaceutical and personal care products from wastewater: a review. Environmental Chemistry Letters. 2022;20(6):3883-904. [Crossref] [Google Scholar] [PubMed]
- Akash S, Sivaprakash B, Rajamohan N, Govarthanan M, Elakiya BT. Remediation of pharmaceutical pollutants using graphene-based materials-A review on operating conditions, mechanism and toxicology. Chemosphere. 2022;306:135520. [Crossref] [Google Scholar] [PubMed]
- Akhil D, Lakshmi D, Senthil Kumar P, Vo DV, Kartik A. Occurrence and removal of antibiotics from industrial wastewater. Environmental chemistry letters. 2021;19(2):1477-507. [Crossref] [Google Scholar]
- Bastami TR, Ahmadpour A, Hekmatikar FA. Synthesis of Fe3O4/Bi2WO6 nanohybrid for the photocatalytic degradation of pharmaceutical ibuprofen under solar light. Journal of Industrial and Engineering Chemistry. 2017;51:244-54. [Crossref] [Google Scholar]
- Ali I, Peng C, Naz I, Khan ZM, Sultan M, Islam T, Abbasi IA. Phytogenic magnetic nanoparticles for wastewater treatment: a review. RSC advances. 2017;7(64):40158-78. [Crossref] [Google Scholar]
- Azócar MI, Alarcón R, Castillo A, Blamey JM, Walter M, Paez M. Capping of silver nanoparticles by anti-inflammatory ligands: antibacterial activity and superoxide anion generation. Journal of Photochemistry and Photobiology B: Biology. 2019;193:100-8. [Crossref] [Google Scholar] [PubMed]
- Davoudi M, Ehrampoush MH, Vakili T, Absalan A, Ebrahimi A. Antibacterial effects of hydrogen peroxide and silver composition on selected pathogenic enterobacteriaceae. International Journal of Environmental Health Engineering. 2012;1(1):23. [Crossref] [Google Scholar]
- Ghaseminezhad SM, Shojaosadati SA. Evaluation of the antibacterial activity of Ag/Fe3O4 nanocomposites synthesized using starch. Carbohydrate polymers. 2016;144:454-63. [Crossref] [Google Scholar] [PubMed]
- Alman B, Attia S, Baumgarten C, Benson C, Blay JY, Bonvalot S, et al. The management of desmoid tumours: a joint global consensus-based guideline approach for adult and paediatric patients. European Journal of Cancer. 2020;127:96-107. [Crossref] [Google Scholar] [PubMed]
- Hutchinson CR, Colombo AL. Genetic engineering of doxorubicin production in Streptomyces peucetius: a review. Journal of industrial microbiology and biotechnology. 1999;23(1):647-52. [Crossref] [Google Scholar] [PubMed]
- Tacar O, Sriamornsak P, Dass CR. Doxorubicin: an update on anticancer molecular action, toxicity and novel drug delivery systems. Journal of pharmacy and pharmacology. 2013;65(2):157-70. [Crossref] [Google Scholar] [PubMed]
- World Health Organization. World Health Organization model list of essential medicines: 21st list 2019. World Health Organization; 2019. [Google Scholar]
- Ravina E. The evolution of drug discovery: from traditional medicines to modern drugs. John Wiley & Sons; 2011. [Crossref] [Google Scholar]
- Flint J, Panchal S, Hurrell A, van de Venne M, Gayed M, Schreiber K, et al. BSR and BHPR guideline on prescribing drugs in pregnancy and breastfeeding—Part I: standard and biologic disease modifying anti-rheumatic drugs and corticosteroids. Rheumatology. 2016;55(9):1693-7. [Crossref] [Google Scholar] [PubMed]
- Juurlink DN. Safety considerations with chloroquine, hydroxychloroquine and azithromycin in the management of SARS-CoV-2 infection. Cmaj. 2020;192(17):E450-3. [Crossref] [Google Scholar] [PubMed]
- World Health Organization. The selection and use of essential medicines 2023: web annex A: World Health Organization model list of essential medicines: 23rd list (2023). World Health Organization; 2023. [Google Scholar]
- Chew CY, Mar A, Nikpour M, Saracino AM. Hydroxychloroquine in dermatology: new perspectives on an old drug. Australasian Journal of Dermatology. 2020;61(2):e150-7. [Crossref] [Google Scholar] [PubMed]
- Cui L, Ding X, Wang Y, Shi H, Huang L, Zuo Y, Kang S. Facile preparation of Z-scheme WO3/g-C3N4 composite photocatalyst with enhanced photocatalytic performance under visible light. Applied Surface Science. 2017;391:202-10. [Crossref] [Google Scholar]
- Schmith VD, Zhou J, Lohmer LR. The approved dose of ivermectin alone is not the ideal dose for the treatment of COVID‐19. Clinical Pharmacology & Therapeutics. 2020;108(4):762-5. [Crossref] [Google Scholar] [PubMed]
- Meyerowitz EA, Vannier AG, Friesen MG, Schoenfeld S, Gelfand JA, Callahan MV, et al. Rethinking the role of hydroxychloroquine in the treatment of COVID‐19. The FASEB Journal. 2020;34(5):6027-37. [Crossref] [Google Scholar] [PubMed]
- Flach AJ. Improving the risk-benefit relationship and informed consent for patients treated with hydroxychloroquine. Transactions of the American Ophthalmological Society. 2007;105:191. [Crossref] [Google Scholar] [PubMed]
- Marquardt K, Albertson TE. Treatment of hydroxychloroquine overdose. The American journal of emergency medicine. 2001;19(5):420-4. [Crossref] [Google Scholar] [PubMed]
- Marmor MF, Kellner U, Lai TY, Lyons JS, Mieler WF. Revised recommendations on screening for chloroquine and hydroxychloroquine retinopathy. Ophthalmology. 2011;118(2):415-22. [Crossref] [Google Scholar] [PubMed]
- Ling Ngan Wong, A., Tsz Fung Cheung, I., Graham, C.A., Hydroxychloroquine overdose: case report and recommendations for management. European Journal of Emergency Medicine, 2008;15(1):16–18. [Crossref] [Google Scholar] [PubMed]
- Smith ER, Klein-Schwartz W. Are 1–2 dangerous? Chloroquine and hydroxychloroquine exposure in toddlers. The Journal of emergency medicine. 2005;28(4):437-43. [Crossref] [Google Scholar] [PubMed]
- Granizo JJ, Rodicio P, Manso FJ, Giménez MJ. Tinidazole: a classical anaerobical drug with multiple potential uses nowadays. Revista Espanola de Quimioterapia: Publicacion Oficial de la Sociedad Espanola de Quimioterapia. 2009;22(2):106-14. [Crossref] [Google Scholar] [PubMed]
- Papich MG. Saunders handbook of veterinary drugs: small and large animal. Elsevier Health Sciences; 2015. [Crossref] [Google Scholar]
- Edwards DI. Nitroimidazole drugs-action and resistance mechanisms I. Mechanism of action. Journal of Antimicrobial Chemotherapy. 1993;31(1):9-20. [Crossref] [Google Scholar] [PubMed]
- Montini T, Melchionna M, Monai M, Fornasiero P. Fundamentals and catalytic applications of CeO2-based materials. Chemical reviews. 2016;116(10):5987-6041. [Crossref] [Google Scholar] [PubMed]
- Fauzi AA, Jalil AA, Hassan NS, Aziz FF, Azami MS, Hussain I, Saravanan R, Vo DV. A critical review on relationship of CeO2-based photocatalyst towards mechanistic degradation of organic pollutant. Chemosphere. 2022;286:131651. [Crossref] [Google Scholar] [PubMed]
- Kashmery HA, El-Hout SI, Zaki ZI. Fast photocatalytic oxidation of ciprofloxacin over Co3O4@ CeO2 heterojunctions under visible-light. Journal of the Taiwan Institute of Chemical Engineers. 2022;140:104563. [Crossref] [Google Scholar]
- Rajeshkumar S, Naik P. Synthesis and biomedical applications of cerium oxide nanoparticles–a review. Biotechnology Reports. 2018;17:1-5. [Crossref] [Google Scholar] [PubMed]
- Latif MM, Amin F, Ajaz-un-Nabi M, Khan IU, Sabir N. Synthesis and antimicrobial activities of Manganese (Mn) and iron (Fe) co-doped Cerium dioxide (CeO2) Nanoparticles. Physica B: Condensed Matter. 2021;600:412562. [Crossref] [Google Scholar]
- Parvathy S, Subramanian P, Karthick SA, Subbaiya R. The structural, optical, antimicrobial and anticancer properties of biocompatible astaxanthin coated ZnO and CeO2 nanoparticles. Materials Letters. 2022;312:131669. [Crossref] [Google Scholar]
- Channei D, Inceesungvorn B, Wetchakun N, Ukritnukun S, Nattestad A, Chen J, et al. Photocatalytic degradation of methyl orange by CeO2 and Fe–doped CeO2 films under visible light irradiation. Scientific reports. 2014;4(1):5757. [Crossref] [Google Scholar] [PubMed]
- Yin D, Zhao F, Zhang L, Zhang X, Liu Y, Zhang T, et al. Greatly enhanced photocatalytic activity of semiconductor CeO 2 by integrating with upconversion nanocrystals and graphene. RSC advances. 2016;6(105):103795-802. [Crossref] [Google Scholar]
- Sharma D, Mehta BR. Nanostructured TiO2 thin films sensitized by CeO2 as an inexpensive photoanode for enhanced photoactivity of water oxidation. Journal of Alloys and Compounds. 2018;749:329-35. [Crossref] [Google Scholar]
- Huang K, Li YH, Lin S, Liang C, Xu X, Zhou YF, Fan DY, Yang HJ, Lang PL, Zhang R, Wang YG. One-step synthesis of reduced graphene oxide–CeO2 nanocubes composites with enhanced photocatalytic activity. Materials Letters. 2014;124:223-6. [Crossref] [Google Scholar]
- Qu X, Xie D, Gao L, Du F. Synthesis and photocatalytic activity of TiO2/CeO2 core–shell nanotubes. Materials science in semiconductor processing. 2014;26:657-62. [Crossref] [Google Scholar]
- Saranya J, Ranjith KS, Saravanan P, Mangalaraj D, Kumar RT. Cobalt-doped cerium oxide nanoparticles: enhanced photocatalytic activity under UV and visible light irradiation. Materials science in semiconductor processing. 2014;26:218-24. [Crossref] [Google Scholar]
- Zhang C, Zhang H, Zhang K, Li X, Leng Q, Hu C. Photocatalytic activity of ZnWO4: band structure, morphology and surface modification. ACS applied materials & interfaces. 2014;6(16):14423-32. [Crossref] [Google Scholar] [PubMed]
- Zhang C, Zhang X, Wang Y, Xie S, Liu Y, Lu X, Tong Y. Facile electrochemical synthesis of CeO 2 hierarchical nanorods and nanowires with excellent photocatalytic activities. New Journal of Chemistry. 2014;38(6):2581-6. [Crossref] [Google Scholar]
- Toro RG, Malandrino G, Fragalà IL, Lo Nigro R, Losurdo M, Bruno G. Relationship between the nanostructures and the optical properties of CeO2 thin films. The Journal of Physical Chemistry B. 2004;108(42):16357-64. [Crossref] [Google Scholar]
- Issarapanacheewin S, Wetchakun K, Phanichphant S, Kangwansupamonkon W, Wetchakun N. A novel CeO2/Bi2WO6 composite with highly enhanced photocatalytic activity. Materials Letters. 2015;156:28-31. [Crossref] [Google Scholar]
- Mittal M, Gupta A, Pandey OP. Role of oxygen vacancies in Ag/Au doped CeO2 nanoparticles for fast photocatalysis. Solar Energy. 2018;165:206-16. [Crossref] [Google Scholar]
- Xiu Z, Xing Z, Li Z, Wu X, Yan X, Hu M, Cao Y, Yang S, Zhou W. Ti3+-TiO2/Ce3+-CeO2 Nanosheet heterojunctions as efficient visible-light-driven photocatalysts. Materials Research Bulletin. 2018;100:191-7. [Crossref] [Google Scholar]
- Chen HI, Chang HY. Synthesis and characterization of nanocrystalline cerium oxide powders by two-stage non-isothermal precipitation. Solid state communications. 2005;133(9):593-8. [Crossref] [Google Scholar]
- Avellaneda CO, Berton MA, Bulhões LO. Optical and electrochemical properties of CeO2 thin film prepared by an alkoxide route. Solar Energy Materials and Solar Cells. 2008;92(2):240-4. [Crossref] [Google Scholar]
- Wongkaew A. Effect of cerium oxide and zirconium oxide to activity of catalysts. Chiang Mai J. Sci. 2008;35(1):156-62. [Google Scholar]
- Zhang N, Zhang G, Chong S, Zhao H, Huang T, Zhu J. Ultrasonic impregnation of MnO2/CeO2 and its application in catalytic sono-degradation of methyl orange. Journal of environmental management. 2018;205:134-41. [Crossref] [Google Scholar] [PubMed]
- Munoz-Batista MJ, Gómez-Cerezo MN, Kubacka A, Tudela D, Fernandez-Garcia M. Role of interface contact in CeO2–TiO2 photocatalytic composite materials. ACS Catalysis. 2014;4(1):63-72. [Crossref] [Google Scholar]
- Aboutaleb WA, El-Salamony RA. Effect of Fe2O3-CeO2 nanocomposite synthesis method on the Congo red dye photodegradation under visible light irradiation. Materials Chemistry and Physics. 2019;236:121724. [Crossref] [Google Scholar]
- Fu J, Yu J, Jiang C, Cheng B. g‐C3N4‐Based heterostructured photocatalysts. Advanced Energy Materials. 2018;8(3):1701503. [Crossref] [Google Scholar]
- Hao Q, Chen T, Wang R, Feng J, Chen D, Yao W. A separation-free polyacrylamide/bentonite/graphitic carbon nitride hydrogel with excellent performance in water treatment. Journal of Cleaner Production. 2018;197:1222-30. [Crossref] [Google Scholar]
- Hao X, Zhou J, Cui Z, Wang Y, Wang Y, Zou Z. Zn-vacancy mediated electron-hole separation in ZnS/g-C3N4 heterojunction for efficient visible-light photocatalytic hydrogen production.
- Ren Y, Zeng D, Ong WJ. Interfacial engineering of graphitic carbon nitride (g-C3N4)-based metal sulfide heterojunction photocatalysts for energy conversion: a review. Chinese Journal of Catalysis. 2019;40(3):289-319. [Crossref] [Google Scholar]
- Low J, Jiang C, Cheng B, Wageh S, Al‐Ghamdi AA, Yu J. A review of direct Z‐scheme photocatalysts. Small methods. 2017;1(5):1700080. [Crossref] [Google Scholar]
- Chen Y, Fan Z, Zhang Z, Niu W, Li C, Yang N, Chen B, Zhang H. Two-dimensional metal nanomaterials: synthesis, properties, and applications. Chemical reviews. 2018;118(13):6409-55. [Crossref] [Google Scholar] [PubMed]
- Mestre AS, Carvalho AP. Photocatalytic degradation of pharmaceuticals carbamazepine, diclofenac, and sulfamethoxazole by semiconductor and carbon materials: a review. Molecules. 2019;24(20):3702. [Crossref] [Google Scholar] [PubMed]
- Yu W, Xu D, Peng T. Enhanced photocatalytic activity of gC 3 N 4 for selective CO 2 reduction to CH 3 OH via facile coupling of ZnO: a direct Z-scheme mechanism. Journal of Materials Chemistry A. 2015;3(39):19936-47. [Crossref] [Google Scholar]
- Xu Q, Zhang L, Yu J, Wageh S, Al-Ghamdi AA, Jaroniec M. Direct Z-scheme photocatalysts: Principles, synthesis, and applications. Materials Today. 2018;21(10):1042-63. [Crossref] [Google Scholar]
- Huang D, Chen S, Zeng G, Gong X, Zhou C, Cheng M, Xue W, Yan X, Li J. Artificial Z-scheme photocatalytic system: what have been done and where to go?. Coordination Chemistry Reviews. 2019;385:44-80. [Crossref] [Google Scholar]
- Liu D, Zhang M, Xie W, Sun L, Chen Y, Lei W. Porous BN/TiO2 hybrid nanosheets as highly efficient visible-light-driven photocatalysts. Applied Catalysis B: Environmental. 2017 ;207:72-8. [Google Scholar]
- Liu S, Chen F, Li S, Peng X, Xiong Y. Enhanced photocatalytic conversion of greenhouse gas CO2 into solar fuels over g-C3N4 nanotubes with decorated transparent ZIF-8 nanoclusters. Applied Catalysis B: Environmental. 2017 Aug 15;211:1-0. [Crossref] [Google Scholar]
- Liu X, Pang F, He M, Ge J. Confined reaction inside nanotubes: New approach to mesoporous g-C3N4 photocatalysts. Nano Research. 2017;10(11):3638-47. [Crossref] [Google Scholar]
- Gebreslassie G, Bharali P, Chandra U, Sergawie A, Baruah PK, Das MR, et al. Hydrothermal synthesis of g‐C3N4/NiFe2O4 nanocomposite and its enhanced photocatalytic activity. Applied Organometallic Chemistry. 2019;33(8):e5002. [Crossref] [Google Scholar]
- Gebreslassie G, Bharali P, Chandra U, Sergawie A, Boruah PK, Das MR, Alemayehu E. Novel g-C3N4/graphene/NiFe2O4 nanocomposites as magnetically separable visible light driven photocatalysts. Journal of Photochemistry and Photobiology A: Chemistry. 2019;382:111960. [Crossref] [Google Scholar]
- Kusmierek E. A CeO2 semiconductor as a photocatalytic and photoelectrocatalytic material for the remediation of pollutants in industrial wastewater: a review. Catalysts. 2020;10(12):1435. [Crossref] [Google Scholar]
- Qu Z, Jing Z, Chen X, Wang Z, Ren H, Huang L. Preparation and photocatalytic performance study of dual Z-scheme Bi2Zr2O7/g-C3N4/Ag3PO4 for removal of antibiotics by visible-light. Journal of Environmental Sciences. 2023;125:349-61. [Crossref] [Google Scholar] [PubMed]
- Wei S, Ma Y, Chen Y, Liu L, Liu Y, Shao Z. Fabrication of WO3/Cu2O composite films and their photocatalytic activity. Journal of hazardous materials. 2011;194:243-9. [Crossref] [Google Scholar] [PubMed]
- Wang F, Di Valentin C, Pacchioni G. Rational Band Gap Engineering of WO 3 Photocatalyst for Visible light Water Splitting. ChemCatChem. 2012,4(4). [Crossref] [Google Scholar]
- Swain G, Sultana S, Moma J, Parida K. Fabrication of hierarchical two-dimensional MoS2 nanoflowers decorated upon cubic CaIn2S4 microflowers: facile approach to construct novel metal-free p–n heterojunction semiconductors with superior charge separation efficiency. Inorganic Chemistry. 2018;57(16):10059-71. [Crossref] [Google Scholar] [PubMed]
- Zhou C, Wang S, Zhao Z, Shi Z, Yan S, Zou Z. A facet‐dependent Schottky‐junction electron shuttle in a BiVO4 {010}–Au–Cu2O Z‐scheme photocatalyst for efficient charge separation. Advanced Functional Materials. 2018;28(31):1801214. [Crossref] [Google Scholar]
- Gui MS, Zhang WD, Chang YQ, Yu YX. One-step hydrothermal preparation strategy for nanostructured WO3/Bi2WO6 heterojunction with high visible light photocatalytic activity. Chemical Engineering Journal. 2012;197:283-8. [Crossref] [Google Scholar]
- Sun J, Sun L, Han N, Pan J, Liu W, Bai S, Feng Y, Luo R, Li D, Chen A. Ordered mesoporous WO3/ZnO nanocomposites with isotype heterojunctions for sensitive detection of NO2. Sensors and Actuators B: Chemical. 2019;285:68-75. [Crossref] [Google Scholar]
- Pan JH, Lee WI. Preparation of highly ordered cubic mesoporous WO3/TiO2 films and their photocatalytic properties. Chemistry of Materials. 2006;18(3):847-53. [Crossref] [Google Scholar]
- Rajpurohit AS, Punde NS, Rawool CR, Srivastava AK. Fabrication of high energy density symmetric supercapacitor based on cobalt-nickel bimetallic tungstate nanoparticles decorated phosphorus-sulphur co-doped graphene nanosheets with extended voltage. Chemical Engineering Journal. 2019;371:679-92. [Crossref] [Google Scholar]
- Zhang H, Zhu Y, Nutakki TU, Alghassab MA, Alkhalaf S, Islam S, Elmasry Y. Preparation of CeO2-WO3 binary heterojunction photocatalyst for sustainable tetracycline degradation: optimization of synthesis and degradation conditions, characterization, transformation pathway, and dominant reactive species. Surfaces and Interfaces. 2024;44:103793. [Crossref] [Google Scholar]
- Miyauchi M, Shibuya M, Zhao ZG, Liu Z. Surface wetting behavior of a WO3 electrode under light-irradiated or potential-controlled conditions. The Journal of Physical Chemistry C. 2009;113(24):10642-6. [Crossref] [Google Scholar]
- Zhao ZG, Miyauchi M. Nanoporous‐walled tungsten oxide nanotubes as highly active visible‐light‐driven photocatalysts. Angewandte Chemie. 2008;120(37):7159-63. [Crossref] [Google Scholar] [PubMed]
- Torimoto T, Nakamura N, Ikeda S, Ohtani B. Discrimination of the active crystalline phases in anatase–rutile mixed titanium (IV) oxide photocatalysts through action spectrum analyses. Physical Chemistry Chemical Physics. 2002;4(23):5910-4. [Crossref] [Google Scholar]
- Miyauchi M. Photocatalysis and photoinduced hydrophilicity of WO 3 thin films with underlying Pt nanoparticles. Physical Chemistry Chemical Physics. 2008;10(41):6258-65. [Crossref] [Google Scholar] [PubMed]
- Arai T, Horiguchi M, Yanagida M, Gunji T, Sugihara H, Sayama K. Complete oxidation of acetaldehyde and toluene over a Pd/WO 3 photocatalyst under fluorescent-or visible-light irradiation. Chemical Communications. 2008(43):5565-7. [Crossref] [Google Scholar] [PubMed]
- Zhao W, Dong Q, Sun C, Xia D, Huang H, Yang G, Wang G, Leung DY. A novel Au/g-C3N4 nanosheets/CeO2 hollow nanospheres plasmonic heterojunction photocatalysts for the photocatalytic reduction of hexavalent chromium and oxidation of oxytetracycline hydrochloride. Chemical Engineering Journal. 2021;409:128185. [Crossref] [Google Scholar]
- Yang D, Ye Q, Qu C, Meng F, Wang L, Li Y. Enhanced hydrogen evolution and tetracycline degradation by a Z-scheme g-C3N4 nanosheets loaded CeO2 photocatalyst under visible light irradiation. Journal of Environmental Chemical Engineering. 2024;12(3):112563. [Crossref] [Google Scholar]
- Mei X, Zhao X, Xie H, Gavrilov N, Geng Q, Li Q, et al. Charge Transfer Modulation in g-C3N4/CeO2 Composites: Electrocatalytic Oxygen Reduction for H2O2 Production. Inorganic Chemistry. 2025;64(6):3017-27. [Crossref] [Google Scholar] [PubMed]
- Murillo-Sierra JC, Hernández-Ramírez A, Hinojosa-Reyes L, Guzmán-Mar JL. A review on the development of visible light-responsive WO3-based photocatalysts for environmental applications. Chemical engineering journal advances. 2021;5:100070. [Crossref] [Google Scholar]
- Samuel O, Othman MH, Kamaludin R, Sinsamphanh O, Abdullah H, Puteh MH, et al. WO3–based photocatalysts: a review on synthesis, performance enhancement and photocatalytic memory for environmental applications. Ceramics International. 2022;48(5):5845-75. [Crossref] [Google Scholar]
- Munawar T, Mukhtar F, Nadeem MS, Manzoor S, Ashiq MN, Mahmood K, et al. Fabrication of dual Z-scheme TiO2-WO3-CeO2 heterostructured nanocomposite with enhanced photocatalysis, antibacterial, and electrochemical performance. Journal of Alloys and Compounds. 2022;898:162779. [Crossref] [Google Scholar]
- Yaseen M, Jiang H, Li J, Yu X, Ahmad MA, Ali RN, Wang L, Yang J, Liu Q. Synergistic effect of Z-scheme and oxygen vacancy of CeO2/WO3 heterojunction for enhanced CO2 reduction activity. Applied Surface Science. 2023;631:157360. [Crossref] [Google Scholar]
- Kumar SR, Mary DV, Josephine GS, Sivasamy A. Hydrothermally synthesized WO3: CeO2 supported gC3N4 nanolayers for rapid photocatalytic degradation of azo dye under natural sunlight. Inorganic Chemistry Communications. 2024;164:112366. [Crossref] [Google Scholar]
- Vignesh S, Chandrasekaran S, Srinivasan M, Anbarasan R, Perumalsamy R, Arumugam E, et al. TiO2-CeO2/g-C3N4 S-scheme heterostructure composite for enhanced photo-degradation and hydrogen evolution performance with combined experimental and DFT study. Chemosphere. 2022;288:132611. [Crossref] [Google Scholar] [PubMed]
- Gomathi A, Priyadharsan A, Prabhuraj T, Vasanthi G, Gokilapriya S, Ramesh Kumar KA, Maadeswaran P. Boosting the performance of solar light driven CeO2/BiVO4 anchored g-C3N4 nanocomposites: a systematic study toward the development of a photocatalytic and antibacterial activity. Colloids and Surfaces A: Physicochemical and Engineering Aspects. 2023;673:131835. [Crossref] [Google Scholar]
- Kumar S, Kaur R, Sharma S. Recent reports on hydrogen evolution reactions and catalysis. Results in Chemistry. 2022;4:100613. [Crossref] [Google Scholar]
- Bhunia K, Chandra M, Sharma SK, Pradhan D, Kim SJ. A critical review on transition metal phosphide based catalyst for electrochemical hydrogen evolution reaction: Gibbs free energy, composition, stability, and true identity of active site. Coordination Chemistry Reviews. 2023 ;478:214956. [Crossref] [Google Scholar]
- Gupta A, Mittal M, Singh MK, Suib SL, Pandey OP. Low temperature synthesis of NbC/C nano-composites as visible light photoactive catalyst. Scientific reports. 2018;8(1):13597. [Crossref] [Google Scholar] [PubMed]
- Gupta A, Jaidka S, Rajagopalan P, Mehtani HK, Singhal V, Pandey OP. Preparation of graphitic carbon nitride (g-C3N4) for novel dielectric and photocatalytic dye removal applications. Physica Scripta. 2023;98(9):095904. [Crossref] [Google Scholar]
- Gupta A, Singla G, Pandey OP. Effect of synthesis parameters on structural and thermal properties of NbC/C nano composite synthesized via in-situ carburization reduction route at low temperature. Ceramics International. 2016;42(11):13024-34. [Crossref] [Google Scholar]
- Thommes M, Kaneko K, Neimark AV, Olivier JP, Rodriguez-Reinoso F, Rouquerol J, et al. Physisorption of gases, with special reference to the evaluation of surface area and pore size distribution (IUPAC Technical Report). Pure and applied chemistry. 2015;87(9-10):1051-69. [Crossref] [Google Scholar]
- Rahimnejad S, Hui He J, Pan F, Lee XE, Chen W, Wu K, Qin Xu G. Enhancement of the photocatalytic efficiency of WO3 nanoparticles via hydrogen plasma treatment. Materials Research Express. 2014;1(4):045044. [Crossref] [Google Scholar]
- Singh V, Gupta SP, Samanta SK. Water resource rejuvenation via AOP based degradation of pharmaceuticals extensively used during COVID-19. Journal of Water Process Engineering. 2024;67:106137. [Crossref] [Google Scholar]
- Gupta A, Wolski L, Jaidka S, Kumar A, Kaur A, Nowaczyk G, Brar LK. Efficient photoremoval of organic pollutants (dye and pharmaceutical waste) using CeO2@ C3N4/WO3 composite under white LED illumination. Ceramics International. 2025. [Crossref] [Google Scholar]
- Maslakov KI, Teterin YA, Popel AJ, Teterin AY, Ivanov KE, Kalmykov SN, et al. XPS study of ion irradiated and unirradiated CeO2 bulk and thin film samples. Applied Surface Science. 2018;448:154-62. [Crossref] [Google Scholar]

Article Processing Timeline
| Stage 1 |
Initial Quality & Plagiarism Check The manuscript is reviewed for journal scope, basic submission requirements, ethical compliance, and similarity/plagiarism concerns. |
| Stage 2 |
Editorial Assessment & Peer Review Manuscripts that pass the initial screening undergo editorial assessment and independent peer review in accordance with the journal's peer-review policy. |
| Stage 3 |
Revision & Editorial Decision Authors may be requested to revise their manuscript based on reviewer and editor comments. A final editorial decision is made after the required review and revision stages are completed. |
| Stage 4 |
Production & Publication Accepted manuscripts proceed to production, author proofing, final quality checks, and online publication. |
EDITORIAL & PUBLICATION INFORMATION
| English | Publication Language |
| Single-Blind | Peer-Review Model |
| 17% | Acceptance Rate |
| <18% | Similarity Screening Guideline |
| Open Access | Access Model |
All manuscripts undergo editorial assessment and originality screening as part of the journal's evaluation process. The acceptance rate shown is based on journal-level editorial data and may change over time. Similarity reports are assessed editorially and are not interpreted solely on the basis of a numerical similarity score.
Why Publish with us?
Ethics & Policies
Editorial & Management
Useful Links
Journal Highlights
Open Access Journals
Journal Flyer