ABSTRACT
The impact of water pollution on some aquatic macrophytes was investigated in the post-monsoon season at selected lakes of Valsad district, Gujarat. India. The hypothesis was checked to assess the pollution - macrophyte relationship and to assess the role of various polluting factors on the distribution and composition of the macrophyte flora. Physicochemical parameters of the water were computed to assess the status of water conditions. The total number of 45 macrophytes flora was recorded, which belonged to 26 families. Cluster analysis as a classification method, yielded two conspicuous groups (X and Y). Group X indicates the polluted wetland, as its water quality suggests it so, and group Y indicates the non-polluted wetland, being better in its water quality. Thirty-one number of macrophyte species were present in the polluted wetland (group X) and forty macrophyte species were present in the non-polluted wetland (group Y) and Twenty-six macrophyte species were present in both groups. Species percentage of various groups monitor the ecological status of selected lakes. Araceae was the most abundant invasive family, which tolerates serious water pollution levels at the selected study site. Therefore, it can be considered as an indicator family for water pollution areas and can also be used for phytoremediation. Family Araceae is the pollution indicator. The consequence is plants as indicator can help lakes to be revived.
Keywords: CCA; Macrophytes; Phytosociology; Water Pollution; Wetland; Indicator Plants; Araceae
INTRODUCTION
Suitable quantity and quality of freshwater are required for all living things. In the developing world, various countries are facing water crisis due to Industrialization, agricultural run-off, deforestation urbanization, increasing population, climatic changes, and other anthropogenic activity present in the aquatic ecosystems [1]. The concern for water pollution of surface waters is based on rivers and small lakes [2]. The surface water of Lakes is usually a vulnerable drinking water source because the quality of the lake water may depend upon the activities present in the watershed and it may affect the productivity and natural conditions of lakes [3]. Water pollution has negative effect on the living things present in the wetlands as well as on the environment [4].
Wetlands contain a rich and huge amount of biodiversity and it is also a most productive ecosystem which carries out critical regulatory functions of hydrological process within the watersheds [5]. Wetlands are known as “biological supermarkets” because of their excessive food chain and rich biodiversity, supporting millions of people [6]. Wetlands provide essential natural habitat to multiple wildlife such as amphibians, birds, fish species, invertebrates, plant species (macrophytes & plankton diversity), mammals, and as well as focal diversity to many others [7]. Due to the global gene pool, geographical location, dominant species, water chemistry soil or sediment characteristics, and nutrient limitation wetlands express rich diversity [8]. Plants that are bound to the water to complete their life cycle are known as aquatic plants, from that group, some plants are completely submerged and some are more or less growing along the water’s edge [9]. Macrophytes are a large group that possesses macroalgae (large size algae), mosses, ferns, and angiosperms (Flowering plants) [10]. Macrophytes play a key role in the aquatic ecosystem because they act as preliminary producer sources in the food chain of the aquatic ecosystem and maintain the proper equilibrium between abiotic and biotic components in the aquatic ecosystem [11]. Macrophytes are measurable indicators of the ecological conditions of surface waters [12]. However, the macrophyte properties are a beneficial bio-indicator of water quality are not involved only in its sensitivity to pollution, but also its selectivity. Remarkably, various macrophyte species strongly depend on the various Physicochemical parameters of water which has proved to be vulnerable to change in the aquatic ecosystem [13]. In the freshwater ecosystem, the presence of water pollutants adversely affects the structure and function of biotic components, aesthetic value, and environmental quality of the freshwater ecosystem [14]. Macrophyte species diversity is controlled by various abiotic components [15]. Many studies were conducted to understand the effect of industrial and domestic wastewater on the diversity of macrophytes [16,17]. The important aim of this investigation is to identify the difference in the native flora dominating in the polluted lake and non-polluted lake, in order to assess the pollution - macrophyte relationship and to evaluate the role of various polluting factors on the distribution and composition of the macrophyte flora in the selected lakes.
Diversity Indices: The Shannon-Weiner Index (H') reaches maximum levels (e.g., H'=2.55) in non-polluted, pristine environments, whereas it significantly degrades in polluted zones.
Species Dominance: The Simpson Dominance Index (D) inversely reflects pollution. While unpolluted zones support diverse, coexisting species, stressed environments (such as heavily loaded wastewater sites) show elevated dominance scores (e.g., D=0.19) by pollution-tolerant species like Lemna perpusilla or Eichhornia crassipes.
Photosynthetic Pigment Decline: Pollution limits plant productivity. Plants exposed to industrial effluents often face a reduction in chlorophyll levels of 15% to 50% compared to those in clean sites, alongside concomitant leaf yellowing and structural stunting.
Community Shift (Similarity Index): Contaminated sites display a Similarity Index of up to 88% compared to one another, reflecting the uniform, degraded flora dominated by marginal, non-indigenous species (e.g., Polygonum punctatum instead of indigenous flora).
Biological Indices: The River Macrophyte Hydraulic Index (RMHI) acts as a biological indicator of organic pollution; its values soar in downstream stations choked with pollutants and lacking swift-water velocities.
MATERIALS AND METHODS
Description of the Study Area
The investigation work has been carried out at Valsad district, Gujarat, India. Valsad district is located at the southernmost tip of Gujarat, India at the bank of the Arabian Sea, and the global position is located on 72.93o East longitude and 20.63o North latitude with an elevation of 14 meters above the sea level. Major wetland categories of the district are coastal areas, rivers, lakes, ponds, streams reservoirs, intertidal mudflats, and salt marshes. The district covers 3034 sq. km geographical area and 23116 ha wetland area. Here we selected two different lakes based on their pollution status, where site-1 indicates the polluted lake (Group X) which is situated at the Valsad city named Rakhodiya Lake [RL] covering 20,770.96 m2 areas. This lake carries out a high amount of household sewage and agricultural run-off from the surrounding area. Site-2 indicates the non – polluted lake (Group Y), which is situated at Pardi taluka known as Pardi lake [PL]. This lake covers 157,784.26 m2 areas and carries out less amount of household run-off from surrounding areas Fig: 1.
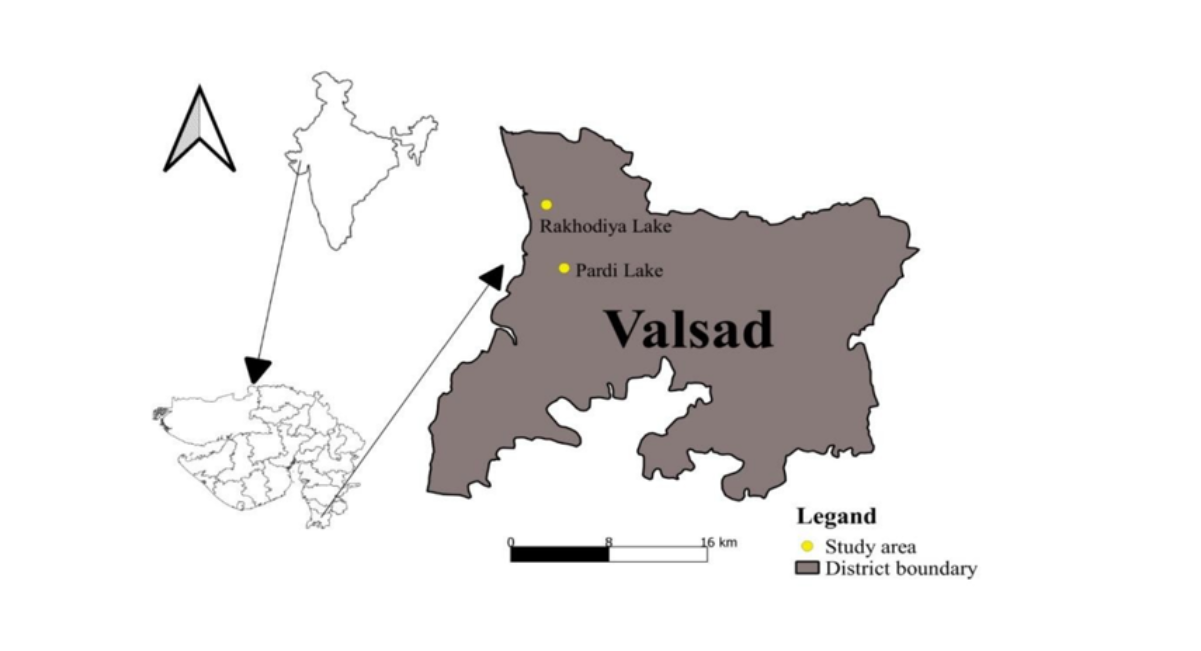
Figure 1: GIS Map of Selected Study Sites of Valsad District, Gujarat, India
Water Sampling and Analysis
Water sampling was done in the post-monsoon season (October 2020). The water sample was filtered (through 0.45 µm pore size filter) and filled in 500 ml plastic bottles from three portions separately (from the periphery to middle) from selected sites. Before the collection of the water sample, plastic bottles were washed with source water. After collection, water samples were brought to the laboratory for further study. The tests were performed by following standard methods given by S. K. Maiti and APHA [18,19]. Heavy metal analysis was done with ICPA (Inductive Coupled Plasma Analyzer) (Perkin-Elmer ICP Optima 3300 RL, U.S.A.) at SICART (Sophisticated Instrumentation Center for Applied Research and Testing), Vallabh Vidyanagar, Gujarat. The heavy metal concentration was represented in the ppm unit.
Macrophyte Analysis
To study the floristic compositions of macrophyte species at selected study sites, field trips were done throughout the study to collect & record precisely aquatic macrophyte species & identification by the floras [20,21]. The macrophyte species were categorized according to the system of Raunkiaer’s life form classification system [22].
Statistical Analysis
The statistical analysis such as the measurement of Shannon’s index, Bivariate linear model, and CCA (Canonical correspondence analysis) plots was done using PAST 4.03 software.
Sampling Design (Method)
Stratified Random Sampling: Divide the water body (e.g., lakes, rivers, or wetlands) into distinct zones based on the level of anthropogenic pollution (e.g., near municipal runoff, industrial discharges, and a clean control site).
Quadrat Method: Within each zone, place \(1\text{ m}\times 1\text{ m}\) quadrats to evaluate plant communities. The placement should either be random or along a transect line extending from the shore into deeper water.
Transect Walk/Zigzag Method: For rivers, a \(100\text{-meter}\) stretch is commonly surveyed by walking or using a boat in a zigzag pattern from bank to bank to ensure all species micro-habitats are covered. 2. Sample Size (Replicates)
Quadrate Counts: Most established phytosociological studies use a minimum sample size of \(5\) to \(10\) replicate quadrats per designated sampling site [23].
Total Quadrat Area: A cumulative quadrat area of \(10\text{ m}^2\) to \(20\text{ m}^2\) per site is typically required to capture a statistically representative view of the macrophyte community.
Temporal Replication: Because aquatic plant assemblages vary throughout the year, sampling is repeated across different seasons (e.g., pre-monsoon, monsoon, and post-monsoon) to account for life-cycle fluctuations
RESULTS
Total 45 vascular macrophytes were recorded, which belong to 26 families (Table:1), where Araceae was the most abundant family (6 species, 23.07 %) of the total flora, followed by the Cyperaceae family (5 species, 19.23 %), Boraginaceae (4 species, 15.38 %). Meanwhile, the following families consists two species (7.69 %) for each, Asteraceae, Commelinaceae, Convolvulaceae, Hydrocharitaceae, Lythraceae, Nymphaeceae, Poaceae, and another 16 families were considered as monospecific ones (Fig: 2). During the study, 31 species were in the polluted wetland (68.89 %) and 40 species were in the non-polluted wetland (88.89 %) and 26 species (57.78 %) were in both groups. From the results, it can be observed that the number of macrophyte species adapted to the highly polluted wetland is generally lower than the wetland which carried fewer pollutants. Group X (polluted wetland) presented 3.277 and group Y (non-polluted wetland) presented 3.574 Shannon’s index. A bivariate linear model separates the two groups. This application revealed a highly significant difference between the floristic composition of these two groups (Fig: 4). Remarkably Ammannia baccifera, Ipomoea fistulosa, and Leersia hexandra equally cover both groups . Eichhornia crassipes was the dominant species in the polluted wetland and Ceratophyllum demersum was the dominant at in the non – polluted wetland (Table: 1). On the other hand, many species ( Heliotropium indicum, Heliotropium ovalifolium, and Heliotropium supinum) of the Boraginaceae family represented only polluted wetland and was restricted to the non-polluted wetland. Similarly, Bacopa monnieri, Chara, Coldenia procumbens, Cyperus difformis, Grangea maderaspatana, Hydrolea zeylanica, Lemna trisulca, Limnophyton obtusifolium, Marselia quadrifolia, Nelumbo nucifera, Nymphaea nouchali, Nymphoides indicum, Pistia stratiotes, and Utricularia aurea were only non-polluted wetland and was found in polluted wetland (Table: 1). Other species found were scattered throughout the study period in small strands.
|
SPECIES |
FAMILY |
% F IN POL |
% F IN NON -POL |
EC |
LC |
|
Species represented in a polluted and non-polluted wetland |
|||||
|
Alternanthera sessilis (L.) Dc. |
Amaranthaceae |
20 |
15 |
ER |
TP |
|
Ammania baccifera L. |
Lythraceae |
15 |
15 |
ER |
TP |
|
Ammania multiflora Roxb. |
Lythraceae |
10 |
30 |
ER |
TP |
|
Bergia ammanniodes Roxb. |
Elatinaceae |
15 |
10 |
ER |
CP |
|
Ceratophyllum demersum L. |
Ceretophyllaceae |
55 |
45 |
SNR |
TP |
|
Colocasia esculenta (L.) Schott |
Araceae |
20 |
35 |
AR |
CP |
|
Commelina benghalensis L. |
Commelinaceae |
25 |
30 |
AR |
HCP |
|
Commelina diffusa Burm. f. |
Commelinaceae |
20 |
30 |
AR |
HCP |
|
Cyperus alopecuroides Rottb. |
Cyperaceae |
10 |
20 |
ER |
HCP |
|
Cyperus articulatus L. |
Cyperaceae |
20 |
15 |
ER |
HCP |
|
Cyperus compressus L. |
Cyperaceae |
20 |
25 |
ER |
HCP |
|
Cyperus iria L. var. iria |
Cyperaceae |
15 |
20 |
ER |
HCP |
|
Eichhornia crassipes (Mart.) Solm |
Pontedariaceae |
70 |
20 |
FF |
CP |
|
Eragrostis ciliata (Roxb.) Nees |
Poaceae |
15 |
10 |
ER |
HCP |
|
Hydrilla verticillata (L. f.) Royle |
Hydrocharitaceae |
45 |
40 |
SR |
CRP |
|
Ipomoea aquatica Forsk. |
Convolvulaceae |
35 |
25 |
FR |
HCP |
|
Ipomoea fistulosa Mart. ex Choisy |
Convolvulaceae |
20 |
20 |
ER |
CP |
|
Leersia hexandra Sw. |
Poaceae |
15 |
15 |
AR |
HCP |
|
Lemna minor L. |
Araceae |
55 |
35 |
FF |
TP |
|
Ludwigia hyssopifolia L. |
Onagraceae |
20 |
15 |
FR |
HCP |
|
Oldenlandia corymbosa L. |
Rubiaceae |
25 |
5 |
ER |
TP |
|
Polygonum glabrum Willd. |
Polygonaceae |
30 |
25 |
AR |
HCP |
|
Spirodela polyrhiza (L.) Schleid. |
Araceae |
45 |
30 |
FF |
TP |
|
Typha angustata Bory & Chaub. |
Typhaceae |
25 |
10 |
ER |
CP |
|
Vallisneria spiralis L. |
Hydrocharitaceae |
40 |
20 |
SR |
CP |
|
Wolffia arrhiza (L.) Wimmer |
Araceae |
45 |
25 |
SR |
CRP |
|
Species represented only in a polluted wetland |
|||||
|
Azolla pinnata R. Br. |
Salviniaceae |
50 |
FF |
TP |
|
|
Eclipta prostrata (L.) L. |
Asteraceae |
25 |
ER |
CP |
|
|
Heliotropium indicum L. |
Boraginaceae |
20 |
ER |
CP |
|
|
Heliotropium ovalifolium Forsk. |
Boraginaceae |
10 |
ER |
CP |
|
|
Heliotropium supinum L. |
Boraginaceae |
5 |
ER |
CP |
|
|
Species represented only in a non-polluted wetland |
|||||
|
Bacopa monnieri (L.) Pennell |
Scrophulariaceae |
15 |
AR |
HCP |
|
|
Chara sp. |
Chlororophyceae |
40 |
SNR |
TP |
|
|
Coldenia procumbens L. |
Boraginaceae |
15 |
ER |
TP |
|
|
Cyperus difformis L. |
Cyperaceae |
10 |
ER |
HCP |
|
|
Grangea maderaspatana (L.) Poir. |
Asteraceae |
5 |
ER |
TP |
|
|
Hydrolea zeylanica (L.) Vahl |
Hydroleaceae |
15 |
ER |
HCP |
|
|
Lemna trisulca L. |
Araceae |
35 |
FF |
TP |
|
|
Limnophyton obtusifolium (L.) Mi |
Alismataceae |
25 |
FR |
HCP |
|
|
Marselia quadrifolia L. |
Marsileaceae |
25 |
AR |
TP |
|
|
Nelumbo nucifera Gaertn. |
Nymphaeceae |
20 |
FR |
CRP |
|
|
Nymphaea nouchali Willd |
Nymphaeceae |
10 |
FR |
CRP |
|
|
Nymphoides indicum (L.) O. Ktze. |
Gentianaceae |
5 |
FR |
CRP |
|
|
Pistia stratiotes L. |
Araceae |
20 |
FF |
TP |
|
|
Utricularia aurea Lour. |
Lentibulariaceae |
30 |
SR |
CRP |
Table 1: Recorded Species, Families, Presence Percentage Frequency in Polluted Sites (F % In Pol.), Presence Percentage Frequency in Non-Polluted Sites (F% In Non.), Life Form Classification (LC) & Ecological Classification (EC) of the Recorded Species in the Studied Wetland
Note: EC (Ecological classification) abbreviations: FF= Free-floating, FR= Floating but rooted, SR= Submerged but rooted, SNR= Submerged but not rooted, AR= Amphibious and rooted, ER= Emergent but rooted. LC (Life form classification) abbreviations: CP= Chamophytes, HCP= Hemicryptophytes, CRP= Cryptophytes, TP= Therophytes.
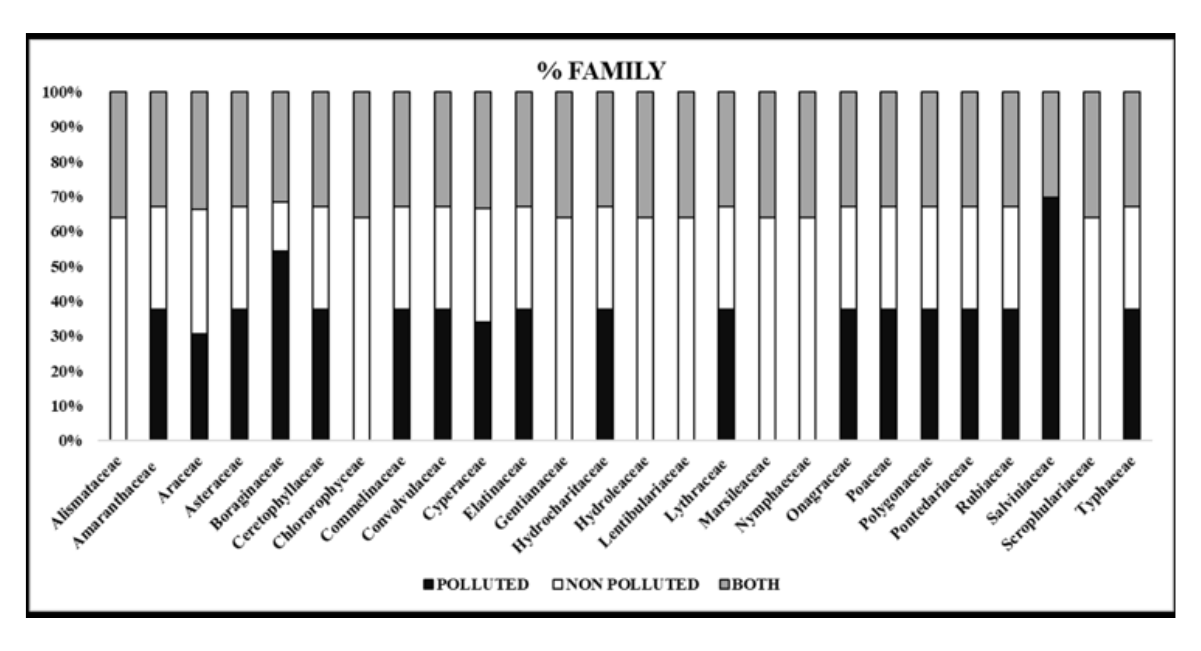
Figure 2: Percentages of Species in the Represented Families in Polluted Wetland, in Non-Polluted Wetland, in both Polluted and Non-Polluted Wetland
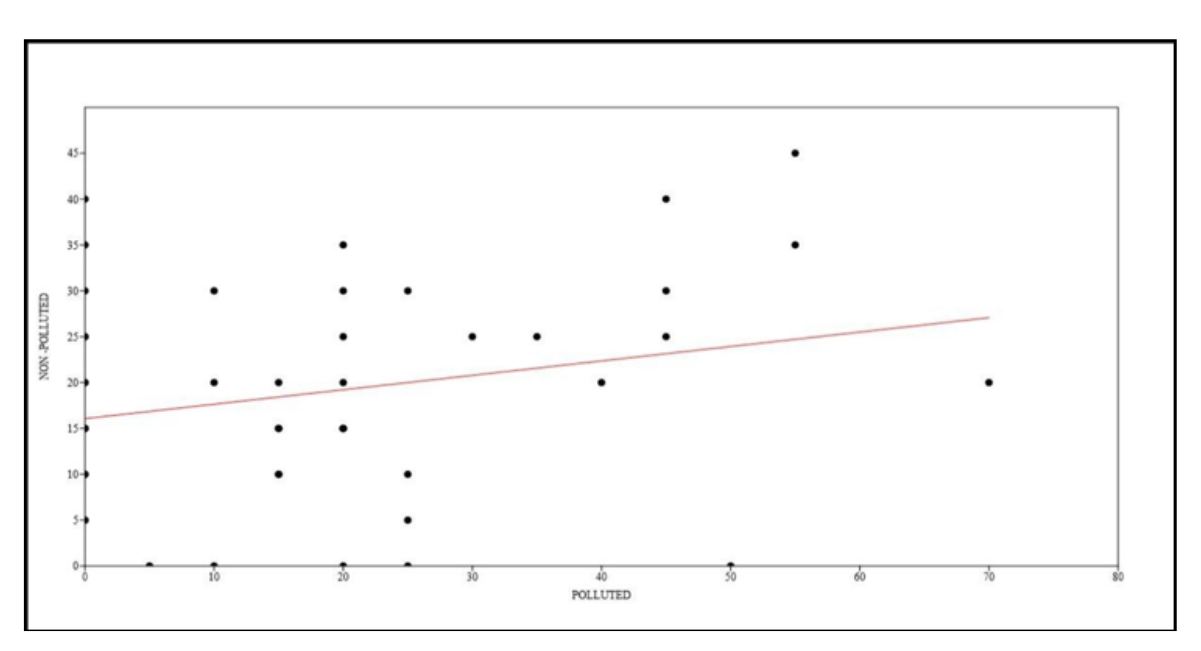
Figure 3: Bivariate Linear Model, Separating the Vegetation Groups and Environmental Variables
ANOVA (Analysis of Variance): Used to test for significant differences in plant biomass, heavy metal bioaccumulation, or diversity indices between different sampling sites or across varying seasons. [1,2]
Pearson’s or Spearman’s Correlation Analysis: Used to determine the strength and direction of associations between ecological metrics (e.g., Shannon diversity) and water quality parameters (e.g., dissolved oxygen, pH, BOD).
At the selected wetland sites, emergent macrophytes were the dominant category at both sites where 51.6 % represented the polluted wetland and 40.0 % represented non-polluted wetland followed by amphibious macrophytes, free-floating macrophytes, submerged but rooted, floating but rooted macrophytes category are limited species (group X represented only 3.22 % and group Y represented 5 %) represented the submerged but not rooted category (Fig: 3, a) [24]. Results of the Raunkiaer’s life form classifications showed that the location of the macrophyte buds were mostly half hidden (hemicryptophytes, 35.48 %) or near to ground (chamophytes, 32.26 %) at selected wetlands. 25.8 % of macrophytes were therophytes and only 6.5 % of macrophytes show the location of the bud below the surface level. Phenerophytes were absent at the selected sites (Fig: 3, b).
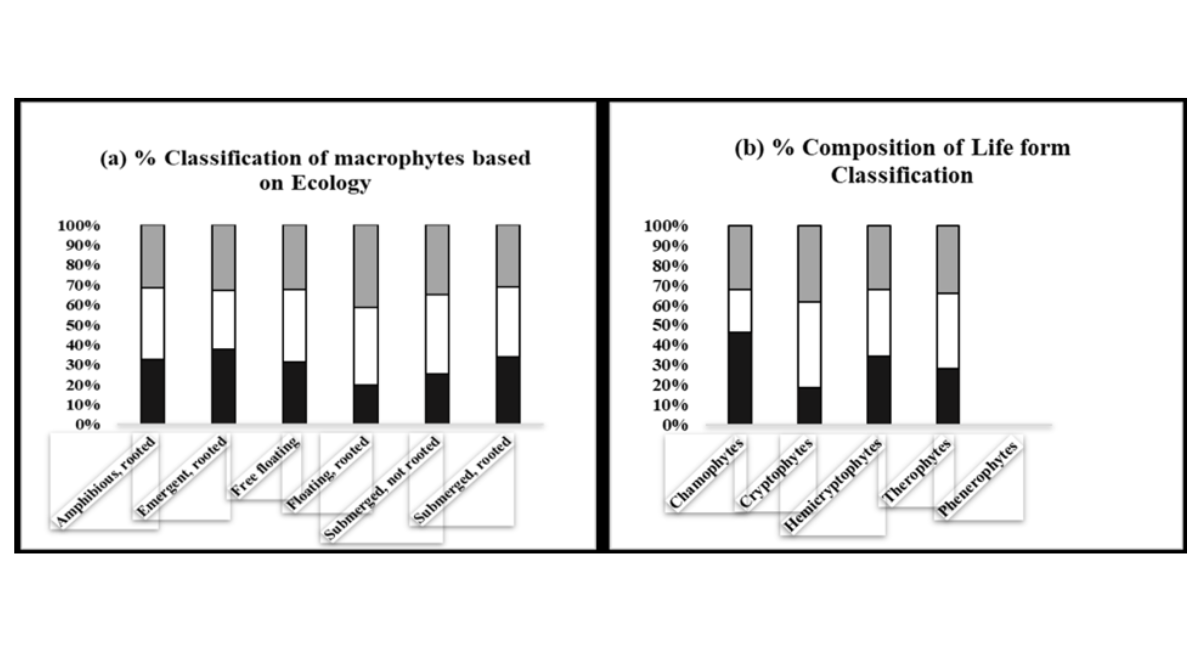
Figure 4: (a) Percentage Classification of Macrophytes Based on Ecology,
(B): Percentage Composition of Life Form Classification
The relationship between the macrophytes and water variables was studied using Canonical correspondence analysis (CCA). Figure: 5 showed the significant correlation between the water parameters and Table: 2 showed inter-set correlations which is derived from the canonical correspondence analysis (CCA) of the examined water parameters. Heavy metal contamination was present in the polluted wetland but in the non-polluted wetland, the heavy metals were not in the detection range. Turbidity and Temperature showed a positive relationship. Due to the lake water sample, sites showed the basic pH which is highly positive with turbidity [25]. High DO (Dissolved Oxygen) indicates the less amount of contamination and high BOD (Biological Oxygen Demand) indicate a large amount of contamination present in the lake, DO and BOD were negatively correlated with each other (Fig: 5)
|
Water parameter |
|
Polluted (X) |
Non-polluted (Y) |
|
Turbidity |
NTU |
3.6 ± 0.3 |
2.6 ± 0.7 |
|
Temperature |
°C |
34 ± 1.1 |
33 ± 0.9 |
|
pH |
7.9 ± 0.8 |
7.6 ± 0.6 |
|
|
DO |
mg/L |
7.7 ± 0.45 |
8.4 ± 0.1 |
|
Alkalinity |
mg/L |
163 ± 11.2 |
129 ± 18.4 |
|
COD |
mg/L |
58 ± 0.29 |
63 ± 0.21 |
|
BOD |
mg/L |
5.9 ± 0.9 |
4.3 ± 0.2 |
|
TDS |
mg/L |
593.2 ± 16.8 |
356.3 ± 10.0 |
|
EC |
ms /cm |
363.4 ± 12.1 |
149.2 ± 9.3 |
|
Salinity |
ppt |
1.1 ± 0.1 |
0.6 ± 0.2 |
|
Free CO2 |
mg/L |
19.2 ± 0.9 |
24.3 ± 0.7 |
|
Total Hardness |
mg/L |
178 ± 6.3 |
145 ± 4.5 |
|
Nitrate |
mg/L |
7.6 ± 0.3 |
6.4 ± 0.2 |
|
Phosphate |
mg/L |
0.12 ± 0.0 |
0.01 ± 0.0 |
|
Fe |
mg/L |
0.13 ± 0.1 |
0.11 ± 0.0 |
|
Zn |
mg/L |
0.12 ± 0.2 |
N. D |
|
Ni |
mg/L |
0.12 ± 0.1 |
N. D |
Table 2: Mean Values ± SE of the Water Variables in the Polluted and Non-Polluted Vegetation Groups (X And Y) of Macrophytes
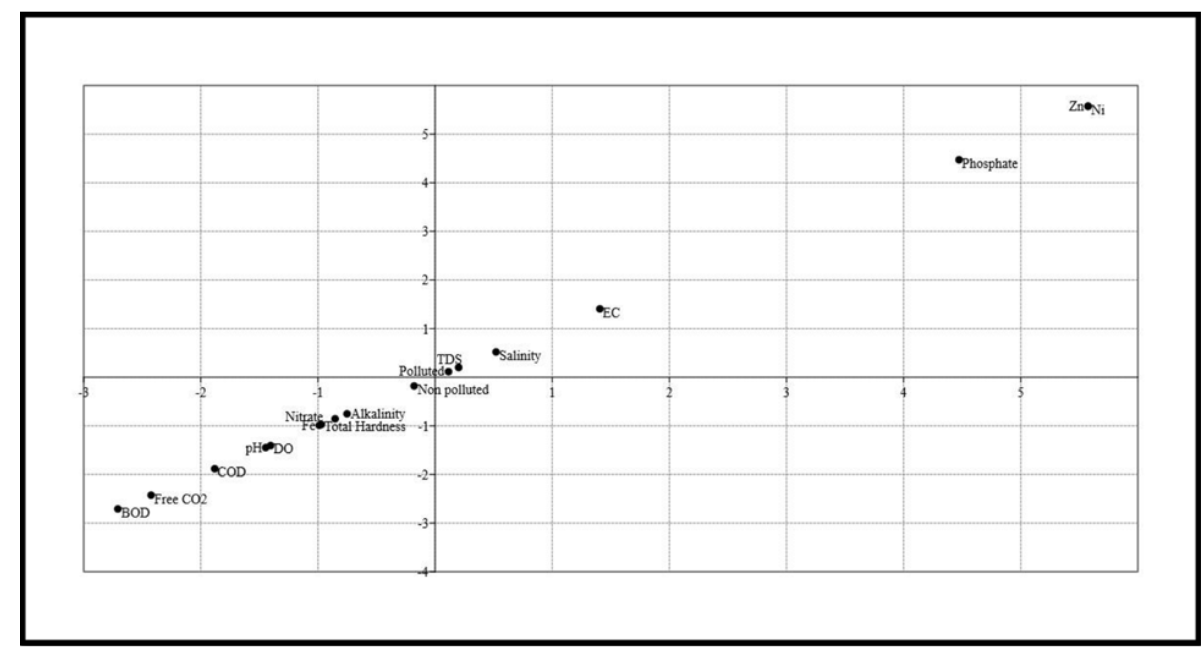
Figure 5: CCA Biplot, Distribute the Environmental Variables and their Relation
Species Data: Macrophyte composition and abundance (phytosociology) across multiple sampling sites (e.g., presence-absence or percentage cover).
Environmental Data: Measured physicochemical parameters of the water and sediment at those sites (e.g., pH, Electrical Conductivity, Biological Oxygen Demand (BOD), Dissolved Oxygen (DO), and heavy metal concentrations). Ecological classification of lakes based on macrophyte phytosociology identifies non-polluted systems via high diversity, while polluted, eutrophic lakes are marked by low diversity, high density, and dominance of species like Eichhornia crassipes. Key quantitative metrics for polluted conditions include Shannon-Wiener index values below 1.5, Simpson dominance indices (D) above 0.6, and Abundance/Frequency (A/F) ratios exceeding 0.05.
Submerged vs. Emergent: Submerged macrophytes absorb metals directly through their thin cuticles across the entire water column. Emergent and floating plants (like Eichhornia crassipes or Typha angustata) rely primarily on root systems to filter sediment and extract metal ions [26].
Bioaccumulation: Macrophytes have a low capacity to regulate the uptake of heavy metals. They act as "chemical bioconcentrators" absorbing high concentrations without degrading them.
Impact on Phytosociology (Community Dynamics)
Reduction in Species Richness: High concentrations of toxic metals cause physiological distress (chlorosis, necrosis, and stunted growth), frequently eliminating sensitive species from the ecosystem.
Dominance Shifts: Hardy, metal-tolerant hyperaccumulators (e.g., Eichhornia crassipes or Ipomoea aquatica) often outcompete other native flora, leading to an entirely altered sociological composition and reduced overall biodiversity.
Biomass Reduction: Toxic levels of metals disrupt photosynthesis and nutrient absorption, which rapidly reduces the total biomass of dominant producers. Because certain native macrophytes heavily bioaccumulate these toxins, researchers often use them to assess the pollution status of local wetlands. For example, in regional wetland studies (such as those conducted at the Pariyej Community Reserve in Gujarat), species like Nelumbo nucifera and Eichhornia crassipes are frequently identified as key accumulators of Zn, Cu, and Pb [27].
Such species show promise for Example Location Finder (often utilized for green bioremediation efforts to clear out toxic industrial effluents).
Decomposition Release: When macrophytes die and decay, the heavy metals stored in their roots, stems, and leaves are released back into the aquatic environment and the underlying sediments. This reintroduces the toxins into detritus food chains, posing severe biomagnification threats to grazing molluscs, fish.
Pre-Monsoon (Summer): Characterized by high temperatures, maximum light penetration, and low water levels. Pollutant concentrations (e.g., heavy metals, nutrients) are often at their highest due to evaporation.
Monsoon (Rainy Season): Marked by water level fluctuations, high turbidity from runoff, and heavy sedimentation. This season usually sees the highest species diversity due to seed germination and amphibious plant growth [28,29].
Post-Monsoon (Autumn/Early Winter): A stabilization phase with clear water and peak vegetative biomass for many species.
Winter: Colder temperatures and lower light cause growth retardation and decay for many species, particularly those susceptible to pollution-induced deoxygenation
CONCLUSION
Pollution was there at the selected study site due to the high anthropogenic activities surrounding the study area. A general reduction of macrophytes present at group X is because of the high pollutants present in it as compared to group Y. Reduction in macrophyte diversity and species richness observed at studied wetland was supposedly linked to the pollution status of the water parameters which could exhibit phytotoxic effects on macrophytes and colonization process.
Species Loss & Dominance: As water quality degrades, sensitive submerged species (e.g., Hydrilla spp.) decline, while highly adaptive, free-floating plants (like Eichhornia crassipes / Water Hyacinth) thrive and create dense monocultures.
Reduced Diversity: Phytosociological indices (such as Species Richness, Frequency, and Dominance) notably decline in polluted reaches, showing an absence of rare or pollution-intolerant plant communities.
Growth Retardation: High concentrations of heavy metals (like Copper or Cadmium) inflict physiological stress, causing reduced growth rates, impaired reproduction, and damaged root cell membranes.
Nutrient Overload: Excess nitrogen and phosphorus (from agricultural runoff and urban sewage) stimulate explosive algal blooms.
Light & Nutrient Deprivation: This excessive algal and phytoplankton growth blankets the water surface and competes with rooted macrophytes for light, CO₂, and essential nutrients, ultimately stifling submerged plant growth.
Habitat and Food Chain Disruption
Oxygen Depletion: When dense mats of invasive weeds or dead algae decay, they consume massive amounts of dissolved oxygen (DO), creating hypoxic conditions that kill off fish and aquatic invertebrates.
Loss of Shelter: Submerged macrophytes provide critical micro-habitats for fish and microinvertebrates. The disappearance of these plants removes nursery grounds for fish and disrupts the base of the food web.
Toxicity and Altered Water Chemistry
Metal Accumulation: Macrophytes are primary bioindicators and can accumulate high concentrations of heavy metals (like Lead, Chromium, and Zinc) in their tissues.
Increased Turbidity: The death of rooted plants removes their sediment-stabilizing effect, leading to higher water turbidity, which further suppresses light penetration and plant growth.
Pollution and eutrophication significantly reduce aquatic macrophyte species diversity while promoting the dominance of tolerant, invasive species and lowering overall community complexity. Key findings include structural shifts toward increased density of hardy species, coupled with reduced chlorophyll content and impaired development of submerged vegetation.
ACKNOWLEDGEMENTS
The authors are thankful to SICART (Sophisticated Instrumentation Center for Applied Research and Testing), Vallabh Vidyanagar, Gujarat for analysis, and also thankful to UGC New Delhi – NFOBC for financial support.
REFERENCES
- Van Oosten MJ, Maggio A. Functional biology of halophytes in the phytoremediation of heavy metal contaminated soils. Environmental and experimental botany. 2015;111:135-46. [Crossref] [Google Scholar]
- Karaouzas I, Kapetanaki N, Mentzafou A, Kanellopoulos TD, Skoulikidis N. Heavy metal contamination status in Greek surface waters: A review with application and evaluation of pollution indices. Chemosphere. 2021 ;263:128192. [Crossref] [Google Scholar] [PubMed]
- Nielsen A, Trolle D, Søndergaard M, Lauridsen TL, Bjerring R, Olesen JE, et al. Watershed land use effects on lake water quality in Denmark. Ecological applications. 2012;22(4):1187-200. [Crossref] [Google Scholar] [PubMed]
- Miretzky P, Saralegui A, Cirelli AF. Aquatic macrophytes potential for the simultaneous removal of heavy metals (Buenos Aires, Argentina). Chemosphere. 2004;57(8):997-1005. [Crossref] [Google Scholar] [PubMed]
- Barbier EB. Wetlands as natural assets. Hydrological Sciences Journal. 2011;56(8):1360-73. [Crossref] [Google Scholar]
- Ghosh S, Dinda S, Chatterjee ND, Das K. Analyzing risk factors for shrinkage and transformation of East Kolkata Wetland, India. Spatial Information Research. 2018;26(6):661-77. [Crossref] [Google Scholar]
- Yuan H, Zhang R. Changes in wetland landscape patterns on Yinchuan Plain, China. International Journal of Sustainable Development & World Ecology. 2010;17(3):236-43. [Crossref] [Google Scholar]
- Gogoi P, Sinha A, Das Sarkar S, Chanu TN, Yadav AK, Koushlesh SK, et al. Seasonal influence of physicochemical parameters on phytoplankton diversity and assemblage pattern in Kailash Khal, a tropical wetland, Sundarbans, India. Applied water science. 2019;9(7):156. [Crossref] [Google Scholar]
- Marwat SK, Usman K. Weeds of wheat crop and their control strategies in Dera Ismail Khan district, Khyber Pakhtun Khwa, Pakistan. American Journal of Plant Sciences. 2013;4(1):66-76. [Crossref] [Google Scholar]
- Chambers PA, Lacoul P, Murphy KJ, Thomaz SM. Global diversity of aquatic macrophytes in freshwater. Hydrobiologia. 2008;595(1):9-26. [Crossref] [Google Scholar]
- Parmar S, Singh V. Phytoremediation approaches for heavy metal pollution: a review. J Plant Sci Res. 2015;2(2):135. [Google Scholar]
- Mackay SJ, James CS, Arthington AH. Macrophytes as indicators of stream condition in the wet tropics region, Northern Queensland, Australia. Ecological Indicators. 2010;10(2):330-40. [Crossref] [Google Scholar]
- Rameshkumar S, Radhakrishnan K, Aanand S, Rajaram R. Influence of physicochemical water quality on aquatic macrophyte diversity in seasonal wetlands. Applied water science. 2019;9(1):12. [Crossref] [Google Scholar]
- Muoghalu JI. Priority parameters: abiotic and biotic components. UNESCO Encyclopedia of Live Support Systems, Environmental Monitoring. 2009;1:21-38. [Google Scholar]
- Elo M, Alahuhta J, Kanninen A, Meissner KK, Seppälä K, Mönkkönen M. Environmental characteristics and anthropogenic impact jointly modify aquatic macrophyte species diversity. Frontiers in Plant Science. 2018;9:1001. [Crossref] [Google Scholar] [PubMed]
- Zhang CB, Wang J, Liu WL, Zhu SX, Ge HL, Chang SX, et al. Effects of plant diversity on microbial biomass and community metabolic profiles in a full-scale constructed wetland. Ecological Engineering. 2010;36(1):62-8. [Crossref] [Google Scholar]
- Kumar S, Dutta V. Constructed wetland microcosms as sustainable technology for domestic wastewater treatment: an overview. Environmental science and pollution research. 2019;26(12):11662-73. [Crossref] [Google Scholar] [PubMed]
- Maiti SK. Handbook of methods in environmental studies. Jaipur: ABD publishers; 2003. [Google Scholar]
- American Public Health Association. Standard methods for the examination of water and wastewater. 1926. [Google Scholar]
- Shah GL. Flora of Gujarat state. 1978. [Google Scholar]
- Cooke T. The flora of the presidency of Bombay. Bishen Singh Mahendra Pal Singh; 1903. [Crossref] [Google Scholar]
- Raunkiaer C. The life forms of plants and statistical plant geography; being the collected papers of C. [Crossref] [Google Scholar]
- ANOLIEFO G, Ikhajiagbe B. Eco-taxonomic distribution of plant species around motor mechanic workshops in Asaba and Benin City, Nigeria: Identification of oil tolerant plant species. 2010. [Google Scholar]
- Ceschin S, Leacche I, Pascucci S, Abati S. Morphological study of Lemna minuta Kunth, an alien species often mistaken for the native L. minor L.(Araceae). Aquatic Botany. 2016;131:51-6. [Crossref] [Google Scholar]
- Conesa HM, García G, Faz Á, Arnaldos R. Dynamics of metal tolerant plant communities’ development in mine tailings from the Cartagena-La Unión Mining District (SE Spain) and their interest for further revegetation purposes. Chemosphere. 2007;68(6):1180-5. [Crossref] [Google Scholar] [PubMed]
- Horrocks M, Bedford S. Microfossil analysis of Lapita deposits in Vanuatu reveals introduced Araceae (aroids). Archaeology in Oceania. 2005;40(2):67-74. [Crossref] [Google Scholar]
- Khan MA, Marwat KB, Gul B, Wahid F, Khan H, Hashim S. Pistia stratiotes L.(Araceae): Phytochemistry, use in medicines, phytoremediation, biogas and management options. Pakistan Journal of Botany. 2014;46(3):851-60. [Google Scholar]
- Luzuriaga AL, Escudero A, Olano JM, Loidi J. Regenerative role of seed banks following an intense soil disturbance. Acta Oecologica. 2005;27(1):57-66. [Crossref] [Google Scholar]
- Ting WH, Tan IA, Salleh SF, Wahab NA. Application of water hyacinth (Eichhornia crassipes) for phytoremediation of ammoniacal nitrogen: A review. Journal of water process engineering. 2018;22:239-49. [Crossref] [Google Scholar]
Article Processing Timeline
| 2-5 Days | Initial Quality & Plagiarism Check |
| 25-35 Days |
Peer Review Feedback |
| 45-60 Days | Total article processing time |
Ethics & Policies
Editorial & Management
Useful Links
Journal Highlights
Open Access Journals
Journal Flyer